Abstract
Objective
Evaluation of elite athletes’ psycho-physiological condition at various stages of preparation and in international competition.
Design
Athletes were tested during training and participation in international competition using methods of galvanic skin response (GSR) and gas discharge visualization (GDV).
Setting
Saint Petersburg Federal Research Institute of Physical Culture and Sport, Russia and Paralympic athletic training camp, Norway.
Participants
Eighteen athletes from Russia’s Skiing and Biathlon Paralympic Team. All athletes had some level of damage to their musculoskeletal system.
Main outcome measures
Stress level (SL), energy potential (EP), and psycho-emotional tension (PET).
Results
It was found that the higher the level of EP achieved by the athlete in the training period, the lower the SL in the competition time. The SL of an athlete recorded in the training period significantly correlates with the SL both before and at the time of competition. The PET and SL before the World Cup was negatively correlated to the results of skiing competitions.
Conclusion
Evaluation of PET, EP, and SL through GSR and GDV offers a fast, highly precise, non-invasive method to assess an athlete’s level of readiness during both training and at the time of competition.
Video abstract
Point your SmartPhone at the code above. If you have a QR code reader the video abstract will appear. Or use:
Introduction
The challenge of express-evaluation of the psycho-physiological condition of athletes for timely correction of the training process is common in all sports.Citation1–Citation4 This is particularly important for highly competitive athletes in which a significant amount of money and resources are being invested into their training processes. Currently, such evaluations are made both through subjective and objective measures, with each type of measurement being beneficial in its own way, and each type of measurement having its respective drawbacks. Subjective tools are often in the form of questionnaires for athletes and those working with the athletes. Objective tools include functional lung, heart rate variability, and electroencephalogram tests.
While the information obtained from subjective tools does have its place, it faces a problem inherit to non-objective metrics: subjectivity. As such, the information provided can be skewed by inaccurate perceptions on the part of the reporter. For example, a coach may choose to focus on a particular area with an athlete during practice. If the athlete improves in this area as a result of the coach’s attention, the coach may believe the athlete ready for competition and report such on a questionnaire. However, the coach’s perception does not take into account that this same athlete may be dealing with significant mental stress in their home life and has serious doubts about their ability to perform certain other tasks on the athletic field. In short, subjective metrics can only report what they see or experience directly. What is seen and experienced directly is heavily influenced by perception. If the reporter’s perception is in some way skewed, what is seen will also be skewed and thus reported.
Objective metrics on the other hand are less influenced by perception, yet still face a different hurdle with regards to training: logistics. One logistical limitation is that many devices used for these types of measurements are large, cumbersome, and not easily transportable. Another such limitation is the processing time necessary for feedback. If the results are going to be implemented in some way in order to enhance training quickly, they must be obtained quickly. This should be done with as little effort as possible on the parts of the athlete and coaching staff. An athlete’s daily routine is often tightly scheduled, and leaves little room for time-intensive measurements. This is especially true during competition periods. A final limitation is the often invasive nature of many currently available tests. For example, energy assessments obtained from infrequently having one’s blood drawn to measure various levels of key metabolites may be uncomfortable yet understandable to an athlete. However, daily blood withdrawals to measure those same parameters would no doubt be less palatable to that same competitor. It is for these reasons that portable, rapid, non-invasive evaluation devices are desirable.Citation6
The goals of this study were: (1) to test the ability of different instruments to provide rapid evaluation of athletes’ levels of preparedness in training and competition; and (2) to identify the most sensitive parameters for assessing athletic preparedness. Previously, similar Russian studies have looked at a host of outcomes in order to determine athletic preparedness.Citation5–Citation7 These studies have been very important in laying the groundwork for our current research. It is from these works that the authors believe the outcome measures of Stress level (SL), energy potential (EP), and psycho-emotional tension (PET) may be the most informative parameters to assess athletic preparedness. It is our belief that this work is the first to exclusively examine the sensitivity of these three parameters for this purpose.
Methods
The following methods and corresponding hand-held devices for athletes’ express-analysis were used in the study:
Evaluation of the PET by measuring galvanic skin response (GSR) with the Mirage device (MEDPASS Co, St Petersburg, Russia). Measuring electrodes were fixed on the pads of the index and ring fingers.Citation8
Evaluation of EP and SL by the gas discharge visualization (GDV) technique with the GDV-Sport device (Biotechprogress Co, St Petersburg, Russia). Measurements were taken from all ten fingers.
EP is a measure of the psycho-physiological condition of an athlete; it is calculated as a percentage ranging from 0 to 100%. EP = 100% is correlated with a high level of competitive readiness and a high energy reserve.
SL characterizes the level of anxiety and stress, measured on a scale from 0 to 10. SL = 10 is correlated with a high anxiety level and poor competitive readiness. Interpretation criteria are given in .
Table 1 Interpretation criteria for EP and SL indexes
GDV technology is based on the well-known Stress level (SL), energy potential (EP), and psycho-emotional tension (PET): when an object is placed on a glass plate and stimulated with a current, a visible glow occurs and the gas discharges. With GDV bioelectrography cameras, the Kirlian effect is quantifiable and reproducible for scientific research purposes. Images captured of all ten fingers on each human subject provide detailed information on the person’s psychosomatic and physiological state.Citation9 The GDV camera systems and their accompanying software are being used in medicine and psychology.Citation10–Citation14 Through investigating the fluorescent fingertip images, which dynamically change with emotional and health states, one can identify areas of congestion or health in the whole system. The mild electrical stimulation initiated by the GDV creates a neurovascular reaction that registers on the skin. The characteristics of this reaction are influenced by the nervous-humoral status of all organs and systems. Images of these reactions are digitally captured and analyzed. In addition, for most healthy people GDV readings vary less than 10% over time, indicating a high level of precision in this technique.Citation15,Citation16 It is interesting to note that using GDV technology over the course of several years to study Russian Paralympic teams, no significant differences between Paralympic athletes and a healthy population were found.Citation5 At the same time, analysis of data for handicapped individuals in Russia with the same type of problems indicated much worse states of their psycho-physiological condition. This suggests that athletic training may play a vital role in maintaining the body’s energy level along with other key homeostatic parameters. For years GDV technology has been accepted by the Russian Ministry of Sport as one of several techniques used to rapidly evaluate an athletes’ psycho-physiological state.Citation17
Athletes were measured every morning before breakfast. Throughout this study 204 measurements were taken in the training camp and 189 measurements were taken before and during the process of the Paralympic World Cup competition.
Participants
This study was conducted in an athletic research facility at Saint Petersburg Federal Research Institute of Physical Culture and Sport in Russia as well as at an athletic training camp in Norway from November 16 to December 18, 2011. During this time athletes were in the preparation process for the upcoming World Cup competition. A total of 18 athletes from Russia’s Skiing and Biathlon Paralympic Team volunteered to participate in this study. The athletes included four women and 14 men; nine athletes of top level, age 32.5 ± 8 years, (LW5/7, LW6, LW8, LW10, and LW12 in accordance with International Paralympic Committee classification), six athletes of middle level, age 24 ± 5 years (LW2 and LW12), and three preparatory level athletes, age 17 years (LW8). All athletes participated in the study voluntarily and with great interest; ethical considerations were taken into account. At the World Cup 2011, participants in this study earned six medals in biathlon (three gold, one silver, and two bronze) and nine medals in skiing (five gold and four silver) at the World Cup.
Statistical analysis
Statistical analyses were carried out using the programs GDV Scientific Laboratory™ (KTI Co, St Petersburg, Russia) and Statistica™ (StatSoft, Tulsa, OK) with one-way analysis of variance modeling (ANOVA). This modeling was selected as the data adhered to each of the necessary assumptions for its use (independence of observations, normal distribution of dependent variables, and homogeneity of variance across groups).
Using the R-values derived from the ANOVA, correlations between the stated variables were determined to be either strong (R > 0.75, P < 0.05), moderate (0.49 < R < 0.75, P < 0.05), or weak (R < 0.49, P < 0.05). For determining negative correlations, the same absolute values were used. This provided the statistical basis for the assessment of our outcome measures.
Results
presents the averaged indexes of PET, EP, and SL for all participants. presents the same individual data for each participant. presents interpretation criteria for EP and SL. – present correlations between the aforementioned indexes and athletic performance.
Figure 1 Athlete averaged parameters.
Abbreviations: EP, energy potential; PET, psycho-emotional tension; SL, stress level.
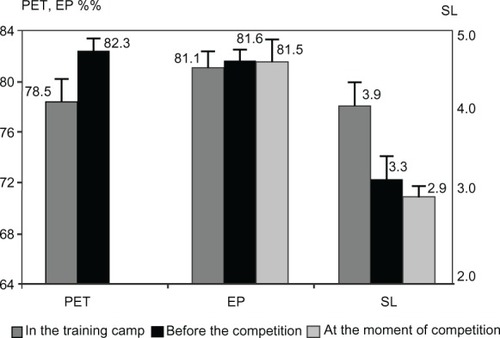
Figure 2 Energy potential and stress levels for athletes.
Abbreviations: EP, energy potential; SL, stress level; WC, World Cup.
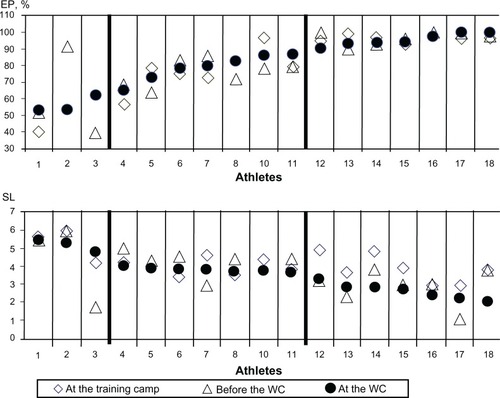
Table 2 Correlations between PET and EP before and in the process of the WC competitions
Table 5 Correlations between competition results and parameters of psycho-physiological condition before and in the process of the WC competitions
compares PET and EP at various stages of training and competition. Here, a strong correlation (R = 0.953, P < 0.001) was observed between EP at the World Cup and EP at the training camp. Moderate correlations were observed between EP before the World Cup and EP at the training camp (R = 0.674, P < 0.01), as well as between EP at the World Cup and EP before the World Cup (R = 0.728, P < 0.01). All other variables considered in were only weakly correlated.
compares PET and SL at various stages of training and competition. Here, moderate correlations were observed between SL and PET at the training camp (R = 0.498, P < 0.05), SL at the World Cup and PET at the training camp (R = 0.491, P < 0.01), SL at the World Cup and SL at the training camp (R = 0.688, P < 0.01), SL before the World Cup and SL at the World Cup (R = 0.554, P < 0.05), and SL before the World Cup and SL at the training camp (R = 0.541, P < 0.05). All other variables considered in were only weakly correlated.
Table 3 Correlations between PET and SL before and in the process of the WC competitions
compares EP and SL at various stages of training and competition. Here, moderate negative correlations were observed between SL and EP before the World Cup (R = −0.620, P < 0.01), SL at the World Cup and EP at the training camp (R = −0.622, P < 0.01), SL at the World Cup and EP before the World Cup (R = −0.495, P < 0.05), and SL and EP at the World Cup (R = −0.699, P < 0.01). All other variables considered in were only weakly negatively correlated.
Table 4 Correlations between EP and SL before and in the process of the WC competitions
compares the results from skiing and the biathlon against SL and PET at various stages of training and competition. In the biathlon, there was a moderate negative correlation in between PET before the World Cup and sprints run on December 10, 2011, PET before the World Cup and long distance races run on December 13, 2011, as well as PET before the World Cup and total results.
In skiing there was a moderate negative correlation between SL at the training camp and long distance races on December 15, 2011 (R = −0.622, P < 0.05), SL at the training camp and sprints on December 17, 2011 (R = −0.713, P < 0.01), and SL at the training camp and total results (R = −0.707, P < 0.05). There was a moderate negative correlation observed between SL before the World Cup and sprints on December 17, 2011 (R = −0.590, P < 0.05). There was also a moderate negative correlation between PET before the World Cup and long distance races on December 15, 2011 (R = −0.574, P < 0.05), PET before the World Cup and sprints on December 17, 2011 (R = −0.540, P < 0.05), PET before the World Cup and middle distance on December 18, 2011 (R = −0.567, P < 0.05), and PET before the World Cup and total results (R = −0.707, P < 0.01). All other variables considered in were only weakly negatively correlated.
Finally, numerous statistical analyses were completed with each of the study’s outcome measures at various stages of training and competition. The outcome measures were also analyzed against the results of each competition. Due to the large number of results that could potentially be reported, the authors elected to fix the absolute value of 0.200 as the minimum R-value necessary for inclusion into the tables provided in this work.
Discussion
Among all outcome measures examined, the strongest correlation was observed between the EP at the World Cup and the EP at the training camp (R = 0.953, P < 0.001, ). The strength of this correlation suggests that a high EP in training camp leads to a high EP during the actual competition. Data in show at least moderate correlations for EP at all other times measured. This also suggests that EP is a relatively static metric for assessing athletic readiness.
Currently, the exact mechanism detailing how a high EP leads to athletic readiness is unclear. However, a theoretical model proposed by the authors postulates that EP may act like a psycho-physiological reservoir for an athlete. The larger the reservoir the more the psycho-physiological resources an individual has access to when energetic resources are demanded, as is the case during athletic competition. If the reservoir is large, then many small, or even a few large demands placed upon it will not cause any major depletion. However, if a person begins training with a small energetic reservoir, even tiny demands may prove unbearable and lead to a rapid depletion of EP. For this reason, the hypothesized relative static nature of EP underscores the importance of achieving a high EP during training camp. Once an athlete has their particular EP established they have in essence set their homeostatic EP level. It should be noted that this EP level exhibits relative homeostasis and while this can fluctuate, it generally maintains within a given range for a period of time once it has been set.Citation18 The correlation data in along with a visual inspection of lend support to this hypothesis.
Another key factor that may lead to the depletion of an individual’s energetic reservoir is having inadequate rest and time for replenishment of their reservoir. In a recent study looking at necessary rest intervals during athletic training, Artioli et al found that repeatedly exposing the body to the rigors of training without adequate rest leads to steady erosion of physical and mental status.Citation19 This erosion may ultimately lead to a breakdown of the system.
Another important aspect of EP is its relationship to stress. In all correlations analyzed, EP was negatively correlated to SL (). This was most pronounced for SL at the World Cup. These results suggest that a high EP may serve a protective function against high stress levels. A low-level stress response is the body’s normal physiological answer when it is challenged in some way. This adaptation is not only beneficial, but also necessary for the maintenance of health and wellness. When the stress response is disproportionate to the stressor, or the stress response is prolonged in some way, other downstream negative effects can take place. A high EP seems to attenuate the stress response in order to keep SL low and within acceptable levels for health and wellness. However, if an individual has a high SL in conjunction with a low EP, not only is their athletic preparedness compromised, they may actually be in need of medical or psychological intervention. In training camp, athletes exhibiting low EPs and high SLs had consultations with professional sports psychologists per study protocol.
A second key observation regarding SL is that it exhibits its own degree of homeostasis. shows that the SL of an athlete recorded in the training period significantly correlates with the SL both before and at the time of competition. Therefore, the SL a person records during the training period will most likely be similar to the SL that same person records at different times throughout the training process. Although SL and EP both tend towards homeostasis, it is the belief of the authors that EP serves as the baseline psycho-physiological marker that resists changes in SL, and not the other way around. This is based on the assumption that as athletes trained and competed in different circumstances (at training camp, before the World Cup, at the World Cup), their stressors changed as well. If SL was unregulated by some other mechanism, changes in stressors would directly register as changes in SL. It was assumed that as the actual World Cup competition approached the stressor associated with competing would increase. However, SL actually decreased as an athlete moved from training camp, to before the World Cup, and then at the World Cup (). shows that athletes with the greatest EP consistently demonstrated the lowest SL in each of the various settings. Similar to SL, PET showed a consistent, inverse relationship to other positive outcomes. shows multiple negative correlations.
Conclusion
A direct measurement of EP and SL in the fast, non-invasive manner used for this study was developed in Russia. It has been tested for several years with teams at different athletic levels and sport types. The equipment and procedures have demonstrated high efficiency and reliability. The measuring process takes 1–2 minutes, and can be done practically anywhere. The instruments used may be run either from a power outlet or from a battery. The parameters explored for this study (SL, PET, and EP) are very important in understanding athletes’ levels of preparation for competitions. This paper is the first attempt to use these specific parameters for the assessment of athletic preparedness for the clinical sport medical community.
The level of EP of an athlete established in the training period directly influences the level of EP observed throughout training and competition. The SL of an athlete recorded in the training period significantly correlates with the athlete’s SL both before and at the time of competition. The higher the level of EP achieved by the athlete in the training period, the lower the SL in the competition time, which may contribute to competition efficiency. The higher the SL and PET in the training period, the lower the probability of high competition results.
Hand-held computer complexes Mirage and GDV Sport used in this study allow for the express-analysis of psycho-physiological conditions of athletes with high precision at all phases of competition. Calculated parameters help to carry out corrective actions directed to optimization of the athletes’ condition in the biofeedback regime.
While the ability to use GDV technology in this capacity provided a great benefit, both the technology and the current study design are not without their limitations. In medicine, GDV has been primarily used as an adjunct tool for evaluation that offers health care providers more insight into a patient’s condition. Despite the fact that there is a great deal of potential yet to be uncovered from this technology, its principal use has not been as a stand-alone diagnostic procedure. With regards to future studies, in order to get a more complete picture of an athlete’s psycho-physiological landscape, the use of GDV in conjunction with additional metrics may be of benefit. Another way in which further research may offer more understanding would be in varying the types of competitions in which athletes compete. Though there is nothing to suggest that biathlon and skiing are in any way poor arenas to test the desired outcome measures, including different types of high-level athletic competitions would provide a greater volume of information from which to draw conclusions.
As this was an observational pilot study, another point of concern was the sample size. While the authors feel confident about the reliability of the devices used and the reproducibility of the data collected, the small participant number makes it difficult to draw firm conclusions from this data. Future studies may offer additional insight by increasing the participant population to ensure proper powering, adding an experimental intervention, and including self-reported participant questionnaires as well as questionnaires for trainers and coaches on their perceptions of each athlete with regard to the selected outcome measures to compare against GDV/GSR results. Finally, further research may also focus on elucidating the mechanism for the setting of EP. As it is believed to be of significant importance, determining how it is established and thus how it may be increased is of great interest.
Disclosure
The authors have no conflict of interest to disclose.
References
- ThompsonWRThe Paralympic winter athleteClin J Sport Med20122211222240771
- BernardiMCarucciSFaiolaFPhysical fitness evaluation of paralympic winter sports sitting athletesClin J Sport Med2012221263022222593
- BhambhaniYForbesSForbesJCravenBMatsuuraCRodgersCPhysiologic responses of competitive Canadian cross-country skiers with disabilitiesClin J Sport Med2012221313822222595
- MartinJMental preparation for the 2014 Winter Paralympic GamesClin J Sport Med2012221707322222589
- ShelkovOMAbaljanAGSystem of complex control of paralympic athletes preparation levelAdaptive Phys Cult201144850 (Russian)
- GromovaIADrozdovskiAKKorotkovAKScientific support of the victories by Russian paralympic teamAdaptive Phys Cult2009434 (Russian)
- ShelkovOMDrozdovskiAKGromovaIAPsychological preparation of athletes for Vancouver OlympicsAdaptive Phys Cult201114143 (Russian)
- NagaiYGoldsteinLHFenwickPBTrimbleMRClinical efficacy of galvanic skin response biofeedback training in reducing seizures in adult epilepsy: a preliminary randomized controlled studyEpilepsy Behav20045221622315123023
- KorotkovKGHuman Energy Field: Study with GDV BioelectrographyFair LawnBackbone Publishing Co2002
- HossuMRupertRQuantum events of biophoton emission associated with complementary and alternative medicine therapies: a descriptive pilot studyJ Altern Complement Med200612211912416566670
- CohlyHKostyukNIsokpehiRBio-electrographic method for preventive health careProceedings of the 1st Annual ORNL Biomedical Science and Engineering ConferenceMarch 18–19, 2009Oakridge, TN. New York: IEEE200914
- KostyukNMeghanathanNIsokpehiRDBiometric evaluation of anxiety in learning english as a second languageInternational Journal of Computer Sciences and Network Security2010101220229
- KorotkovKGMatraversPOrlovDVWilliamsBOApplication of electrophoton capture (EPC) analysis based on gas discharge visualization (GDV) technique in medicine: a systematic reviewJ Altern Complement Med2010161132519954330
- KorotkovKShelkovOShevtsovAStress reduction with osteopathy assessed with GDV electrophotonic imaging: effects of osteopathy treatmentJ Altern Complement Med201218325125722420738
- RussoMChoudhriAFWhitworthGWeinbergADBickelWOzMCQuantitative analysis of reproducible changes in high-voltage electrophotographyJ Altern Complement Med200176617627 discussion 629–63111822610
- Measuring the Human Energy Field: State of the ScienceChezRANational Institute of Health, Samueli InstituteMaryland2002
- BundzenPVKorotkovKGKorotkovaAKMukhinVAPriyatkinNSPsychophysiological correlates of athletic success in athletes training for the Olympics. Human Physiology. 2005;31(3):316–323Translated from Fiziologiya Cheloveka20053138492
- SchulkinJAllostasis: The Emergence of a ConceptRethinking HomeostasisCambridgeMIT Press2003
- ArtioliGGBertuzziRCRoschelHMendesSHLachaAHJrFranchiniEDetermining the contribution of the energy systems during excierciseJ Vis Exp201261341322453254