Abstract
Background
Changes in single skinfold thickness and body fat have been investigated in ultraswimmers and ultracyclists, but not in ultrarunners. The present study investigated the changes in single skinfold thickness during a 100 km ultramarathon.
Methods
Firstly, we investigated associations between prerace preparation and prerace body composition and, secondly, changes in single skinfold thickness during a 100 km ultramarathon in 219 male ultramarathoners. Changes in fat mass and skeletal muscle were estimated using anthropometric methods.
Results
Kilometers run weekly prerace and running speed during training were negatively associated with all skinfold thicknesses (P < 0.05) except for the front thigh skinfold. During the race, skinfold thickness at the pectoral (−0.1%), suprailiac (−1.8%), and calf (−0.8%) sites decreased (P < 0.05). The subjects lost 1.9 ± 1.4 kg of body mass (P < 0.001), 0.7 ± 1.0 kg of estimated skeletal muscle mass (P < 0.001), and 0.2 ± 1.3 kg of estimated fat mass (P < 0.05). The decrease in body mass was positively related to the decrease in both estimated skeletal muscle mass (r = 0.21, P = 0.0017) and estimated fat mass (r = 0.41, P < 0.0001).
Conclusion
Firstly, prerace fat mass and prerace skinfold thickness were associated with both volume and speed in running training. Secondly, during the ultramarathon, skinfold thickness decreased at the pectoral, suprailiac, and calf sites, but not at the thigh site. Percent decreases in skinfold thickness for ultrarunners was lower than the percent decreases in skinfold thickness reported for ultraswimmers and ultracyclists.
Introduction
A decrease in body mass is a common finding in ultraendurance performance.Citation1,Citation2 Generally, the decrease in body mass during endurance performance is considered to be due to dehydration.Citation3–Citation5 However, the decrease in body mass in ultraendurance performance seems not to be due to dehydrationCitation2,Citation6,Citation7 but rather to a decrease in solid mass, ie, fat massCitation2,Citation8–Citation13 and skeletal muscle mass.Citation8,Citation14–Citation17 The type of exercise undertaken seems to affect whether skeletal muscle mass or fat mass would be reduced during endurance performance. Eccentric endurance exercise such as running seems to lead to a decrease in both muscle mass and fat mass,Citation8,Citation12,Citation13,Citation16,Citation17 whereas concentric endurance exercise such as cycling seems to reduce fat mass.Citation18,Citation19 Swimming as a non-weight-bearing exercise leads to no changes in body composition in 12-hour ultraswimmers.Citation20
During physical exercise, lipolysis of adipose subcutaneous tissue seems to vary between different sites in the exercising body.Citation21 In a laboratory trial, Boschmann et alCitation21 showed some differences in metabolism and blood flow in abdominal and femoral subcutaneous adipose tissue and skeletal muscle between women and men during standardized bicycle exercise. Lipolysis was greater in skeletal muscle tissue than in femoral subcutaneous adipose tissue, and greater in femoral subcutaneous adipose tissue than in abdominal subcutaneous adipose tissue. In skeletal muscle tissue, the increase in lipolysis was greater for women than for men. The authors concluded, firstly, that lipids stored in muscle tissue were used more than lipids stored in adipose tissue for fueling the energy metabolism of muscle during exercise and, secondly, that lipid mobilization during exercise was much greater in women than in men. However, the most important finding with practical application was that lipolysis of subcutaneous adipose tissue was greater in femoral than in abdominal adipose subcutaneous tissue. It seemed that the thickness of adipose subcutaneous tissue over the exercising muscle became reduced.
Changes in single skinfold thickness have been investigated in ultraendurance athletes, such as cyclistsCitation19 and swimmers,Citation22 but not in runners. In cyclists, skinfold thickness at the pectoral (−14.7%), abdominal (−14.9%), and thigh (−10.2%) sites showed the largest decrease.Citation19 The decrease in abdominal skinfolds was significantly and negatively related to cycling speed during the race.Citation19 In male swimmers, skinfold thickness at the abdominal (−8.4%) and suprailiac (−7.5%) sites decreased, whereas in female swimmers, skinfold thickness at the axillary site (−18.8%) was reduced.Citation22 Running training seemed also to be beneficial for reduction of subcutaneous adipose tissue. In elite runners, intense training resulted in significant increases in performance and significant decreases in the sum of six skinfolds, as well as single skinfolds at the abdominal, front thigh, and medial calf sites.Citation23
The aims of the present study were, firstly, to investigate, any potential change in skinfold thickness and body fat during an ultramarathon, and, secondly, to explore potential associations between prerace preparation and prerace body composition. Based upon reported findings in laboratory and field studies, we hypothesized, firstly, that skinfold thickness on the lower body (eg, thigh and calf sites) would decrease to a greater extent than skinfold thickness on the upper body (eg, abdominal and suprailiac sites). Secondly, we hypothesized that volume and speed in prerace training would be related to body fat and skinfold thickness in different ways.
Materials and methods
Subjects
In order to increase the sample size, data were collected from an annual 100 km ultramarathon, ie, the “100 km Lauf Biel” in Biel, Switzerland, over 5 consecutive years. Each year, approximately 1300 male ultrarunners finish this race.Citation24 The race director contacted all participants in the years 2007–2011 via a newsletter sent 3 months prerace, in which the participants were asked to participate in the study. A total of 239 recreational male ultrarunners volunteered to participate in our investigation. We focused on recreational athletes, defined as athletes pursuing a regular occupation, performing sport during leisure time, having no sponsors, and not earning their livelihood through sponsorship or prize money. The athletes were informed of the procedures and gave their informed written consent. No athlete competing several times in the race was included more than once in the study. The study was approved by the institutional review board for use of human subjects of St Gallen, Switzerland.
Race
The “100 km Lauf Biel” generally takes place during the night of the first weekend in June. The athletes start the 100 km run on Friday at 10 pm, and need to climb a total altitude of 645 meters. During the 100 km, the organizer provides a total of 17 aid stations, offering an abundant variety of food and beverages, including hypotonic sports drinks, tea, soup, caffeinated drinks, water, bananas, oranges, energy bars, cakes, and bread. The athletes are allowed to be supported by a cyclist in order to have additional food and clothing, if necessary. In all 5 years, the general weather conditions were comparable, with the temperature at the start being 15°C–18°C, with night lows of 8°C–10°C, and daily highs of 25°C–28°C the following day. There was no rain or wind from 2007 to 2010. In 2011, there were rain showers during the night and the temperature rose to 18°C on the second day.
Measurements and calculations
Upon recruitment into the investigation 3 months prerace, the participants were instructed to keep a comprehensive training diary until the start of the race. All running training units were recorded, showing distance in kilometers and duration. Within 6 hours of starting the race and immediately upon arrival at the finish line, anthropometric characteristics, including body mass, limb circumference, and thickness of skinfolds at eight sites (ie, pectoralis, mid axillary, triceps, subscapular, abdomen, suprailiac, front thigh, and medial calf) were measured. With these measurements, skeletal muscle mass and fat mass were estimated using anthropometric equations. During the race, the athletes recorded their fluid intake on a sheet of paper which they carried with them during the run. At each aid station, they marked the number of cups consumed. In addition, all supplemental fluid intake provided by the support crew was recorded. Fluid intake was estimated according to reports from the athletes.
Anthropometric measurements
Body mass was measured after voiding of the urinary bladder using a commercial scale (Beurer BF 15, Beurer GmbH, Ulm, Germany) and recorded to the nearest 0.1 kg. Body height was determined using a stadiometer (Tanita HR 001 portable height measure, Tanita Europe, Amsterdam, The Netherlands) and recorded to the nearest 0.01 m. The circumferences of the right upper arm, right thigh, and right calf were measured using a nonelastic tape measure (KaWe CE, Kirchner und Wilhelm, Asperg, Germany) and recorded to the nearest 0.01 cm. The right upper arm circumference was measured at the mid upper arm, the right thigh circumference at the mid thigh, and the right calf circumference at the mid calf. Skinfold data were obtained using a skin-fold caliper (GPM-Hautfaltenmessgerät, Siber and Hegner, Zurich, Switzerland) and recorded to the nearest 0.2 mm. The skinfold caliper measures with a pressure of 0.1 MPa ± 5% over the whole measuring range. One trained investigator took all the measurements. Skinfold thicknesses were determined on the right side of the body in all athletes, and were measured at the pectoral (anterior axillary line), mid axilla (vertical), triceps (in the middle of the upper arm), subscapular (at the inferior angle of the scapula), abdominal (vertical, right to the navel), suprailiac (at anterior axillary), front thigh (mid thigh) and medial calf (maximum girth) sites. The investigator identified the correct anatomical site using orientation with fingerbreadth and handbreadth from prominent anatomical sites, such as a prominent protuberance or insertion of a tendon. The procedure was performed three times and the mean of the three measures was used for the analyses. The skinfold measurements were standardized to ensure reliability, and readings were performed 4 seconds after applying the caliper, according to Becque et al.Citation25 An intratester reliability check was conducted on 27 male runners prior to testing.Citation26 Intraclass correlation (ICC) within the two raters was excellent for all anatomical measurement sites and for various summary measurements of skinfold thickness. Agreement tended to be higher within than between raters, but still had excellent reliability (ICC . 0.9) for the summary measurements of skinfold thickness. ICC for measurer 1 versus measurer 1 and for measurer 2 versus measurer 2 for the single skinfold thicknesses were between 0.98 and 0.99, respectively; for the sum of seven and eight skinfolds, respectively, ICC was 0.99. For the sum of eight skinfolds for measurer 1, bias (average difference between measure 1 and 2) was −0.51 mm, the standard deviation of the average difference was 1.49 mm, and 95% limits of agreement were between −3.44 mm and +2.41 mm. Skeletal muscle mass was estimated using the anthropometric equation devised by Lee et al, with skeletal muscle mass = Ht × (0.00744 × CAG2 + 0.00088 × CTG2 + 0.00441 × CCG2) + 2.4 × gender − 0.048 × age + race + 7.8, where Ht is height, CAG is skinfold-corrected upper arm girth, CTG is skinfold-corrected thigh girth, CCG is skinfold-corrected calf girth, gender = 1 for male, and race = 0 for white.Citation27 This anthropometric method was evaluated using 189 nonobese subjects and crossvalidated using magnetic resonance imaging (MRI). The equation was validated MRI to determine skeletal muscle mass. There was a high correlation between the predicted skeletal muscle mass and the MRI-measured skeletal muscle mass (r2 = 0.83, P < 0.0001, standard error of the estimate = 2.9 kg). The correlation between the measured and predicted skeletal muscle mass difference was highly significant (r2 = 0.90, P = 0.009). Fat mass was estimated using the anthropometric method of Stewart and Hannan, with fat mass (g) = 331.5 (abdominal) + 356.2 (thigh) + 111.9 m − 9108, where abdominal is the abdominal skinfold thickness in mm, thigh is the thigh skinfold thickness in mm, and m is body mass in kg.Citation28 The coefficient of determination was 0.96 and the standard error of the estimate was 1738 g (P < 0.001).
Laboratory measurements
Capillary blood and urine samples were collected at the same time as the anthropometric measurements. Capillary blood samples were taken from the fingertip, and both plasma sodium concentration ([Na+]) and hematocrit were analyzed using the i-STAT® 1 system (Abbott Laboratories, Abbott Park, IL). Standardization of posture prior to blood collection was adhered to because postural changes can influence blood volume, and therefore hemoglobin concentration and hematocrit. The percent change in plasma volume was calculated from prerace and post-race levels of hematocrit following the Beaumont equation.Citation29 Urine specific gravity was analyzed using a Clinitek Atlas® automated urine chemistry analyzer (Siemens Healthcare Diagnostics, Deerfield IL).
Statistical analysis
The data are presented as the mean ± standard deviation. Prerace and post-race results are compared using the paired t-test. Pearson’s correlation was used to investigate any potential association between anthropometric and training characteristics. In order to investigate whether changes in both skinfold thickness and limb circumference used to estimate changes in both skeletal muss and fat mass during the race would be influenced by running speed fluid intake, or changes in hydration status,Citation4,Citation5 we performed correlation analyses between changes in both skinfold thickness and limb circumference with markers of hydration status, including changes in body mass, changes in hematocrit, changes in plasma [Na+], changes in urine specific gravity, as well as running speed during the race and fluid intake. For the strength of correlation, r > 0.70 indicated a very strong, r = 0.40–0.69 a strong, r = 0.30–0.39 a moderate, r = 0.20–0.29 a weak, and r = 0.01–0.19 a negligible relationship, respectively. Pearson’s correlation was again applied to investigate for a potential association between anthropometric and training characteristics and race time. An alpha level of 0.05 was used to indicate significance for all statistical tests.
Results
Of the 239 subjects who started the race, 20 dropped out due to overuse injuries of the lower limbs. shows the age along with anthropometric and training characteristics for the 219 successful subjects. The subjects completed the 100 km ultramarathon within 713 ± 123 minutes, running at an average speed of 8.6 ± 1.4 km/hour.
Table 1 Age, anthropometric measurements, and training characteristics of the subjects (n = 219)
Changes in anthropometric characteristics during run
During the run, the subjects lost 1.9 ± 1.4 kg of body mass (P < 0.001), 0.7 ± 1.0 kg of estimated skeletal muscle mass (P < 0.001), and 0.2 ± 1.3 kg of estimated fat mass (P < 0.05, ). Expressed as a percentage, the subjects lost 2.5% ± 1.8% in body mass, 1.8% ± 2.5% in estimated skeletal muscle mass, and 1.4% ± 8.1% in estimated fat mass. The loss of 0.7 ± 1.0 kg of estimated skeletal muscle mass was significantly higher compared with the loss of 0.2 ± 1.3 kg of estimated fat mass (P < 0.0001). The change in body mass was weakly positively related to the change in estimated skeletal muscle mass () and strongly positively related to the change in estimated fat mass (). Additionally, the change in body mass was negligibly related to running speed during the race (). However, neither the change in estimated fat mass nor the change in estimated skeletal muscle mass correlated with running speed (P > 0.05). Skinfold thickness at the pectoral, suprailiac, and calf sites decreased significantly (). All limb circumferences also decreased significantly. The decrease in upper arm and thigh circumference was not related to running speed during the race (P > 0.05). However, the decrease in calf circumference was negligibly negatively associated with running speed ().
Figure 1 Change in body mass was significantly and positively related to change in skeletal muscle mass (n = 219, r = 0.21, P = 0.0017).
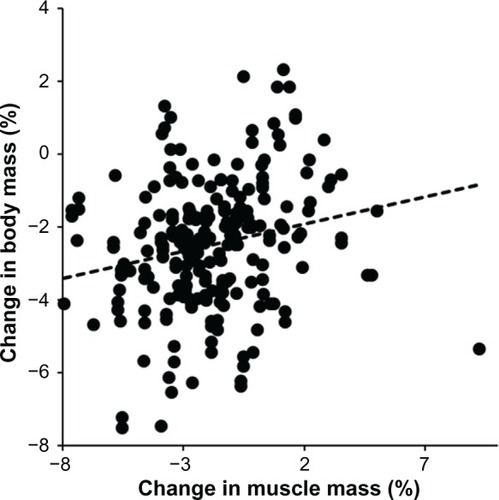
Figure 2 Change in body mass was significantly and positively related to change in fat mass (n = 219, r = 0.41, P < 0.0001).
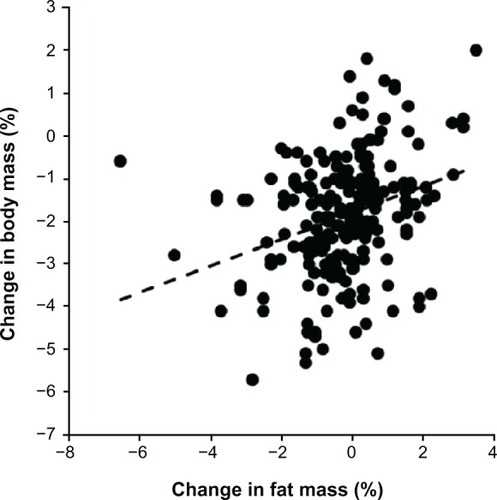
Figure 3 Change in body mass related to running speed (n = 219, r = −0.16, P < 0.05).
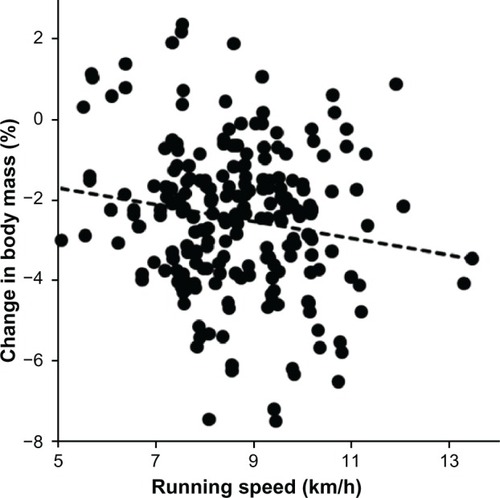
Figure 4 Change in calf circumference is significantly and negatively associated with running speed during the race (n = 219, r = −0.13, P = 0.0479).
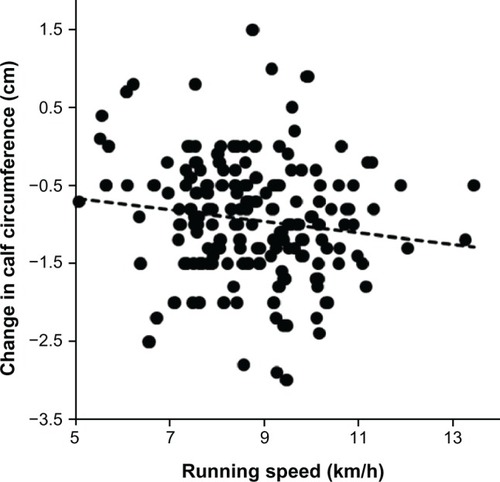
Table 2 Changes in anthropometric characteristics (n = 219)
Changes in laboratory results during run
summarizes the laboratory results. Urine specific gravity increased (P < 0.0001), and was not related to the change in body mass or running speed. Hematocrit decreased (P < 0.0001), plasma volume increased by 7.0% ± 15.6% (P < 0.05), and plasma [Na+] increased (P < 0.0001). The increase in plasma volume was negligibly associated with the change in calf skinfold thickness (r = 0.16, P = 0.0189), but not with the change in thigh skinfold thickness (r = 0.06, P > 0.05).
Table 3 Changes in laboratory results (n = 219)
Fluid intake and changes in anthropometry and laboratory results
While running, the athletes consumed 7.6 ± 2.6 L of fluids, equivalent to 0.65 ± 0.27 L/hour. Fluid intake was moderately negatively related to running speed (r = −0.39, P < 0.0001). Fluid intake was weakly positively associated with the change in body mass (r = 0.22, P = 0.0012), but not to post-race plasma [Na+] nor to change in plasma [Na+] (P > 0.05). The change in body mass was moderately negatively related to the change in plasma [Na+] (r = −0.38, P < 0.0001). Fluid intake was negligibly associated with change in thigh skinfold thickness (r = 0.14, P = 0.0332) but not with change in calf skinfold thickness (r = 0.06, P > 0.05). The change in calf circumference was negligibly related to fluid intake (r = 0.17, P = 0.0113), but not to change in thigh circumference (r = 0.05, P > 0.05).
Prerace training and prerace anthropometry
Skinfold thickness, estimated fat mass, and estimated skeletal muscle mass were not related to hours run per week (). Number of kilometers run per week was negligibly to weakly related to all skinfold thicknesses. Running speed during training was negligibly to weakly associated with all skinfold thicknesses except for the front thigh skinfold. All skinfold thicknesses (weakly to strongly), upper arm and thigh circumferences (negligibly to weakly), and body mass (moderately) were related to race time (). Upper arm (r = 0.24, P = 0.0004) and thigh (r = 0.16, P = 0.021) circumferences were negligibly to weakly related to race time. The upper arm circumference was weakly negatively associated with kilometers run per week (r = −0.20, P = 0.0026) and negligibly negatively associated with running speed during training sessions (r = −0.17, P = 0.011).
Table 4 Association of training variables with prerace skinfold thickness and body fat (n = 219)
Table 5 Association of skinfold thickness, body fat, and muscle mass with race time (n = 219)
Changes in anthropometry and markers of hydration status
The decrease in calf circumference was negligibly related to both running speed and fluid intake (), weakly related to change in hematocrit, moderately to change in body mass, and moderately to change in plasma [Na+]. The decrease in upper arm circumference was negligibly related to change in body mass, and the decrease in thigh circumference was weakly related to change in body mass. The decrease in medial calf skinfold thickness was negligibly related to fluid intake. The nonsignificant change in front thigh skinfold thickness was negligibly related to change in body mass. The nonsignificant change in axillary skinfold thickness was weakly related to change in body mass, and negligibly to change in plasma [Na+] and change in urine specific gravity. The decrease in pectoral skinfold thickness was negligibly related to change in body mass. The change in calf circumference explained 32% of the variance in change in skeletal muscle mass, 12% of change in thigh circumference, and 42% of change in upper arm circumference.
Table 6 Correlation of changes (Δ) in skinfold thickness and limb circumference with running speed, fluid intake, and parameters of hydration status
Discussion
We intended to investigate, firstly, potential associations between prerace preparation and prerace body composition and, secondly, any potential change in skinfold thickness during a 100 km ultramarathon. The changes in skinfold thickness and limb circumference may be indicative of changes in fat mass and skeletal muscle mass. The main findings were that, firstly, both weekly running hours and running speed during training sessions were negligibly to weakly related to prerace skinfold thickness and estimated prerace fat mass and, secondly, during the ultramarathon, skinfold thicknesses decreased at the pectoral, suprailiac, and calf sites, but not at the thigh site. The percent decreases in skinfold thickness in these ultrarunners were lower compared with the percent decreases in skinfolds reported for ultraswimmers and ultracyclists.
Change in anthropometric characteristics during the race
In these ultramarathoners, skinfold thickness decreased at the pectoral (−0.1%), suprailiac (−1.8%), and calf sites (−0.8%). The percent decreases were considerably lower compared with the decreases reported for ultracyclistsCitation19 and ultraswimmers.Citation22 In ultracyclists, skinfold thickness at the pectoral (−14.7%), abdominal (−14.9%), and thigh (−10.2%) sites showed the largest percent decrease.Citation19 In male ultraswimmers, the skinfold thickness at the abdominal (−8.4%) and suprailiac (−7.5%) sites decreased, whereas in female swimmers, skinfold thickness decreased at the axillary site (−18.8%).Citation22 Duration of performance might not explain these differences. While the present runners competed for 713 ± 123 minutes, the cyclists competed for 1580 ± 296 minutesCitation19 the male swimmers competed for 538 ± 100 minutes, and female swimmers competed for 603 ± 141 minutes.Citation22 The eccentric component in runningCitation33 likely led to a decrease in skeletal muscle mass rather than to a decrease in fat mass.
The runners lost 1.9 kg of body mass, with approximately 37% of the loss being due to loss of skeletal muscle mass and about 11% due to loss in fat mass. Skeletal muscle mass and fat mass were estimated using anthropometric equations for skinfold thickness and limb circumference. Because all the limb circumferences decreased, but skinfold thickness decreased at only three of eight sites, anthropometric changes may explain the higher decrease in estimated skeletal muscle mass (−0.7 kg) compared with estimated fat mass (−0.2 kg). Fat mass was estimated using the anthropometric method of Stewart and HannanCitation28 which includes skinfold thickness at the abdominal and thigh sites and body mass. Because skinfold thickness decreased only at the pectoral, suprailiac, and medial calf sites and not at the abdominal or thigh sites, these minor changes in skinfold thickness might explain the small decrease in estimated fat mass. The eccentric component of running might lead to skeletal muscle damage,Citation33 which might impair fat oxidation, thus leading to a smaller decrease in skinfold thickness compared with that induced by more concentric exercise, such as swimming and cycling.Citation19,Citation22
Adipose subcutaneous tissue is stored energy, and one might hypothesize that the thickest skinfolds might show the largest decrease during prolonged endurance exercise, as has been shown for ultracyclists.Citation19 We found the largest absolute decrease (−0.6 mm) at the suprailiac skin-fold, which was also the thickest skinfold, with 16.5 mm (). Boschmann et al investigated the metabolic response to exercise in subcutaneous adipose tissue.Citation21 When their subjects cycled under laboratory conditions, lipolysis was higher in femoral subcutaneous adipose tissue than in abdominal adipose subcutaneous tissue. In contrast with that laboratory study, our ultramarathoners showed no decrease in front thigh skinfold thickness, but did show a decrease in medial calf skinfold thickness. This difference might be explained by the different kind of exercise performed. In running, the strain on the calf might be greater than that on the thigh. Also, prerace kilometers run per week and running speed during training were negatively associated with all skinfold thicknesses, except for that at the front thigh site.
The loss in skeletal muscle mass was approximately 0.5 kg higher than the loss in fat mass. Because the anthropometric equation for estimation of skeletal muscle mass uses limb circumference, the decrease in limb circumference would explain the decrease in estimated skeletal muscle mass. However, using this method, we are not able to differentiate between a decrease in contractile fibers or a depletion of energy stored within the muscle fibers such as glycogen and intracellular fat.30 In addition, this method is not able to determine whether the decrease is due to a loss of water. Boschmann et al reported that lipids stored in muscle are used rather than lipids stored in adipose tissue for fueling the energy metabolism of muscle during exercise.21 They showed that the increase in lipolysis was greater in muscle than in femoral subcutaneous adipose tissue. Intracellular triglyceride stores in muscle form an important substrate source of fuel during moderate intensity exercise in endurance-trained male athletes.Citation31
Differences between thigh and calf circumference
The decrease in calf circumference was significantly (P < 0.0001) higher (−2.4% ± 2.0%) than the decrease in thigh circumference (−0.9% ± 2.5%). Further, the decrease in calf circumference was associated with running speed, but the decrease in thigh circumference was not. The strain of running might be higher at the calf than at the thigh. We assume that these athletes primarily used their calf muscles as energy stores. Krssak et al showed that glycogen depletion was two-fold greater at the calf than at the thigh when subjects ran on a treadmill at submaximal intensity to exhaustion.Citation32 In addition, intracellular lipids were significantly reduced in the soleus muscle. An alternative explanation might be that while running the activation of the muscle pump pressed fluid out of muscle, interstitium and dermis. However, the eccentric component of running may also lead to skeletal muscle damage,Citation33,Citation34 leading to a decrease in skeletal muscle mass.Citation8,Citation12,Citation13,Citation16,Citation17 This assumption is supported by the greater decrease in calf circumference compared with the decrease in thigh circumference. In addition, the decrease in calf circumference was related to running speed but not to thigh circumference. We need also to consider that circulation during exercise might have an effect on limb volume. Stick et al showed that calf volume decreased during cycling, while thigh volume remained unchanged.Citation35 These authors concluded that lowered venous pressure, increased lymphatic flow, and increased tissue pressure in the contracting muscle may lead to reduction in calf volume during exercise. Thermal stress might also have an effect on calf volume. Yamazaki et al demonstrated that the changes in calf volume during orthostatic stress were modulated according to changes in venous distensibility and blood flow to the skin during thermal loading.Citation36
Changes in anthropometry and markers of hydration status
Skinfold thickness on the legs might be influenced by the type of exercise such as running, changes in plasma volume, changes in hydration status, compression of the tissue, limb swelling, and fluid intake. Milledge et al assumed that fluid accumulation during prolonged walking was associated with an increase in leg volume.Citation37 Bracher et al showed that fluid intake was related to changes in leg volume in 100 km ultramarathoners.Citation38 Cejka et al demonstrated an association between fluid intake and foot volume in 100 km ultramarathoners.Citation39 Slight changes in water distribution of the body also influence thickness of the dermis, changes in which are pronounced in the lower leg.Citation40 Additionally, changes in plasma volume lead to changes in tissue thickness.Citation41 For both thigh and calf skinfolds, we found a negligible association between fluid intake and change in body mass. Fluid intake was negligibly associated with change in skinfold thickness at the calf but not at the thigh. The increase in plasma volume was negligibly associated with change in skinfold thickness at the calf, but not with change in skinfold thickness at the thigh. For calf circumference, we found a negligible association with running speed and fluid intake, a weak association with change in hematocrit, and a moderate association with change in both body mass and plasma sodium. Changes in skinfold thickness in the lower limbs do not affect the Stewart and Hannan equation used to estimate fat mass.Citation28 However, the change in calf circumference affects the estimation of skeletal muscle mass, given that the equation of Lee et al uses the skinfold-corrected circumferences of the upper arm, thigh, and calf to estimate skeletal muscle mass.Citation27 The decrease in calf circumference explained 32% of the decrease in skeletal muscle mass, which is considerably more than the decrease in thigh circumference (12%) but less than the decrease in upper arm circumference (42%).
Prerace training and prerace anthropometry
We were also interested to find associations between training variables and skinfold thickness, because Legaz and Eston have shown that running training results in a significant increase in performance and a decrease in the sum of six skinfolds, as well as the single skinfold thickness at the abdominal, front thigh, and medial calf sites.Citation23 Legaz Arrese et al reported that body fat was only associated with marathoners, probably due to the fact that these runners are engaged in higher training volumes and that fat metabolism prevails in both training and competition only in marathon running.Citation42 Legaz and Eston determined differences in skinfold thickness after the training period whereas we, in contrast, performed correlation analyses with cross-sectional data.Citation23 Although we found negligible to weak correlations between kilometers run weekly, running speed during training, and skinfold thickness, correlation analyses do not demonstrate a cause and effect relationship. Intense running may lead to lower body fat. However, dieting may also lead to lower body fat. Furthermore, a decrease in body fat may lead to a decrease in body mass, thus increasing running speeds.
Limitations and implications for future research
We must acknowledge that the present study has limitations relating to the methods used to estimate skeletal muscle mass and fat mass. For instance, changes in muscle circumference during prolonged exercise may have be affected by other mechanisms, such as dehydration and overhydration, which are different from energy depletion. For this reason, we performed additional analyses in order to estimate the reliability of the equation of Lee et al for prerace and post-race measures.Citation27 More specifically, we analyzed how a change of 0.5 cm in limb circumference – which is a great change related with other factors different than loss of muscle mass – affected our results for skeletal muscle mass. We found that such a reduction in limb circumference corresponded to a decrease of 0.4 ± 0.2 kg in skeletal muscle mass. In addition, a 0.5 cm reduction in thigh and arm circumference corresponded to a decrease of 0.1 ± 0.1 kg and 0.2 ± 0.2 kg in skeletal muscle mass, respectively. Considering these differences, we found that the change in skeletal muscle mass remained statistically significant between prerace and postrace measurements (P < 0.05). In addition, another measure which can alter the anthropometric equation established by Lee et al is body height.Citation27 From this viewpoint, it is known that running induces an acute increase in load on the spine and may reduce overall body height by 0.4–0.8 cm in subjects after exercise.Citation43,Citation44 We also analyzed how this change in body height could modify the results obtained using the equation of Lee et al.Citation27 We found that a height reduction of 1 cm overestimated skeletal muscle mass by 0.2 ± 0.1 kg. However, differences between prerace and post-race measurements of skeletal muscle mass were still statistically significant (P < 0.05). In addition, we also analyzed the reliability of the equation of Stewart and Hannan when used to estimate fat mass.Citation28 We hypothesized that a 50% change in our results could be due to reasons other than loss of fat mass. It was estimated that 0.1 ± 0.1 kg could be related with this fact. However, as shown in , skinfold thickness at the abdominal and thigh sites did not change significantly during the race. Thus, almost all body fat reduction estimated by the equation used in this study could be explained by a loss of body weight. In relationship with this point, the average results for urine specific gravity were below 1.030 g/mL, indicating adequate physiological hydration status. Anthropometric methods have been shown to be a reliable method of demonstrating changes in fat mass. Cisar et al investigated the validity of anthropometric equations in determining changes of body composition in adult males during training, and reported that anthropometric measures, including skinfolds, were a stable predictor of body density during training.Citation45 Application of anthropometric methods may depend upon the sporting discipline involved. For elite male judo athletes before a competition, anthropometric models using seven or three skinfolds were not valid when relative fat mass, absolute fat mass, and fat-free mass were evaluated at baseline and before a competition.Citation46 However, for body builders, comparison of underwater weighing, deuterium dilution, a three-compartment model incorporating total body water, a three-compartment model incorporating bone mineral content, and descriptive methods, namely dual-energy x-ray absorptiometry, predictive equations based on body mass index, skinfold measurement, and bioimpedance analyses during strength training, gave acceptable group mean values.Citation47 Anthropometric methods also seem to be reliable when used to measure changes in lean mass. Slater et al showed that, for elite rugby players, determination of lean mass index using a skinfold-based index for tracking proportional changes was a reliable method when compared with hydrodensitometry, deuterium dilution, and dual-energy v-ray absorptiometry.Citation48 Therefore, overall, despite the fact that the anthropometric methods used in this study had limitations in the estimation of both skeletal muscle mass and fat mass, we believe that anthropometric methods are reliable for analyzing changes in large samples of subjects.
This study is also limited by the lack of consideration of food intake during the race. Energy intake during the run might have influenced both performance and changes in body mass. Body mass changes result from substrate use (with water production), water loss (urine, sweat, and breath), water intake, and energy intake. Furthermore, prerace diet was not considered. Some athletes may have followed a diet either to increase body mass or to decrease body mass, depending on their specific aim for the race. In some subjects, both skeletal muscle mass and fat mass increased. Estimation of skeletal muscle mass using an anthropometric method with limb circumference and skinfold thickness may be limited because peripheral edema can occur in ultramarathoners, which might affect anthropometric measurements.Citation38 Intensity during both training and the race was not estimated. Therefore, comparisons using laboratory derived intensities expressed in %VO2max are difficult. The decrease in both skeletal muscle mass and fat mass requires future confirmation using dual-emission x-ray absorptiometry. Changes in extracellular and intracellular volumes due to running might be detected using segmental and wrist-ankle bioimpedance spectroscopy.Citation49
Conclusion
To summarize, prerace fat mass and prerace skinfold thickness were negligibly to weakly associated with both volume and speed in running training. Further, during the ultramarathon, skinfold thickness at the pectoral, suprailiac, and calf sites decreased, but not at the thigh site. The percent decreases in skinfold thickness for ultrarunners are lower than the decreases in skinfold thickness reported for ultraswimmers and ultracyclists. To verify the observed changes in both estimated skeletal muscle mass and estimated fat mass, changes in body composition should be investigated using dual-emission X-ray absorptiometry or MRI (magnetic resonance imaging). Changes in extracellular and intracellular volume variations due to running might be detected using segmental and wrist-ankle bioimpedance spectroscopy.
Disclosure
The authors report no conflicts of interest in this work.
References
- EnqvistJKMattssonCMJohanssonPHBrink-ElfegounTBakkmanLEkblomBTEnergy turnover during 24 hours and 6 days of adventure racingJ Sports Sci20102894795520544486
- KnechtleBWirthAKnechtlePRosemannTSennODo ultra-runners in a 24-h run really dehydrate?Ir J Med Sci201118012913420512663
- LopezRMCasaDJJensenKAExamining the influence of hydration status on physiological responses and running speed during trail running in the heat with controlled exercise intensityJ Strength Cond Res2011252944295422024610
- ShirreffsSMMarkers of hydration statusEur J Clin Nutr200357S6S914681707
- KavourasSAAssessing hydration statusCurr Opin Clin Nutr Metab Care2002551952412172475
- KnechtleBKnechtlePRosemannTOliverSA Triple Iron triathlon leads to a decrease in total body mass but not to dehydrationRes Q Exerc Sport20108131932720949852
- KnechtleBKnechtlePRosemannTSennONo dehydration in mountain bike ultra-marathonersClin J Sport Med20091941542019741316
- KnechtleBWirthAKnechtlePRosemannTIncrease of total body water with decrease of body mass while running 100 km nonstop – formation of edema?Res Q Exerc Sport20098059360319791646
- KnechtleBKnechtlePKohlerGThe effect of 1,000 km nonstop cycling on fat mass and skeletal muscle massRes Sports Med20111917018521722005
- KnechtleBSchwankeMKnechtlePKohlerGDecrease in body fat during an ultra-endurance triathlon is associated with race intensityBr J Sports Med20084260961318048432
- HerbstLKnechtleBLopezCLPacing strategy and change in body composition during a Deca Iron triathlonChin J Physiol20115425526322129824
- KnechtleBDuffBAmtmannGKohlerGAn ultratriathlon leads to a decrease of body fat and skeletal muscle mass – the Triple Iron Triathlon Austria 2006Res Sports Med2008169711018569944
- KnechtleBSalas FraireOAndonieJLKohlerGEffect of a multistage ultra-endurance triathlon on body composition: World Challenge Deca Iron Triathlon 2006Br J Sports Med20084212112517601765
- KnechtleBBaumannBWirthAKnechtlePRosemannTMale ironman triathletes lose skeletal muscle massAsia Pac J Clin Nutr201019919720199992
- KnechtleBKnechtlePWirthAAlexander RüstCRosemannTA faster running speed is associated with a greater body weight loss in 100-km ultra-marathonersJ Sports Sci2012301131114022668199
- KnechtleBKohlerGRunning 338 kilometers within five days has no effect on body mass and body fat but reduces skeletal muscle mass – the Isarrun 2006J Sports Sci Med20076401407http://www.jssm.org/vol6/n4/3/v6n4-3pdf.pdf
- KnechtleBDuffBSchulzeIKohlerGA multi-stage ultra-endurance run over 1,200 km leads to a continuous accumulation of total body waterJ Sports Sci Med20087357364
- KnechtleBWirthAKnechtlePRosemannTAn ultra-cycling race leads to no decrease in skeletal muscle massInt J Sports Med20093016316719199212
- BischofMKnechtleBRüstCAKnechtlePRosemannTChanges in skinfold thicknesses and body fat in ultra-endurance cyclistsAsian J Sports Medhttp://asjsm.tums.ac.ir/index.php/asjsm/article/view/217
- KnechtleBKnechtlePKaulRKohlerGNo change of body mass, fat mass, and skeletal muscle mass in ultraendurance swimmers after 12 hours of swimmingRes Q Exerc Sport200980627019408468
- BoschmannMRosenbaumMLeibelRLSegalKRMetabolic and hemodynamic responses to exercise in subcutaneous adipose tissue and skeletal muscleInt J Sports Med20022353754312439767
- WeitkunatTKnechtleBKnechtlePRüstCARosemannTBody composition and hydration status changes in male and female open-water swimmers during an ultra-endurance eventJ Sports Sci2012301003101322554315
- LegazAEstonRChanges in performance, skinfold thicknesses, and fat patterning after three years of intense athletic conditioning in high level runnersBr J Sports Med20053985185616244197
- KnechtleBRüstCARosemannTLepersRAge-related changes in 100-km ultra-marathon running performanceAge (Dordr)2012341033104521796378
- BecqueMDKatchVLMoffattRJTime course of skin-plus-fat compression in males and femalesHum Biol19865833423957328
- KnechtleBJoleskaIWirthAKnechtlePRosemannTSennOIntra- and inter-judge reliabilities in measuring the skin-fold thicknesses of ultra runners under field conditionsPercept Mot Skills201011110510621058591
- LeeRCWangZHeoMRossRJanssenIHeymsfieldSBTotal-body skeletal muscle mass: development and cross-validation of anthropometric prediction modelsAm J Clin Nutr20007279680310966902
- StewartADHannanWJPrediction of fat and fat-free mass in male athletes using dual x-ray absorptiometry as the reference methodJ Sports Sci20001826327410824643
- Beaumont vanWEvaluation of hemoconcentration from hematocrit measurementsJ Appl Physiol197231712713
- ZehnderMIthMKreisRSarisWBoutellierUBoeschCGender-specific usage of intramyocellular lipids and glycogen during exerciseMed Sci Sports Exerc2005371517152416177603
- Van LoonLJKoopmanRStegenJHWagenmakersAJKeizerHASarisWHIntramyocellular lipids form an important substrate source during moderate intensity exercise in endurance-trained males in a fasted stateJ Physiol200355361162514514877
- KrssakMPetersenKFBergeronRIntramuscular glycogen and intramyocellular lipid utilization during prolonged exercise and recovery in man: a 13C and 1H nuclear magnetic resonance spectroscopy studyJ Clin Endocrinol Metab20008574875410690886
- KimHJLeeYHKimCKBiomarkers of muscle and cartilage damage and inflammation during a 200 km runEur J Appl Physiol20079944344717206443
- SkenderiKPKavourasSAAnastasiouCAYiannakourisNMatalasALExertional rhabdomyolysis during a 246-km continuous running raceMed Sci Sports Exerc2006381054105716775544
- StickCHeinemannWWitzlebESlow volume changes in calf and thigh during cycle ergometer exerciseEur J Appl Physiol Occup Physiol1990614284322079062
- YamazakiFOkunoCNagamatsuSSoneREffects of whole-body and local thermal stress on hydrostatic volume changes in the human calfEur J Appl Physiol200288616612436271
- MilledgeJSBrysonEICatleyDMSodium balance, fluid homeostasis and the renin-aldosterone system during the prolonged exercise of hill walkingClin Sci (Lond)1982625956047083752
- BracherAKnechtleBGnädingerMFluid intake and changes in limb volumes in male ultra-marathoners: does fluid overload lead to peripheral oedema?Eur J Appl Physiol2102112991100321720884
- CejkaCKnechtleBKnechtlePRüstCARosemannTAn increased fluid intake leads to feet swelling in 100-km ultra-marathoners – an observational field studyJ Int Soc Sports Nutr201291122472466
- EisenbeissCWelzelJEichlerWKlotzKInfluence of body water distribution on skin thickness: measurements using high-frequency ultrasoundBr J Dermatol201114494795111359379
- EichlerWEisenbeissCSchumacherJKlausSVogelRKlotzKFChanges of interstitial fluid volume in superficial tissues detected by a miniature ultrasound deviceJ Appl Physiol20008935936310904072
- Legaz ArreseAGonzález BadilloJJSerrano OstárizEDifferences in skinfold thicknesses and fat distribution among top-class runnersJ Sports Med Phys Fitness20054551251716446683
- GarbuttGBoocockMGReillyTTroupJDRunning speed and spinal shrinkage in runners with and without low back painMed Sci Sports Exerc1990227697722149581
- LeattPReillyTTroupJDSpinal loading during circuit weight-training and runningBr J Sports Med1986201191243779339
- CisarCJHoushTJJohnsonGOThorlandWGHughesRAValidity of anthropometric equations for determination of changes in body composition in adult males during trainingJ Sports Med Phys Fitness1989291411482593652
- SilvaAMFieldsDAQuitérioALSardinhaLBAre skinfold-based models accurate and suitable for assessing changes in body composition in highly trained athletes?J Strength Cond Res2009231688169619675495
- Van Marken LichtenbeltWDHartgensFVollaardNBEbbingSKuipersHBody composition changes in bodybuilders: a method comparisonMed Sci Sports Exerc20043649049715076792
- SlaterGJDuthieGMPyneDBHopkinsWGValidation of a skinfold based index for tracking proportional changes in lean massBr J Sports Med20064020821316505075
- FenechMJaffrinMYExtracellular and intracellular volume variations during postural change measured by segmental and wrist-ankle bioimpendance spectroscopyIEEE Trans Biomed Eng20045116617514723506