Abstract
Purpose
Numerous studies have measured changes in fasting blood glucose (FBG) levels in response to physical activity (PA) interventions. While studies involving clinical populations such as type 2 diabetics typically report significant reductions, most others report no change in FBG. This study investigated changes in FBG in apparently healthy adults following a PA intervention.
Methods
We measured fingertip samples for FBG pre and post a 40-day PA program in 575 insufficiently active adults. The PA goal was at least 30 minutes of moderate exercise daily, and there was 73% compliance.
Results
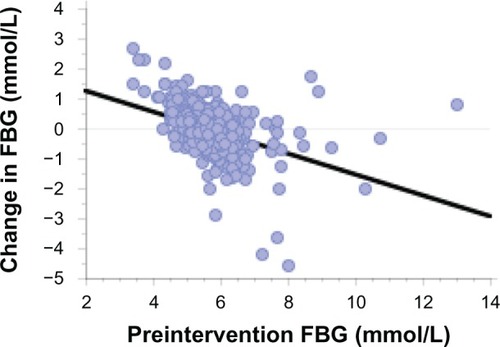
A PA questionnaire showed the average level of activity was 69 ± 46 min/wk preintervention, and this increased to 635 ± 458 min/wk postintervention. When the change in FBG was regressed against baseline FBG levels, there was a significant negative relationship (y = 2.623 − 0.471 × x; r = 0.472; P < 0.0001). The regression line showed, on average, subjects with low pre-study glucose levels had increased FBG while those with high levels had reductions in FBG.
Conclusion
It appears that the body’s response to PA training is to upregulate glucose control, which is reflected in tighter FBG levels around a physiological set point (5.6 mmol/L, in the present study). Regulation of blood glucose is a complex neuroendocrine process with numerous organs involved, but it was not possible in the present study to determine which of these regulatory steps are involved in exercise-induced changes of FBG.
Introduction
Blood glucose (BG) is critical for metabolic health and survival. The concentration within the circulatory system is regulated within a narrow range in the healthy population, because there are acute life-threatening implications if BG concentrations become too low or high.Citation1,Citation2 Even relatively small chronic increases in BG are associated with serious health conditions, such as obesity and type 2 diabetes. These lifestyle diseases have been rising in many countries around the world and it is estimated that about 1.4 billion people are overweight or obeseCitation3 and about 346 million people have diabetes.Citation4 These problems have led to increasing efforts to find the most efficacious preventative and therapeutic interventions for metabolic-related chronic illnesses. Both clinical and prospective studies have reinforced the importance of physical activity as a key strategy to assist in the prevention and treatment of type 2 diabetesCitation5 and for weight management.Citation6
The use of BG measures as an indicator of metabolic health is common because they are relatively inexpensive, rapid and require only a small capillary sample.Citation27 BG is also routinely measured for those who have been diagnosed with metabolic-related disorders. However, it is well established that BG levels are influenced by the time from and composition of the last meal,Citation8 gastric emptying rates,Citation9 physical activity (PA),Citation10 level of obesity,Citation11,Citation12 age,Citation11,Citation13 and a range of other neuroendocrine influences.Citation14 Due to these confounders, it is recommended that routine assessments of BG, as a risk factor or as part of a diagnostic procedure, are standardized to fasting and resting states.Citation5,Citation7
Elevated fasting blood glucose (FBG) levels have been shown to be predictive for a range of diseases, including cardiovascular-related death, in prospective epidemiological studies of nondiabetic menCitation15 and mixed cohorts.Citation16 A meta-analysis by the Emerging Risk Factors CollaborationCitation11 showed that FBG in people without diabetes was related to risk of coronary heart disease in a nonlinear, J-shaped fashion, where there was increased risk at both ends of the FBG spectrum.
Numerous studies have measured FBG to assess the impact of various interventions on glucose control,Citation17–Citation19 particularly those involving increasing levels of physical activity.Citation20,Citation21 While studies using clinical populations such as type 2 diabetics or those with impaired glucose tolerance have reported significant reductions in average FBG,Citation18,Citation22,Citation23 others using a cross section of sedentary adults have reported no consistent change in FBGCitation24,Citation25 or even an increase,Citation20,Citation23 despite increases in insulin sensitivity in all groups. These results suggest considerable variability in terms of homeostatic control of BG and that training-induced adaptations may operate differently among individuals, depending on the preintervention FBG level.
This study investigated changes in FBG in apparently healthy but insufficiently active Australian adults, relative to baseline FBG levels, following 40 days of daily PA.
Methods
The participants in this study were part of a larger PA intervention study for people with low levels of habitual activity. The University of South Australia ethics committee approved this study and all subjects gave informed written consent. The methods and design of the study have been described in detail previously.Citation26 Participants reported here were recruited from a university, tertiary hospital, and several government departments. A total of 736 subjects aged 18–60 years were randomly allocated to one of two 40-day programs involving daily activity targets. Selection criteria required the subjects to:
be insufficiently active (<150 minutes of weighted PA per week) when assessed, using the Active Australia Survey;Citation27
satisfy the pre-exercise screening guidelines, using the Sports Medicine Australia screening system;Citation28 and
be willing to either (a) wear a pedometer daily for the duration of the 40-day intervention or (b) participate in the 40-day group PA program.
Outcome measures were obtained from all participants at baseline and immediately following the 40-day interventions. These included the level of PA undertaken pre- and postintervention, using the Active Australia Survey. Other measures included: anthropometric variables – height, weight, waist and hip girths, triceps, biceps, and subscapular skinfold thicknesses – using methods described by Norton and Olds;Citation29 resting blood pressure (BP), according to the technique recommended by the American Heart Association;Citation30 and FBG and total cholesterol levels. Additionally, a submaximal cycle ergometer test was conducted to estimate maximal oxygen consumption.Citation31 The results of the glucose measures are presented in this paper, and the intervention-related changes for all other variables will be reported in a separate paper.
Total cholesterol and FBG were measured using finger-tip blood samples. Subjects were required to fast for eight hours prior to the blood tests. Standard infection control procedures were used, and blood samples were processed using a Reflotron® Plus analyzer (Hoffman La Roche Ltd, Basel, Switzerland). Prior to the study, repeated measures of total cholesterol and FBG on ten consecutive days showed coefficients of variation (CV) of 7.9% and 10.2%, respectively. The Reflotron has also been shown to have less than 1% error on duplicate samples.Citation32
PA interventions
The two types of intervention were: (1) a pedometer-based strategy, wherein participants were instructed to achieve at least 5000 steps/day in week 1 and increase this by 1000 steps/wk to 10,000 steps/day by week 6; and (2) a group-based strategy that required participants to attend instructorled activities three times/week (Monday, Wednesday, Friday) and undertake individual activities for at least 30 minutes on alternate days (more detail is provided in Norton et alCitation26).
Statistical methods
Postintervention changes were assessed used paired t-tests. Regression analysis was also used to determine the association between preintervention measurements and postintervention changes. Significance was set at P < 0.05.
Results
The results for the participants who completed both the intervention phase and postintervention testing are presented in . The table shows the data for each intervention arm separately.
Table 1 Participant descriptive statistics pre- and postintervention
There were significant increases in the PA patterns of the participants over the 40-day interventions. As expected given the large increases in PA, there were significant improvements for BMI and aerobic fitness, confirming participant compliance with the programs. There was no change in mean FBG following the interventions. Furthermore, there were no differences in the FBG changes between the two intervention cohorts (pedometer versus group). Therefore, all participants who completed the study (n = 583; 79.2%) were combined for the analyses. However, there were eight participants who had physiologically improbable preintervention FBG values less than 3 mmol/L and these outliers were excluded. The final sample size used in all further analyses was n = 575.
The PA questionnaire showed the average level of activity was 69 ± 46 minutes/week preintervention (63 ± 42 minutes/week unweighted PA) and this increased substantially to a weighted PA level of 635 ± 458 minutes/week postintervention (458 ± 326 minutes/week unweighted PA). At postintervention testing the proportion of participants who were now sufficiently active (≥150 min/wk) increased from zero to 85.7%.
Preintervention FBG levels showed the characteristic increase with age (y = 4.82 + 0.021 × age (yr); r = 0.301; P < 0.0001). Similarly, the relationship between preintervention BMI and FBG was also significant (y = 4.33 + 0.048 × BMI; r = 0.309; P < 0.0001). There was a weak but significant association between change in BMI and change in FBG (y = 0.002 + 0.103 × change in BMI; r = 0.118; P < 0.0044). There was no association between preintervention FBG and fitness (P = 0.252). When the change in FBG across the intervention was regressed against baseline FBG levels, there was a significant negative relationship. The regression line intersects the zero FBG change at a preintervention FBG value of 5.6 mmol/L (). This shows subjects with low pre-study glucose levels typically had increased FBG while those with higher levels had reductions in FBG.
Figure 1 The regression plot for the changes in participants’ FBG versus baseline level of FBG.
Abbreviation: FBG, fasting blood glucose.
Discussion
This study investigated changes in FBG in apparently healthy but insufficiently active adults following an intensive PA intervention. There was no change in the mean FBG following 40 days of daily activity. This general response has also been found by others following physical activity interventions with sedentary adult participants.Citation24,Citation25 For example, Slentz et alCitation25 found that 8 months of exercise training in groups undertaking moderate- or vigorous-intensity activity resulted in no significant change in FBG despite improved insulin sensitivity in both groups. Ross et alCitation24 also found no change in FBG in groups undergoing 14-week exercise and/or diet interventions, despite significant increases in insulin sensitivity. This appears somewhat paradoxical given the significant long-term associations previously found between high FBG, and disease and mortality rates.Citation11
Although there was no change in mean FBG, regression analysis indicated there was an increase in FBG for those with lower baseline values and a decrease in FBG among those with higher baseline FBG. It appears that for some people, a sedentary lifestyle is associated with a reduced FBG set point rather than the typical elevation in FBG. illustrates this FBG pattern (<5.0 mmol/L) for 12.5% (n = 72) of the subjects in the present study.
The body’s response to PA training is well documented and involves the upregulation of glucose control. In the present study of a cross section of apparently healthy but sedentary adults, this was reflected in tighter FBG levels around a mean value of 5.6 mmol/L. Following the daily exercise intervention, those participants with low baseline FBG values showed a rise in FBG. The characteristic pattern of decreased FBG values was seen among those with higher baseline FBG.
Jenkins and HagbergCitation23 reported elevated FBG in normoglycemic participants following a 6-month exercise program while at the same time, prediabetic participants decreased their FBG. In the HERITAGECitation20 study, following a 5-month endurance training program, there was an increase in FBG. Additionally, a decreased insulin response to intravenous glucose was reported in the quartile with the highest baseline glucose tolerance, compared with the increased insulin response in those with the lowest glucose tolerance. Overall, these studies highlight the complex nature of metabolic control and suggest different mechanisms may be operating as part of the upregulation of glucose homeostasis following exercise training.
Regulation of BG is a complex neuroendocrine process with numerous organs involved.Citation9,Citation33 A sedentary lifestyle and poor diet are typically associated with a downregulation or decreased sensitivity of insulin and other hormones associated with glucose control. For example, the blunted insulin-suppression response by the pancreas in response to increased hepatic glucose production is characteristic of type 2 diabetics and contributes to hyperglycemia.Citation34 Additionally, hepatocyte sensitivity of both insulin and glucagon receptors decrease,Citation12 and a decreased glucagon receptor density has also been reported in animal studies involving low activity and/or high fat diets.Citation35 There is also a decreased sensitivity to insulin in adipocyctes and myocytesCitation12 and an increased incretin hormone secretion from the small intestine in response to ingested nutrients in those with obesity, impaired glucose tolerance (IGT), or type 2 diabetes.Citation36 Furthermore, blunted central nervous system secretion, sensing, or responsiveness to afferent signals (such as leptin and insulin levels) are associated with insulin resistance,Citation14 and cardiovascular autonomic dysfunction has been shown in persons with impaired glucose tolerance and central obesity.Citation37
On the other hand, there is evidence that all of these altered regulatory steps can be improved with both acute and regular exercise training.Citation5,Citation38 Exercise acutely increases muscle glucose transport, which is mediated by an increase in the glucose transporter 4 (GLUT4) in skeletal muscle membrane and t-tubules.Citation10,Citation21 Following exercise, it is replaced by an increase in insulin sensitivity.Citation39 Muscle GLUT4 content increases in humans within 7–10 days of training, although these short-term effects wear off within about 72 hours after the last exercise bout.Citation40,Citation41 Exercise training has also been shown to reverse impaired insulin sensitivity such that for a given insulin load, there is a reduced endogenous glucose production and tighter regulation of blood glucose homeostasis.Citation21 The liver also adapts to exercise-related physiological stress through modulation of glucagon receptor binding characteristics to enhance glucose production responsiveness to glucagon stimulus.Citation42,Citation43 Furthermore, chronic endurance exercise has been shown to induce adaptations in pancreatic β-cells, leading to a reduction in glucose-induced insulin secretion.Citation25 Both caloric restriction and exercise were shown to reduce the incretin response to ingested glucose, suggesting glucose-dependent insulinotropic polypeptide may mediate the attenuated glucose-stimulated insulin response after exercise and/or diet interventions.Citation36 Beneficial effects in reflectory autonomic regulation and glucose control have also been found in both humansCitation37 and animal exercise studies.Citation44
Overall, it is possible the increased PA in the previously sedentary participants altered a range of metabolic pathways that help control BG. For those who regulated at a low FBG, this may have involved any number of possible alterations. Although speculative, these may include increased hepatic glucagon receptor sensitivity, a decreased insulin secretion, or better control of gluconeogenesis. These alterations may operate differently in those who regulate at a higher FBG. Moreover, the alterations may have occurred independently or synergistically and may have also involved more than just the pancreas or liver (for example, muscle and adipocyte changes), particularly given the association between weight loss and changes in FBG. From a clinical perspective, it is still an important variable to be measured routinely by individuals seeking to regulate their metabolic control. However, as a general marker of the impact of intervention strategies on glucose variability, it has poor resolution for similar cross-sectional nondiabetic populations.
There are several limitations of this study. The measures of FBG have a reasonable level of day-to-day variability, as shown by prestudy CV values. The FBG measures were undertaken without controlling for physical activity over the previous several days. Acute changes in glucose control have been shown following PA; however, the influence of this on the participant pool is likely to be randomly distributed. There was a small difference in age between the two intervention arms; however, regression analysis showed no association between changes in FBG levels and age. The exclusion of the eight participants with very low FBG values made no difference to the results of this study.
This study has shown a pattern of exercise-induced changes in FBG that operates differently at different ends of the preintervention FBG spectrum. The specific mechanisms that are responsible for these changes cannot be determined, but other research has indicated that any one or more of the numerous regulatory steps outlined may be involved. However, what has previously been shown is that, like those with higher FBG, people with lower FBG may also be at an increased risk of mortality.Citation11
Acknowledgments
This research was funded by grants from the Australian Research Council and the South Australian Department of Health. Appreciation is expressed to the subjects and research students for their support.
Disclosure
The authors report no conflicts of interest in this work.
References
- FrierBMSchernthanerGHellerSRHypoglycemia and cardiovascular risksDiabetes Care201134Supplement 2S132S13721525444
- American Diabetes Association (ADA)Diagnosis and classification of diabetes mellitusDiabetes Care201134Supplement 1S62S6921193628
- World Health OrganizationObesity and Overweight: Fact Sheet No 311GenevaWorld Health Organization2012 Available from: http://www.who.int/mediacentre/factsheets/fs311/en/Accessed July 10, 2012
- World Health OrganizationDiabetes: Fact Sheet No 312GenevaWorld Health Organization2011 Available from: http://www.who.int/mediacentre/factsheets/fs312/en/Accessed July 10, 2012
- ColbergSRSigalRJFernhallBExercise and type 2 diabetes. The American College of Sports Medicine and the American Diabetes Association: joint position statementDiabetes Care20103312e147e16721115758
- WaddenTAWebbVLMoranCHBailerBALifestyle modification for obesity: new developments in diet, physical activity, and behavior therapyCirculation201212591157117022392863
- World Health OrganizationScreening for Type 2 DiabetesGenevaWorld Health Organization2003 Available from: http://www.who.int/diabetes/currentpublications/en/Accessed October 17, 2012
- MunstersMSarisWHEffect of meal frequency on metabolic profiles and substrate partitioning in lean healthy malesPLoS ONE201276e3863222719910
- AronoffSLBerkowitzKShreinerBWantLGlucose metabolism and regulation: beyond insulin and glucagonDiabetes Spectrum2004173183190
- JensenTERichterEARegulation of glucose and glycogen metabolism during and after exerciseJ Physiol2012590Pt 51069107622199166
- Emerging Risk Factors CollaborationSarwarNGaoPSeshasaiSRDiabetes mellitus, fasting blood glucose concentration, and risk of vascular disease: a collaborative meta-analysis of 102 prospective studiesLancet201037597332215222220609967
- SellHDietze-SchroederDEckelJThe adipocyte-myocyte axis in insulin resistanceTrends Endocrinol Metab2006171041642217084639
- RyanASInsulin resistance with aging: effects of diet and exerciseSports Med200030532734611103847
- MortonGJSchwartzMWLeptin and the central nervous system control of glucose metabolismPhysiol Rev201191238941121527729
- BjørnholtJVEriksenGAaserEFasting blood glucose: an underestimated risk factor for cardiovascular death. Results from a 22-year follow-up of healthy nondiabetic menDiabetes Care1999221454910333902
- LawesCMParagVBennettDAAsia Pacific Cohort Studies CollaborationBlood glucose and risk of cardiovascular disease in the Asia Pacific regionDiabetes Care200427122836284215562194
- GoodyearLJKahnBBExercise, glucose transport, and insulin sensitivityAnnu Rev Med1998492352619509261
- SamahaFIqbalNSeshadriPA low-carbohydrate as compared with a low-fat diet in severe obesityNew Engl J Med2003348212074208112761364
- ShaiISchwarzfuchsDHenkinYDietary Intervention Randomized Controlled Trial (DIRECT) GroupWeight loss with a low-carbohydrate, Mediterranean, or low-fat dietN Engl J Med2008359322924118635428
- BouléNGWeisnagelSJLakkaTAEffects of exercise training on glucose homeostasis: the HERITAGE family studyDiabetes Care200528110811415616242
- KirwanJPSolomonTPWojtaDMStatenMAHolloszyJOEffects of 7 days of exercise training on insulin sensitivity and responsiveness in type 2 diabetes mellitusAm J Physiol Endocrinol Metab20092971e151e15619383872
- TrovatiMCartaQCavalotFInfluence of physical training on blood glucose control, glucose tolerance, insulin secretion, and insulin action in non-insulin-dependent diabetic patientsDiabetes Care1984754164206389056
- JenkinsNTHagbergJMAerobic training effects on glucose tolerance in prediabetic and normoglycemic humansMed Sci Sports Exerc201143122231224021606871
- RossRJanssenIDawsonJExercise-induced reduction in obesity and insulin resistance in women: a randomized controlled trialObes Res200412578979815166299
- SlentzCATannerCJBatemanLAEffects of exercise training intensity on pancreatic β-cell functionDiabetes Care200932101807181119592624
- NortonLHNortonKILewisNDollmanJA comparison of two short-term intensive physical activity interventions: methodological considerationsInt J Behav Nutr Phys Act2011813322136578
- AIHW Australian Institute of Health and WelfareThe Active Australia Survey: A Guide and Manual for Implementation, Analysis and ReportingCanberraAustralian Institute of Health and Welfare2003 Available from: http://www.aihw.gov.au/publication-detail/?id=6442467449Accessed October 17, 2012
- Sports Medicine AustraliaSports Medicine Australia (SMA) Pre-Exercise Screening System 2005CanberraSports Medicine Australia2005 Available from: http://sma.org.au/wp-content/uploads/2009/05/new_pre_screening.pdfAccessed July 15, 2012
- NortonKOldsTAnthropometricaSydneyUNSW Press2000
- PickeringTGHallJEAppelLJRecommendations for blood pressure measurement in humans and experimental animals: part 1: blood pressure measurement in humans: a statement for professionals from the Subcommittee of Professional and Public Education of the American Heart Association Council on High Blood Pressure ResearchCirculation2005111569771615699287
- DASET Department of the Arts, Sport, the Environment and TerritoriesPilot Survey of the Fitness of AustraliansCanberraAustralian Government Publishing Service1992
- BachorikPSBradfordRHColeTAccuracy and precision of analyses for total cholesterol as measured with the Reflotron cholesterol methodClin Chem1989358173417392758642
- KalsbeekABruinstroopEYiCXKlieverikLPLa FleurSEFliersEHypothalamic control of energy metabolism via the autonomic nervous systemAnn N Y Acad Sci2010121211412921070249
- BasuRChandramouliVDickeBLandauBRizzaRObesity and type 2 diabetes impair insulin-induced suppression of glycogenolysis as well as gluconeogenesisDiabetes20055471942194815983193
- CharbonneauAMelanconALavoieCLavoieJMAlterations in hepatic glucagon receptor density and in Gsalpha and Gialpha2 protein content with diet-induced hepatic steatosis: effects of acute exerciseAm J Physiol Endocrinol Metab20052891e8e1415687107
- KellyKRBrooksLMSolomonTPKashyapSRO’LearyVBKirwanJPThe glucose-dependent insulinotropic polypeptide and glucose-stimulated insulin response to exercise training and diet in obesityAm J Physiol Endocrinol Metab20092966e1269e127419351807
- LaitinenTLindströmJErikssonJCardiovascular autonomic dysfunction is associated with central obesity in persons with impaired glucose toleranceDiabet Med201128669970421388444
- DrouinRLavoieCBourqueJDucrosFPoissonDChiassonJLIncreased hepatic glucose production response to glucagon in trained subjectsAm J Physiol19982741 Pt 1e23e289458743
- HolloszyJOExercise-induced increase in muscle insulin sensitivityJ Appl Physiol200599133834316036907
- ShortKRVittoneJLBigelowMLImpact of aerobic exercise training on age-related changes in insulin sensitivity and muscle oxidative capacityDiabetes20035281888189612882902
- VenablesMCShawCSJeukendrupAEWagenmakersAJEffect of acute exercise on glucose tolerance following post-exercise feedingEur J Appl Physiol2007100671171717624545
- LavoieCGlucagon receptors: effect of exercise and fastingCan J Appl Physiol200530331332716129896
- PodolinDAWillsBKWoodIOLopezMMazzeoRSRothDAAttenuation of age-related declines in glucagon-mediated signal transduction in rat liver by exercise trainingAm J Physiol Endocrinol Metab20012813e516e52311500307
- JorgeLda PurezaDYda Silva DiasDContiFFIrigoyenMCDe AngelisKDynamic aerobic exercise induces baroreflex improvement in diabetic ratsExp Diabetes Res2012201210868022203833