
Abstract
Introduction
Patients rarely, if ever, take their medications exactly as prescribed. The extent to which missed doses interfere with a drug’s therapeutic effect remains unclear.
Methods
After weekly oral dosing of methotrexate (MTX) for rheumatoid arthritis, its polyglutamate derivatives (MTXglu) accumulate in red blood cells, where they are markers for the drug’s therapeutic effectiveness. We used Medication Event Monitoring System data and pharmacokinetic modeling to analyze whether missing MTX doses causes the MTXglu level in red blood cells to fall below the range associated with the drug’s clinical effect.
Results
For patients initiating oral MTX, the threshold for clinical effectiveness and the steady state level were reached in medians of 6 weeks and 22 weeks, respectively. For patients at steady state who discontinued MTX, the MTXglu level fell below the therapeutic threshold after a median of 3 weeks. After initiating MTX, single missed doses did not cause a loss of therapeutic effect in the median patient if they occurred after 10 weeks, while runs of ≥3 consecutive missed doses did cause the MTXglu level to fall below the therapeutic threshold.
Conclusion
While there is considerable variation between patients, pharmacokinetic modeling indicates that instances of isolated single missed doses of MTX typically will not cause polyglutamated methotrexate levels in red blood cells to fall below the range associated with the therapeutic effect. Runs of ≥3 consecutive missed doses, however, are typically expected to result in a loss of the therapeutic effect.
Introduction
If a patient misses one or more doses of a prescribed medication, the pertinent medical question is whether this causes a loss of the therapeutic effect.Citation1 If the duration of the therapeutic effect of a dose exceeds the dosing interval—as with some statins, for example—the therapeutic effect may persist despite missed doses, unless there are runs of consecutive missed doses.Citation2–Citation4 Hence, it is not the total number of missed doses, but their distribution that determines if there is a loss of therapeutic effect.
Methotrexate is a folic acid antagonist, widely used in the treatment of rheumatoid arthritis.Citation5 Oral methotrexate (MTX) clears rapidly from the serum after ingestion, but its polyglutamated derivatives accumulate in red blood cells.Citation5,Citation6 Polyglutamated MTX (MTXglun, where n is a number from 1 to 5) in red blood cells mirrors, it is thought, its concentration in the tissues, and is related to the therapeutic effect in patients with rheumatoid arthritis.Citation6
Here, we use pharmacokinetic modeling to analyze whether missed doses of oral MTX cause MTXglu levels in red blood cells to fall below the range associated with the therapeutic effect, using published data on the pharmacokinetics of MTX and patterns of non-adherence observed in rheumatoid arthritis patients.
Methods
Study Overview
This was a modeling study of the effect of rheumatoid arthritis patients’ non-adherence to prescribed MTX dosing on the therapeutic effect, by determining whether MTXglutotal (henceforth, “MTXglu”) concentrations in red blood cells remain within the therapeutic range if doses are missed. The pharmacokinetics of MTXglu concentrations in red blood cells were previously described by Dalrymple et al (2008) using first-order exponential equations.Citation7 We used such equations to calculate MTXglu concentrations in red blood cells over periods of 24 to 36 weeks after initiating MTX. MTXglu concentrations were checked against the threshold for therapeutic effectiveness reported by de Rotte et al (2015).Citation8 Patterns of missed MTX doses over 24 weeks in clinical practice were extracted from a study of adherence in patients participating in the National Data Bank (NDB) for rheumatic diseases.Citation9,Citation10 Adherence data were measured using a Medication Event Monitoring System (MEMS) and presented in the form of a “heat map”, a color-coded graph of the number of doses taken each week by each patient.Citation10 Dosing patterns were used for selected patients with instances of single missed doses (patients 006, 0021, 0034), or of 2 consecutive (patients 0017, 0027) or 3 consecutive (patients 008, 0011) missed doses.
Parameters and Equations
A logarithmic rise to maximum equation was fitted to the data for patients initiating MTX, with the accumulation of MTXglu in red blood cells over time being described by the parameters, half-life of accumulation (t1/2(a)) and eventual maximum concentration (a). MTXglu concentrations after stopping MTX were modeled as first-order exponential decay, to calculate the half-life of elimination (t1/2(e)). The parameters and their definitions are listed in .
Table 1 Parameters for MTXglu Concentration in Red Blood Cells
The logarithmic rise to maximum of MTXglu concentration in red blood cells is described by:
where y is the MTXglu concentration, x is the time in weeks, and b is a function of t1/2(a).
The exponential decay in MTXglu concentration is described by:
where c is the MTXglu concentration at the time dosing stops and d is a function of t1/2(e).
Data Sources
The primary data source for the parameters listed in was the prospective observational study reported by Dalrymple et al (2008).Citation7 Dalrymple et al (2008) reported the median and range of the accumulation half-life (t1/2(a)) and range of the maximum MTXglu concentration (a) for 10 patients initiating MTX and continuing for 40 weeks.Citation7 The median starting dose of 10 mg/week was titrated according to clinical response and the final median dose was 15 mg/week. Dalrymple et al (2008) also reported the median and range of t1/2(e) values for 10 rheumatoid arthritis patients stopping MTX.Citation7 At the time of discontinuing MTX, the median dosage was 12.5 mg/week (range 7.5–20 mg/week) and patients had been receiving a stable dosage of MTX for a median of 17 months (range 1.5–120 months).Citation7
Dalrymple et al (2008) did not, however, provide the median value of the maximum MTXglu concentration (a). Hence, we calculated median values of both a and t1/2(a) from median MTXglu levels in red blood cells reported for the “derivation cohort” in the “MTX in Rotterdam” (MTX-R) study.Citation8 (We did not include the data for the “validation cohort” because it was a clinical trial in which the starting MTX dose was set at 25 mg/week).Citation8 The MTX-R derivation cohort was a longitudinal prospective cohort of patients who started MTX for rheumatoid arthritis between January 2006 and March 2011.Citation8,Citation11 Median serum levels of MTXglu were reported for 102 patients at 12, 24, and 36 weeks. The MTX dosage was set by the physician at each visit; the mean (SD) dose was 15 (2) mg/week.Citation8 The median value of t1/2(a) calculated for the MTX-R study (6.5 weeks) is similar to the median value observed by Dalrymple et al (8.3 weeks). For the lower and upper limits of MTXglu levels in red blood cells while taking MTX, we used the range of MTXglu levels (91–352 nmol/8x1012 red blood cells) reported by Dalrymple et al (2008).Citation7 This range of values is similar to that reported in the MTX-R study (0–396 nmol/L).Citation7,Citation8
Patterns of MTX dose taking in clinical practice were extracted from the NDB study of 60 rheumatoid arthritis patients using MEMS.Citation10 Patients included in the NDB study were currently taking oral MTX that had been initiated ≤12 months prior to study enrollment. At the time of the most recent questionnaire, the mean (SD) MTX dosage was 14.1 (5.5) mg/week. Based on the heat map, and excluding the 10 patients who discontinued MTX, the percentages of patients with zero missed doses, patients with instances of single missed doses, or with instances of 2, 3, or ≥4 consecutive missed doses were, respectively, 28%, 44%, 12%, 10%, and 6%.
Calculation of Red Blood Cell Levels of MTXglu
Logarithmic Rise to Maximum
Median values for parameters a, b, and t1/2(a) (see ) were calculated by curve fitting to red blood cell MTXglu concentrations in the MTX-R cohort using equation 1.Citation8 We assumed that the denominator for MTXglu concentration in Dalrymple et al (8 × 10¹² red blood cells) corresponds to 1 L.
Exponential Decay
EquationEquation 2(2) was used to calculate MTXglu levels after cessation of MTX dosing. The value of c, the starting MTXglu level, was the median (range) steady state value, calculated as 90% of the maximum (0.9*a), as computed for the MTX-R cohort.Citation8
MTXglu Levels with Missed Doses of MTX
Median MTXglu levels during periods of missed dose(s) were calculated using the median (range) value of d shown in , with the value of c the MTXglu level before the missed dose(s). It was assumed that patients took MTX at the beginning of the week and that the MTXglu level was the value at the end of the week (ie, the trough value). On resumption of dosing, the value of x (calculated by rearranging Equationequation 1(1) ) corresponding to the last MTXglu level was taken as the initial value of x.
Therapeutic Range of MTXglu
For the lower limit of the therapeutic range of MTXglu levels, we used the threshold discriminating moderate/good- from non-response (74 nmol/L) reported by de Rotte et al (2015) for the MTX-R cohort at assessments at 12, 24, and 36 weeks.Citation8 In the MTX-R cohort, clinical effect was measured using the disease activity score in 28 joints (DAS28) and response defined according to European League Against Rheumatism (EULAR) criteria.Citation8 We also considered the range of estimates of the lower limit of the MTXglu threshold for clinical response reported in the literature (60–83 nmol/L).Citation8,Citation12–Citation15 In a cross-sectional study, measuring clinical response using a physician’s global assessment, Angelis-Stoforidis et al (1999) reported mean MTXglu concentrations in red blood cells for responders, partial responders, and non-responders of 61 nmol/L, 51 nmol/L, and 21 nmol/L, respectively.Citation12 In another cross-sectional study, Dervieux et al (2004) reported a cutoff of 60 nmol/L for a good response to MTX, based on a VAS score in a physician’s global assessment.Citation13 Murosaki et al (2017) reported a cutoff of 69 nmol/L, based on a change in Disease Activity Score-28-C-reactive protein (DAS28-CRP) score of >1.2.Citation14 Finally, Takahashi et al (2017) showed that an MTXglu concentration of 83 nmol/L at week 12 was the threshold for a DAS28 improvement of ≥1.2 at week 24.Citation15
Data Analysis
Curve fitting to data points for MTXglu concentration in red blood cells by time was done in SigmaPlot 12. The MTXglu concentration in the MTX-R cohort was graphed to determine the times to reach: first, the threshold of the therapeutic effect, and second, the steady state level. After reaching steady state and then discontinuing MTX, the time for the MTXglu concentration to fall below the threshold for the therapeutic effect was determined. MTXglu levels by time were graphed for selected patients in the NDB cohort with instances of single missed doses, and with instances of 2 and 3 consecutive missed doses.
Results
Time to Reach Therapeutic Range and Steady State
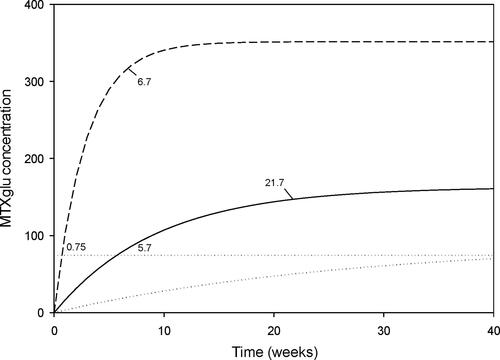
shows MTXglu concentration in red blood cells by time after initiating oral MTX, modeled for the MTX-R cohort. The median patient reached the therapeutic threshold at 5.7 weeks, and steady state at 21.7 weeks. The patient at the upper limit reached the therapeutic threshold at 0.75 weeks, and the steady state at 6.7 weeks, while the lower limit patient did not reach the therapeutic threshold before 40 weeks of treatment.
Figure 1 MTXglu concentration by time. The solid, dotted, and dashed curves represent the median, lower estimate, and upper estimate of MTXglu concentration in red blood cells plotted against time. The horizontal dotted line represents the cut-off MTXglu concentration discriminating moderate/good- from non-response (74 nmol/L).Citation8 The weeks to reach this threshold are indicated. The weeks to reach steady state (90% of maximum) are also indicated (the lower estimate does not reach the therapeutic threshold or steady state before 40 weeks).
Time to Lose Therapeutic Effect After Discontinuing MTX
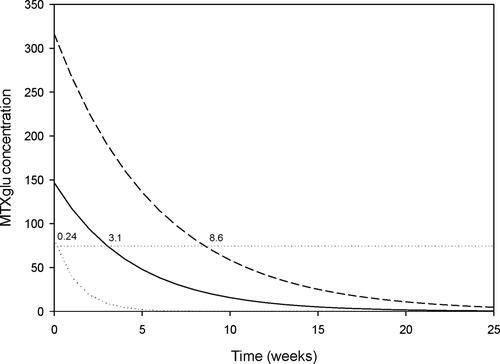
The time to lose the therapeutic effect after discontinuing MTX while at steady state is shown in . The median (range) time was 3.1 weeks (range 0.24–8.6 weeks).
Figure 2 MTXglu concentration by time after discontinuing MTX. Shown is the MTXglu concentration in red blood cells plotted against time after discontinuing MTX dosing when at the steady state level. The solid, dotted, and dashed curves represent the median, lower estimate, and upper estimate. The horizontal dotted line represents the cut-off MTXglu concentration discriminating moderate/good- from non-response (74 nmol/L).Citation8 The weeks to reach this threshold are indicated.
Effect of Missed Doses
Single Missed Doses
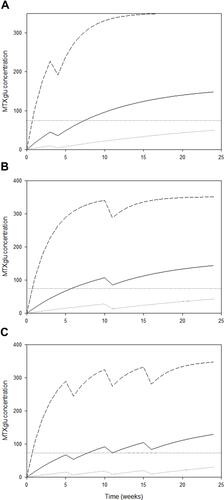
The effect of isolated, single missed doses is shown using the dosing patterns of patients 0021, 006, and 0034, from the NDB study. A single missed dose prior to 6 weeks (patient 0021) extended the time needed to cross the therapeutic threshold to 7.3 weeks for the median patient (a delay of 1.6 weeks) but was otherwise inconsequential (). A single missed dose at week 11 (patient 006) did not cause a loss of therapeutic effect in the median patient (). Two isolated instances of single missed doses after the therapeutic threshold was crossed did not cause the loss of the therapeutic effect in patient 0034 ().
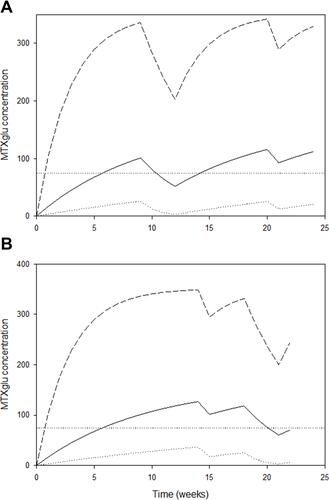
Figure 3 MTXglu concentration after isolated, single missed doses by time for patients (A) 0021, (B) 006, and (C) 0034. Panel (A) shows the MTXglu concentration in red blood cells plotted against time for Pt 0021. Patient 0021 missed a single dose at week 4. Panel (B) shows the MTXglu concentration in red blood cells plotted against time for Pt 006. Patient 006 missed a single dose at week 11. Panel (C) shows the MTXglu concentration in red blood cells plotted against time for Pt 0034. Patient 0034 missed single doses at weeks 6, 11, and 16. The solid, dotted, and dashed curves represent the median, lower estimate, and upper estimate of MTXglu concentration in red blood cells plotted against time. The horizontal dotted line represents the cut-off MTXglu concentration discriminating moderate/good- from non-response (74 nmol/L).Citation8
Consecutively Missed Doses
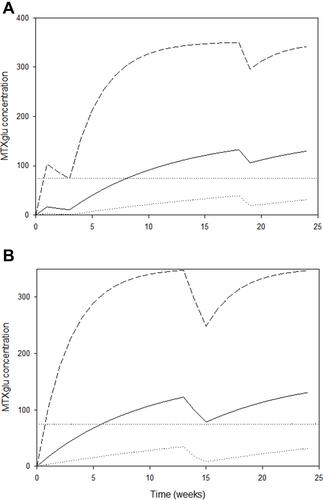
The effect of two consecutive missed doses before the median patient reached the therapeutic range delayed the time to cross the therapeutic threshold to 8.1 weeks in the case of patient 0017 (). In patient 0027, two consecutive missed doses after crossing the therapeutic threshold did not cause a loss of therapeutic effect ().
Figure 4 MTXglu concentration after two consecutive missed doses by time for patients (A) 0017 and (B) 0027. Panel (A) shows the MTXglu concentration in red blood cells plotted against time for Pt 0017. Patient 0017 missed 2 consecutive doses at weeks 2 and 3, and a single dose at week 19. Panel (B) shows the MTXglu concentration in red blood cells plotted against time for Pt 0027. Patient 0027 missed 2 consecutive doses at weeks 14 and 15. The solid, dotted, and dashed curves represent the median, lower estimate, and upper estimate of MTXglu concentration in red blood cells plotted against time. The horizontal dotted line represents the cut-off MTXglu concentration discriminating moderate/good- from non-response (74 nmol/L).Citation8
Three consecutively missed doses caused a loss of therapeutic effect in both patients 008 () 0011 ().
Figure 5 MTXglu concentration after three consecutive missed doses by time for patients (A) 008 and (B) 0011. Panel (A) shows the MTXglu concentration in red blood cells plotted against time for Pt 008. Patient 008 missed 3 consecutive doses at weeks 10, 11, and 12, and a single dose at week 21. Panel (B) shows the MTXglu concentration in red blood cells plotted against time for Pt 0011. Patient 0011 missed a single dose at week 15 and 3 consecutive doses at weeks 19, 20, and 21. The patient was censored at week 23. The solid, dotted, and dashed curves represent the median, lower estimate, and upper estimate of MTXglu concentration in red blood cells plotted against time. The horizontal dotted line represents the cut-off MTXglu concentration discriminating moderate/good- from non-response (74 nmol/L).Citation8
Discussion
In summary, pharmacokinetic modeling indicates that, for the median patient, the predominant pattern of missed MTX doses after starting MTX, ie, one of isolated, single missed doses,Citation10 would have little clinical effect, other than delaying the time to reach the therapeutic threshold and/or steady state. For the median patient at steady state, 3 consecutive missed doses would be required for MTXglu levels in red blood cells to fall below the therapeutic range.
These findings are dependent on the definition of the therapeutic range of MTX in terms of MTXglu levels in red blood cells. Despite some contradictory results,Citation16,Citation17 most investigators have reported a relationship between the concentration of MTXglu in red blood cells and the clinical effect in patients with rheumatoid arthritisCitation8,Citation12–Citation15,Citation18–Citation20 and juvenile idiopathic arthritis.Citation21 There is consistent evidence that the lower limit of the MTXglu threshold for clinical response in rheumatoid arthritis is in the range 60–83 nmol/L.Citation8,Citation12–Citation15 Using different thresholds would have only a minor effect on the results. With a threshold of 74 nmol/L, the estimated time to lose the therapeutic effect when discontinuing MTX after reaching steady state is a median of 3.1 weeks (range 0.24–8.6 weeks). The corresponding times using the threshold of 60 nmol/L are 4.0 (0.53–9.9) weeks, and using the 83 nmol/L threshold 2.6 (0–7.9) weeks (data not shown).
There are no consistent data with which to define an upper limit of the therapeutic range. Oral doses of 5–25 mg/week of MTX are considered low.Citation22 While adverse effects occur at these doses, they do not seem to be related to the concentration of MTXglu in red blood cells.Citation23 In a systematic review of 13 studies, an association between MTXglu and adverse effects was reported in only one study.Citation23 A correlation with hepatotoxicity has been reported.Citation15 There were 7 studies of the association between MTXglu in red blood cells and hepatotoxicity in the systematic review cited above.Citation23 In only one of these studies was a statistically significant association reported.Citation23 In addition, there was no consistent definition of hepatotoxicity in these studies.Citation23
The results presented here are subject to certain caveats. Because this was a modeling study, the findings represent a hypothesis that requires testing in prospective studies. The pharmacokinetic analysis is dependent on data available in the published literature, which are in the form of summary statistics rather than individual patient data. There is a lack of information about the distribution of values for pharmacokinetic parameters, other than the median, minimum, and maximum. The principal limitation, however, is the wide variation in pharmacokinetic parameter values between individual patients. The finding that 3 or more consecutive missed doses are required before loss of the therapeutic effect applies to the average patient and for some patients, the therapeutic effect could be lost after missing a single dose. Prospective individual patient monitoring will be required to resolve this. Nevertheless, the findings suggest that it is not necessarily a cause for immediate action if a patient misses isolated single doses.
This analysis is focused on patient behavior as the cause of missed MTX doses, but a pause in MTX treatment may be advised for medical reasons—for example, the administration of antibiotics or vaccines, or interruptions due to surgery. MTX treatment decreases the response to pneumococcal and influenza vaccines in patients with rheumatoid arthritis.Citation24 A pause in MTX treatment for 2 weeks after a seasonal flu vaccination—a period corresponding to missing two consecutive weekly doses—has been demonstrated to improve the immunogenicity of the vaccination.Citation25 Consistent with our analysis, the 2-week pause in MTX treatment resulted in no increase in rheumatoid arthritis disease activity.Citation25
Conclusions
Pharmacokinetic modeling indicates that, for the median patient, instances of isolated, single missed doses after starting MTX might delay the time to reach the threshold for the therapeutic effect, but otherwise are likely to be inconsequential. For the median patient at steady state, 3 or more consecutive missed doses of MTX—ie, a 3-week discontinuation of MTX treatment—would be required for the MTXglu level in red blood cells to fall below the therapeutic threshold. Prospective individual patient monitoring of rheumatoid arthritis patients taking MTX is required, but the analysis suggests that missing individual doses should not be an immediate cause for concern.
Data Sharing Statement
The data analyzed in this study are from the published literature cited within.
Disclosure
The authors declare that they have no competing interests.
Additional information
Funding
References
- Maclean R, Pfister M, Zhou Z, Roy A, Tuomari VA, Heifets M. Quantifying the impact of nonadherence patterns on exposure to oral immunosuppressants. Ther Clin Risk Manag. 2011;2011(7):149–156. doi:10.2147/TCRM.S16870
- Morrison A, Stauffer ME, Kaufman AS. Defining medication adherence in individual patients. Patient Prefer Adherence. 2015;9:893–897. doi:10.2147/PPA.S86249
- Stauffer ME, Hutson P, Kaufman AS, Morrison A. The adherence rate threshold is drug specific. Drugs R D. 2017;17(4):645–653. doi:10.1007/s40268-017-0216-6
- Kaufman AS, Morrison A. Patterns of non-adherence to oral antiretroviral medication: frequencies of consecutively missed doses. Patient Prefer Adherence. 2019;13:389–394. doi:10.2147/PPA.S192153
- Tian H, Cronstein BN. Understanding the mechanisms of action of methotrexate: implications for the treatment of rheumatoid arthritis. Bull NYU Hosp Jt Dis. 2007;65(3):168–173.
- Inoue K, Yuasa H. Molecular basis for pharmacokinetics and pharmacodynamics of methotrexate in rheumatoid arthritis therapy. Drug Metab Pharmacokinet. 2014;29(1):12–19. doi:10.2133/dmpk.DMPK-13-RV-119
- Dalrymple JM, Stamp LK, O’Donnell JL, Chapman PT, Zhang M, Barclay ML. Pharmacokinetics of oral methotrexate in patients with rheumatoid arthritis. Arthritis Rheum. 2008;58(11):3299–3308. doi:10.1002/art.24034
- de Rotte MC, den Boer E, de Jong PH, et al. Methotrexate polyglutamates in erythrocytes are associated with lower disease activity in patients with rheumatoid arthritis. Ann Rheum Dis. 2015;74(2):408–414. doi:10.1136/annrheumdis-2013-203725
- Wolfe F, Michaud K. The National Data Bank for rheumatic diseases: a multi-registry rheumatic disease data bank. Rheumatology. 2011;50(1):16–24. doi:10.1093/rheumatology/keq155
- Michaud K, Vrijens B, Tousset E, et al. Real-world adherence to oral methotrexate measured electronically in patients with established rheumatoid arthritis. ACR Open Rheumatol. 2019;1(9):560–570. doi:10.1002/acr2.11079
- den Boer E, de Rotte MC, Pluijm SM, Heil SG, Hazes JM, de Jonge R. Determinants of erythrocyte methotrexate polyglutamate levels in rheumatoid arthritis. J Rheumatol. 2014;41(11):2167–2178. doi:10.3899/jrheum.131290
- Angelis-Stoforidis P, Vajda FJ, Christophidis N. Methotrexate polyglutamate levels in circulating erythrocytes and polymorphs correlate with clinical efficacy in rheumatoid arthritis. Clin Exp Rheumatol. 1999;17(3):313–320.
- Dervieux T, Furst D, Lein DO, et al. Polyglutamation of methotrexate with common polymorphisms in reduced folate carrier, aminoimidazole carboxamide ribonucleotide transformylase, and thymidylate synthase are associated with methotrexate effects in rheumatoid arthritis. Arthritis Rheum. 2004;50(9):2766–2774. doi:10.1002/art.20460
- Murosaki T, Nagatani K, Sato T, et al. Prediction of the therapeutic response to methotrexate at 24 weeks by methotrexate-polyglutamates concentration in erythrocytes at 8 weeks in patients with rheumatoid arthritis. Mod Rheumatol. 2017;27(3):411–416. doi:10.1080/14397595.2016.1208137
- Takahashi C, Kaneko Y, Okano Y, et al. Association of erythrocyte methotrexate-polyglutamate levels with the efficacy and hepatotoxicity of methotrexate in patients with rheumatoid arthritis: a 76-week prospective study. RMD Open. 2017;3(1):e000363. doi:10.1136/rmdopen-2016-000363
- Stamp LK, O’Donnell JL, Chapman PT, et al. Methotrexate polyglutamate concentrations are not associated with disease control in rheumatoid arthritis patients receiving long-term methotrexate therapy. Arthritis Rheum. 2010;62(2):359–368. doi:10.1002/art.27201
- Pan S, Stamp LK, Duffull SB, et al. Assessment of the relationship between methotrexate polyglutamates in red blood cells and clinical response in patients commencing methotrexate for rheumatoid arthritis. Clin Pharmacokinet. 2014;53(12):1161–1170. doi:10.1007/s40262-014-0179-5
- Dervieux T, Furst D, Lein DO, et al. Pharmacogenetic and metabolite measurements are associated with clinical status in patients with rheumatoid arthritis treated with methotrexate: results of a multicentre cross sectional observational study. Ann Rheum Dis. 2005;64(8):1180–1185. doi:10.1136/ard.2004.033399
- Hornung N, Ellingsen T, Attermann J, Stengaard-Pedersen K, Poulsen JH. Patients with rheumatoid arthritis treated with methotrexate (MTX): concentrations of steady-state erythrocyte MTX correlate to plasma concentrations and clinical efficacy. J Rheumatol. 2008;35(9):1709–1715.
- Hobl EL, Jilma B, Erlacher L, et al. A short-chain methotrexate polyglutamate as outcome parameter in rheumatoid arthritis patients receiving methotrexate. Clin Exp Rheumatol. 2012;30(2):156–163.
- Calasan MB, den Boer E, de Rotte MC, et al. Methotrexate polyglutamates in erythrocytes are associated with lower disease activity in juvenile idiopathic arthritis patients. Ann Rheum Dis. 2015;74(2):402–407. doi:10.1136/annrheumdis-2013-203723
- Lucas CJ, Dimmitt SB, Martin JH. Optimising low-dose methotrexate for rheumatoid arthritis-a review. Br J Clin Pharmacol. 2019;85(10):2228–2234. doi:10.1111/bcp.14057
- Mohamed HJ, Sorich MJ, Kowalski SM, et al. The role and utility of measuring red blood cell methotrexate polyglutamate concentrations in inflammatory arthropathies–a systematic review. Eur J Clin Pharmacol. 2015;71(4):411–423. doi:10.1007/s00228-015-1819-x
- Hua C, Barnetche T, Combe B, Morel J. Effect of methotrexate, anti-tumor necrosis factor α, and rituximab on the immune response to influenza and pneumococcal vaccines in patients with rheumatoid arthritis: a systematic review and meta-analysis. Arthritis Care Res. 2014;66(7):1016–1026. doi:10.1002/acr.22246
- Park JK, Lee YJ, Shin K, et al. Impact of temporary methotrexate discontinuation for 2 weeks on immunogenicity of seasonal influenza vaccination in patients with rheumatoid arthritis: a randomised clinical trial. Ann Rheum Dis. 2018;77(6):898–904.