
Abstract
Purpose
To determine the relationship between different spectral domain optical coherence tomography (SD-OCT) signs of retinal ischemia in acute central retinal vein occlusion (CRVO) and whether they predict anterior segment neovascularization (ASNV).
Design
Retrospective, observational study.
Subjects
Thirty-nine consecutive patients with acute CRVO and 12 months of follow-up.
Methods
We graded baseline SD-OCTs for increased reflectivity of the inner retina, loss of definition of inner retinal layers, presence of a prominent middle-limiting membrane (p-MLM) sign, and presence of paracentral acute middle maculopathy (PAMM). Graders were masked with respect to all clinical information.
Results
The intraclass correlation coefficients (ICCs) of grading–regrading by graders 1 and 2 were 0.8104, 95% confidence interval (CI) (0.6686, 0.8956), and 0.7986, 95% CI (0.6475, 0.8892), respectively. The intragrader coefficients of repeatability (COR) for graders 1 and 2 were 0.94 and 0.92, respectively. The ICC of graders 1 compared with 2 was 0.8039, 95% CI (0.6544, 0.8916). The intergrader COR was 0.80. SD-OCT grades of baseline ischemia were not associated with baseline visual acuity (VA), central subfield mean thickness (CSMT), or relative afferent pupillary defect; 12-month VA, CSMT, change in VA, change in CSMT, number of antivascular endothelial growth factor injections or corticosteroid injections, or proportion of eyes developing ASNV. SD-OCT grades of ischemia did not correlate with the proportion of eyes having the p-MLM sign or PAMM. PAMM and p-MLM are milder signs of ischemia than increased reflectivity of the inner retinal layers. Eyes with PAMM can evolve, losing PAMM and gaining the p-MLM sign.
Conclusion
Grading of ischemia from SD-OCT in acute CRVO was repeatable within graders and reproducible across graders for the graders in this study. SD-OCT signs of ischemia are not correlated with each other and do not reliably predict subsequent ASNV. Close monitoring of eyes with acute CRVO continues to be the safest method to avoid missing ASNV and neovascular glaucoma.
Introduction
Assessing ischemia in acute central retinal vein occlusion (CRVO) has attracted clinical efforts for 50 years in an attempt to predict the development of anterior segment neovascularization (ASNV) and neovascular glaucoma (NVG) and to guide the frequency of follow-up. Approaches have included stratification by best-corrected visual acuity (BCVA), measurement of the area of capillary nonperfusion on fluorescein angiography (FA), quantitation of the relative afferent pupillary defect (RAPD), assessment of the scotoma size on Goldmann perimetry, and measurement of various indices on global electroretinography (ERG).Citation1–Citation3 Recently, spectral domain optical coherence tomography (SD-OCT) was found to be useful in this regard. The “prominent middle-limiting membrane sign” (p-MLM sign) was described as a hyperreflective line at the inner synaptic portion of the outer plexiform layer occurring in 28% of cases and associated with ischemic CRVO diagnosed from overall clinical impression based on BCVA, fundus examination, RAPD, and FA made independent of SD-OCT grading.Citation4 In addition, paramacular acute middle maculopathy, an SD-OCT sign of ischemia in the deeper capillary bed of the inner retina, has been observed in CRVO among other conditions.Citation5
We have described other SD-OCT associations with ischemia in acute CRVO, including the loss of definition of the boundaries between the inner retinal lamina and increased reflectivity of the inner retina.Citation6 In this study, we addressed the question whether these signs have value in predicting visual outcome and development of ASNV in eyes with acute CRVO.
Methods
This was a retrospective study of 39 consecutive patients with acute CRVO irrespective of the presence or absence of macular edema who had baseline and follow-up SD-OCTs and at least 12-month follow-up. Acute CRVO was defined as an episode in which the patient noted a change in vision leading to a visit to the ophthalmologist together with a fundus appearance compatible with CRVO. No patient received treatment before capture of the SD-OCT images. Baseline data extracted from the clinical charts included demographic information, presence of diabetes mellitus, hypertension, and preexisting primary open angle glaucoma. Follow-up information included development of ASNV; best measured visual acuity (VA) using the patient’s correction and pinhole; and presence or absence of a RAPD; interventions including antivascular endothelial growth factor injections (anti-VEGF), intravitreal corticosteroid injections, laser panretinal photocoagulation, and incisional glaucoma procedures; and measurements of SD-OCT central subfield mean thickness (CSMT).
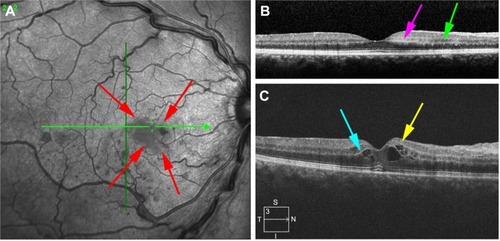
The level of ischemia on SD-OCT images was graded as none to mild (grade 1), moderate (grade 2), and severe (grade 3). The standard images used in grading the SD-OCTs are shown in –. Grading of ischemia from the SD-OCT was based on whether the inner retinal layers could be delineated and on the reflectivity of these layers. The presence and quantity of macular edema, intraretinal cysts, or subretinal fluid had no bearing on the grade of ischemia. When there was concomitant intraretinal hemorrhage, the grading was done based on a zone without intraretinal hemorrhage if one was present, but if intraretinal hemorrhage was confluent, the inner retina was hyperreflective and delineation of layers was obscured by the hemorrhage, such cases were graded as severe ischemia.
Figure 1 Grading standard used for a CRVO with none to mild ischemia (grade 1).
Abbreviations: CRVO, central retinal vein occlusion; SD-OCT, spectral domain optical coherence tomography.
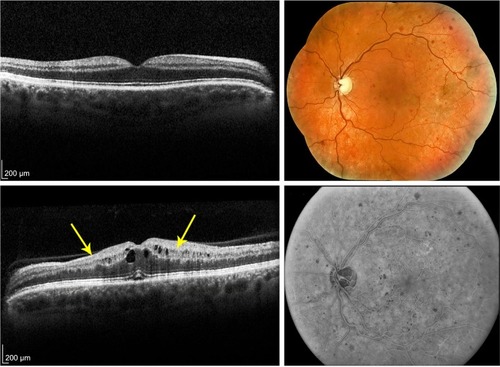
Figure 2 Grading standard used for a CRVO with moderate ischemia (grade 2).
Abbreviations: CRVO, central retinal vein occlusion; SD-OCT, spectral domain optical coherence tomography; N, nasal; S, superior; T, temporal; I, inferior.
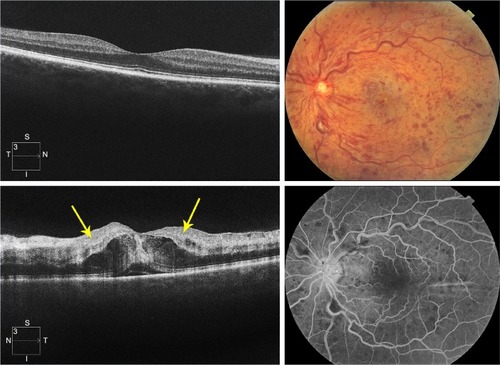
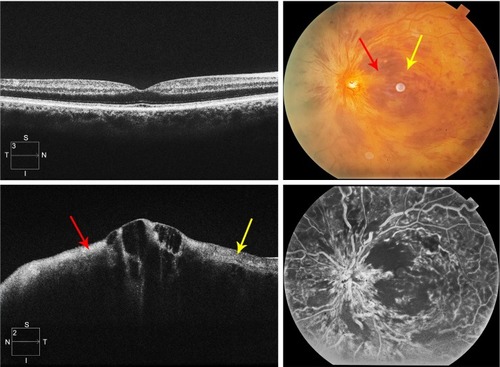
Figure 3 Grading standard used for a CRVO with severe ischemia (grade 3).
Abbreviations: CRVO, central retinal vein occlusion; SD-OCT, spectral domain optical coherence tomography; N, nasal; S, superior; T, temporal; I, inferior.
Intragrader repeatability and intergrader agreement were assessed by intraclass correlation coefficients (ICCs) and Bland–Altman analysis with the calculation of coefficients of repeatability (COR).Citation7 Statistical analyses were performed using JMP software (version 4.0, SAS Corporation, Cary, NC, USA) and MedCalc statistical software version 15.11.1 (MedCalc Software bvba, Ostend, Belgium).
Ischemia grades for baseline SD-OCTs were assigned independently by two experienced retina specialists twice with several weeks between gradings to allow intra- and intergrader agreements to be determined. Correlations of baseline ischemia grades with proportions of baseline p-MLM and paracentral acute middle maculopathy (PAMM) signs were calculated.
Waiver of written informed consent from participants and waiver of patients’ data privacy and security provisions according to Health Insurance Portability and Accountability Act of 1996 (HIPAA) were approved by the Presbyterian Hospital Institutional Review Board (ID 16-455).
Results
The ICC of grading–regrading by graders 1 and 2 was 0.8104, 95% confidence interval (CI) (0.6686, 0.8956), and 0.7986, 95% CI (0.6475, 0.8892), respectively. The intragrader COR for graders 1 and 2 was 0.94 and 0.92, respectively. The ICC of grader 1 compared with 2 was 0.8039, 95% CI (0.6544, 0.8916). The intergrader COR was 0.80. Bland–Altman plots for intragrader repeatability and intergrader reproducibility are shown in . There was no evidence of fixed or proportional bias between graders.
Figure 4 Bland–Altman plots of intragrader repeatability and intergrader reproducibility in the assessment of SD-OCT images in acute central retinal vein occlusion.
Abbreviations: SD, standard deviation; SD-OCT, spectral domain optical coherence tomography.

Of the 39 eyes, the distribution was 13, 17, and 9 for mild, moderate, and severe grades of ischemia at baseline, respectively. Demographic information on the subjects is shown in . There were no statistically significant differences in age, gender, or prevalence of hypertension, diabetes, or primary open angle glaucoma across the grades of ischemia as graded from baseline SD-OCTs. The median duration of symptoms before examination was 2 weeks, interquartile range 1–6 weeks.
Table 1 Characteristics of patients and eyes
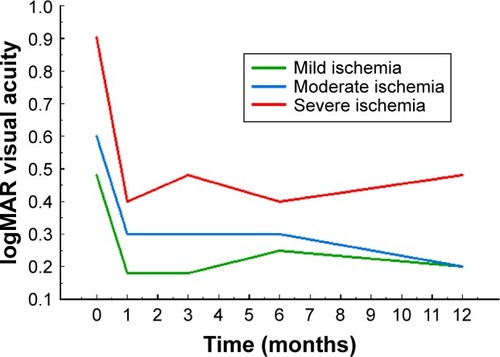
shows the distribution of baseline VAs, 12-month VAs, and change in VAs as a function of baseline SD-OCT ischemia grades. The median logarithm of the minimum angle of resolution (logMAR) VA at baseline was progressively worse as the baseline SD-OCT ischemia grade increased, but the trend was not statistically significant (P=0.1246, Kruskal–Wallis test). The median logMAR VA at 12-month follow-up progressively worsened as the baseline SD-OCT ischemia grade increased, but the trend was not statistically significant (P=0.1266, Kruskal–Wallis test). There was no trend in distribution of 12-month change in logMAR visual acuities as a function of baseline SD-OCT ischemia grades (P=0.5780, Kruskal–Wallis test).
Table 2 Distribution of baseline characteristics and outcomes by baseline grade of ischemia
The time course of logMAR VA as a function of baseline SD-OCT ischemia grades is shown in .
Figure 5 The time course of logMAR visual acuity graphed as a function of time in months and stratified by baseline ischemia grade as graded from SD-OCT images.
Abbreviations: logMAR, logarithm of the minimum angle of resolution; SD-OCT, spectral domain optical coherence tomography.
also shows the baseline CSMTs, 12-month CSMTs, and change in CSMTs as a function of baseline SD-OCT ischemia grades. There was no trend in baseline CSMT as a function of ischemia grade (P=0.1901, Kruskal–Wallis test). For the 12-month CSMT, a trend was suggested with a more severe ischemia grade at baseline associated with a thicker 12-month CSMT, but the result did not reach statistical significance (P=0.0931, Kruskal–Wallis test). For the 12-month change in CSMT, no trend relative to baseline ischemia was present (P=0.4822, Kruskal–Wallis test).
Although the prevalence of an RAPD at baseline increased with increasing baseline ischemia grade, the association did not reach statistical significance (P=0.4096, likelihood ratio test). There was no trend in the 12-month rate of development of ASNV with baseline ischemia grade (P=0.9040, likelihood ratio test).
The presence or absence of a p-MLM sign was determined from the baseline SD-OCTs, and the correlation of the baseline ischemia grade was determined (). The proportion of eyes with the p-MLM sign did not vary significantly with respect to the baseline ischemia grade (P=0.8738, likelihood ratio test). Similarly, the presence or absence of a PAMM sign was determined from the baseline SD-OCTs and the correlation of the baseline ischemia grade was determined (). The proportion of eyes with a PAMM sign was significantly greater in the eyes with severe ischemia (P=0.0493, likelihood ratio test). There was no significant association between having a p-MLM sign and a PAMM sign (; P=0.2051, Fisher’s exact test). In some eyes, the SD-OCT signs of ischemia evolved. The PAMM sign occurred earlier and the p-MLM sign occurred later ().
Figure 6 Graphs of the relationships of three SD-OCT signs to each other.
Abbreviations: PAMM, paracentral acute middle maculopathy; p-MLM, prominent middle-limiting membrane; SD-OCT, spectral domain optical coherence tomography.
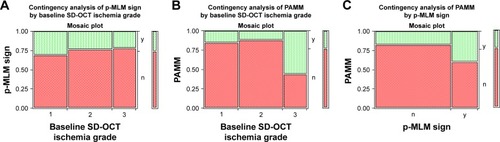
Figure 7 Evolution of SD-OCT signs of ischemia over time.
Abbreviations: INL, inner nuclear layer; PAMM, paracentral acute middle maculopathy; p-MLM, prominent middle-limiting membrane; SD-OCT, spectral domain optical coherence tomography.
The numbers of interventions used in treating the eyes for macular edema and ASNV during the 12 months of follow-up are shown in . There was no difference in the number of interventions of any type across the grades of baseline ischemia.
Table 3 Number of interventions over 12 months in acute central retinal vein occlusion
Discussion
CRVO causes a higher resistance to blood flow through the retina. As the grade of the occlusion increases, flow begins to diminish and oxygenation of the inner retina is impaired, a situation termed ischemia. Whereas, earlier work placed this pathophysiologic phenomenon into two categories – nonischemic and ischemic, a more recent refinement of the concept emphasizes continuous gradation as reflected in the concentration of VEGF in the extracellular fluid of the retina and indirectly in the vitreous.
Clinically, assessing ischemia is important to determine the risk of subsequently developing ASNV and NVG. The clinical assessment is the basis for advising the patient on a follow-up schedule: when the risk is high, follow-up intervals are shorter. All previous methods for assessing ischemia, including VA, visual field, FA, RAPD, and global ERG, have been found to have too many false negatives to excuse the clinician from frequent follow-up. Compounding the problem is the tendency of CRVOs with lesser ischemia to evolve into CRVOs of greater ischemia. In the era of classifying CRVOs as nonischemic and ischemic, the conversion rate was estimated to be 16% in 4 months and 34% in 3 years.Citation8
With the advent of SD-OCT, 3 groups have described SD-OCT signs of ischemia in acute CRVO, but data on prognostic accuracy of these signs for later ASNV have been published for only one (the p-MLM sign), and the interrelationships of the signs have not been explored.
We found that none of the signs was reliably predictive of later ASNV, and that the signs did not reliably correlate with each other or with other signs such as baseline VA or presence of RAPD. We did not measure global ERG or FA routinely, and have no data to report on correlations with those testing modalities. Fluorescein angiographic indices of capillary nonperfusion are beset with problems of intergrader variability and subjectivity.Citation9,Citation10 In one study, combined intra-grader and intergrader replicate coefficients of variation were 21.2% for CRVO.Citation9 The prognostic accuracy of global ERG has likewise been poor, and it has not been widely adopted in the workup of patients with CRVO.
Our data showed no correlation of any intervention for macular edema with baseline ischemia grade. Treatment of macular edema with anti-VEGF injections was as common in eyes with mild ischemia as it was in eyes with severe ischemia. The frequent injection of anti-VEGF drugs not only treated the macular edema but also probably masked any underlying associations of ASNV and NVG with baseline ischemia. It is known that anti-VEGF drugs reduce the levels of intravitreal VEGF and reduce rates of enlargement of areas of capillary nonperfusion.Citation11 The area of retinal nonperfusion can increase with reduction in frequency of anti-VEGF drug injection; the possibility should stimulate continued vigilance and slow tapering in frequency of follow-up.
Others have also described inner nuclear layer and superficial outer plexiform layer hyperreflectivity along the paramacular retinal venules in ostensibly nonischemic CRVO, terming the phenomenon patchy ischemic retinal whitening,Citation12 perivenular retinal whitening,Citation13 and paramacular acute middle maculopathy.Citation5 Schröder et al described inner retinal atrophy in eyes with CRVO and poor VA following the resolution of baseline macular edema.Citation14 Ebneter et al have developed a mouse model that simulates the clinical correlations that we have described. In acute CRVO in the mouse, the OCT changes are described as follows: “Hyperreflectivity with washed-out retinal structures and thickening of the retina are observed within the first few days”. Subsequently, the inner retina thins and becomes hypocellular.Citation15 We witnessed cases in which PAMM, p-MLM, and inner retinal layer hyperreflectivity were seen in isolation, together in pairs, or all present simultaneously in different regions. In addition, PAMM can evolve over time into p-MLM. Further study will be needed to understand how these manifestations of ischemia in CRVO are related spatially within the macula and longitudinally over time. OCT angiography has the potential to provide further insight into retinal ischemia in CRVO, but is also limited by the blocking properties of intraretinal hemorrhage and the technical limitations of scanning the retinal periphery.Citation16
Conclusion
In summary, no single clinical or ancillary test sign has proven to be reliable for assessing ischemia in acute CRVO. This may in part reflect the subjectivity in grading, and may reflect the fact that ischemia in CRVO is dynamic. We suggest that increased reflectivity of the inner retina in acute CRVO provides evidence that inner retinal oxygenation is inadequate to maintain metabolic homeostasis and normal retinal transparency. It does not imply that retinal atrophy is inevitable as witnessed by cases having increased inner retinal reflectivity that subsequently go on to recover definition of the retinal layers later. The SD-OCT signs of inner retinal ischemia in acute CRVO help the clinician understand the pathophysiology, but cannot substitute for frequent follow-up in the first year until the risk of ASNV falls enough that intervals can be lengthened. Even though SD-OCT is an excellent imaging technique in patients with acute CRVO, our results indicate that there is still no reliable imaging characteristic on baseline SD-OCT that prognosticates subsequent neovascular outcomes.
Disclosure
The authors report no conflicts of interest in this work.
References
- HayrehSSPodhajskyPAZimmermanMBNatural history of visual outcome in central retinal vein occlusionOphthalmology2011118111913320723991
- ServaisGEThompsonHSHayrehSSRelative afferent pupillary defect in central retinal vein occlusionOphthalmology19869333013032422618
- SabatesRHiroseTMcMeelJWElectroretinography in the prognosis and classification of central retinal vein occlusionArch Ophthalmol198310122322356824467
- KoJKwonOWByeonSHOptical coherence tomography predicts visual outcome in acute central retinal vein occlusionRetina20143461132114124378425
- RahimyESarrafDDollinMPitcherJDHoACParacentral acute middle maculopathy in nonischemic central retinal vein occlusionAm J Ophthalmol2014158237238024794089
- BrowningDJRetinal Vein Occlusions. Evidence Based ManagementNew York, NYSpringer2012366
- BlandJMAltmanDGStatistical methods for assessing agreement between two methods of clinical measurementLancet1986184763073102868172
- The Central Vein Occlusion Study GroupBaseline and early natural history reportArch Ophthalmol19931118108710957688950
- TsuiIWilliamsBKJrKokYOHeilweilGSchwartzSDReliability of ischemic index grading in common retinal vascular diseasesOphthalmic Surg Lasers Imaging Retina201546661862526114841
- WelchJCAugsburgerJJAssessment of angiographic retinal capillary nonperfusion in central retinal vein occlusionAm J Ophthalmol198710367617663591875
- MirTAKeraniSHafizGChanges in retinal nonperfusion associated with suppression of vascular endothelial growth factor in retinal vein occlusionOphthalmology2016123362563426712560
- BrowningDJPatchy ischemic retinal whitening in acute central retinal vein occlusionOphthalmology2002109112154215912414432
- PaquesMGaudricAPerivenular macular whitening during acute central retinal vein occlusionArch Ophthalmol2003121101488149114557193
- SchröderKAckermannPBrachertMBairovSGeerlingGGuthoffRDoes OCT morphology provide indications for prognosis of VA after venous occlusion?: SD-OCT analysis in retinal vein occlusion before and after resolution of initial macular edemaOphthalmologe2016113651027240635
- EbneterAAgcaCDysliCZinkernagelMSInvestigation of retinal morphology alterations using spectral domain optical coherence tomography in a mouse model of retinal branch and central retinal vein occlusionPLoS One201510e011904625775456
- KimuraMNozakiMYoshidaMOguraYWide-field optical coherence tomography angiography using extended field imaging technique to evaluate nonperfusion area in retinal vein occlusionClin Ophthalmol2016101291129527471374