
Abstract
Purpose
To evaluate early changes in multifocal electroretinogram (mfERG) and subclinical aqueous humor flare and cellularity in patients receiving hydroxychloroquine (HCQ) as treatment for rheumatoid arthritis.
Methods
Ten patients receiving treatment with HCQ and no ophthalmic symptoms were enrolled. After complete ocular examination, mfERG and laser flare-cell photometry were performed. Patients were also divided into two subgroups with HCQ cumulative dose (CD) higher or lower than 500 g. Results obtained were compared with a control group of ten healthy subjects and statistical analysis was performed.
Results
In patients receiving HCQ treatment, mfERG P1-wave in ring 2 showed a significant reduction in amplitude and a significant increase in latency compared to healthy control subjects, respectively resulting in 1.143 μV vs 1.316 μV (P=0.040) and 38.611 ms vs 36.334 ms (P=0.024). These changes are highly related to CD. Furthermore, when using the laser flare-cell photometry, a significant increase in aqueous humor flare and cellularity was shown in patients with CD higher than 500 g, resulting in a mean value of 14.4 ph/ms compared to 8.1 ph/ms in patients with CD lower than 500 g (P=0.0029). These reports appear highly related to CD (P=0.001). Receiver operating characteristic curve analysis showed mfERG P1-wave amplitude in ring 2 as the most sensitive value in detecting early HCQ-related retinopathy.
Conclusion
MfERG was shown to be a very sensitive test in detecting early retinal toxicity and should be used for the screening of patients receiving HCQ treatment. Although less sensitive, laser flare-cell photometry can provide further information to evaluate early toxic retinal cell damage.
Introduction
Rheumatoid arthritis (RA) is a chronic inflammatory disease characterized by joint swelling, weakness, fragility, and progressive synovial membrane damage, leading to a high degree of disability. The disease evolution is not easily predictable and, if not promptly and adequately treated, can cause severe worsening in joint mobility and function, leading to various levels of disability, significant reduction in quality of life, and increased mortality.Citation1–Citation5
RA etiopathogenesis is still only partially known. Nowadays it seems possible that chronic inflammation localized in joint tissues can be the result of autoimmune reactions that firstly affects synovial tissue, and then may extend to cartilage and bone tissues.Citation6,Citation7
For a prompt and correct diagnosis, currently we refer to American College of Rheumatology – European League Against Rheumatism classification criteria. They suggest starting a pharmacological treatment based on disease-modifying anti-rheumatic drugs (DMARDs) as soon as possible.Citation8
Currently, hydroxychloroquine (HCQ) represents the most commonly used molecule, mainly because of its lower toxicity compared to chloroquine (CQ).Citation9 Nevertheless, it can also have harmful effects on retinal pigment epithelium (RPE) cells, and consequently on photoreceptor cells.Citation10
This occurs most frequently in prolonged use because of the characteristic dose-dependent relationship of toxic retinopathy,Citation11,Citation12 and early identification is very important because a progression in retinal damage is possible even after therapy discontinuation.Citation12 American Academy of Ophthalmology (AAO) recommends the following examinations as follow-up for patients taking HCQ: 10-2 pattern automated visual field analysis, spectral-domain optical coherence tomography (SD-OCT), fundus autofluorescence (FAF), and multifocal electroretinogram (mfERG).Citation12
Sensitivity of these diagnostic tests in detecting any early sign of retinal toxicity is still under discussion, but in the last years mfERG has been increasingly gaining evidence as a very sensitive objective test.Citation13
Following these evaluations, we set out to evaluate mfERG and subclinical aqueous humor flare and cellularity using a laser flare-cell meter in a group of patients taking HCQ for treatment of RA.
Materials and methods
The current study was approved by the Local Ethics Committee of the University of Bologna and adhered to the tenets of the Declaration of Helsinki. Written informed consent was obtained from all participants before any procedure.
Ten patients (seven females and three males; mean age 64.8±11.7 years) with a diagnosis of RA followed-up in the outpatient Rheumatology Service of Sant’Orsola-Malpighi University Hospital of Bologna and receiving treatment with HCQ (Plaquenil, Sanofi S.p.A., Milano, Italy) at a dose of 400 mg per day, were enrolled in this study.
Average treatment time was 46.7±15.2 months, with mean cumulative dose (CD) of 625.6±167.44 g. There were no patient complaints of any visual or ophthalmic symptoms. All patients underwent a comprehensive ophthalmological examination including best-corrected visual acuity for distant and near vision, intraocular pressure measurement with Goldmann applanation tonometry, anterior segment slit lamp biomicroscopy (Haag-Streit BM 900, Haag-Streit, Koeniz, Switzerland), posterior segment slit lamp indirect ophthalmoscopy conducted with Volk +78D non-contact lens (Volk Optical Inc., Mentor, OH, USA), SD-OCT and FAF (Spectralis HRA-OCT, Heidelberg Engineering, Heidelberg, Germany), and 10-2 pattern automated visual field analysis (Humphrey 640, Carl Zeiss Meditec AG, Jena, Germany).
After that, since previous examinations yielded results within normal limits, we extended the evaluation performing mfERG to evaluate retinal sensitivity and laser flare-cell photometry to assess aqueous humor subclinical flare and cellularity.
mfERG was recorded using Retimax Plus (CSO, Firenze, Italy) with the following technique. After pupillary dilation with 1% tropicamide eye drops and corneal topical anesthesia with 0.4% oxybuprocaine hydrochloride eye drops, ERG HK-Loop electrodes were applied on the inferior conjunctival fornix with ground and reference electrodes positioned on forehead and temporal regions respectively. Electrical impedance was less than 5 kOhm for all electrodes. mfERG was recorded monocularly using a 61-hexagon stimulus according to International Society for the Clinical Electrophysiology of Vision guidelines,Citation14 with 21 inches video stimulating display (CRT monitor, 75 Hz frame rate, cut-offs 10–100 Hz), subtending 30° on either side of fixation. The room light was on during stimulation and the screen-patient distance was 28 cm. The radius of the central hexagon was 2° and a red central-fixation cross 2 mm in diameter was used. During stimulation, each element was either black or white (93% contrast) and mean luminance was 51.8 cd/m2. Mean responses, as assessed by the analysis of five concentric stimulus rings, were passed through a band-pass filter set to 10–300 Hz. The standard measurement for amplitude was the trough-to-peak amplitude measured from the trough of N1-wave to the peak of P1-wave and was expressed in μV, while the standard measurement for timing was the implicit time of P1-wave peak and was expressed in ms.Citation14
Aqueous humor proteins and cells were quantified by a laser flare-cell meter FC-500 (Kowa Company Ltd., Electronics and Optics Division, Tokyo, Japan), which consists of a helium-neon laser beam system and a photomultiplier mounted on a slit lamp biomicroscope, all connected with a computer. The laser scans the aqueous humor across a sampling window (0.3×0.5 mm2) in 0.5 sec using an optical scanner. Light scattered by protein particles and inflammatory cells in the aqueous humor is proportional to their concentration and size, and is detected by a photon-counting multiplier and processed by a computer. Given that cells are larger than proteins, the amount of light scattered by cells is greater than that reflected by fine protein particles. At the end of the measurement, flare is expressed in photon counts per ms (ph/ms). A total of seven measurements were obtained for each eye, the highest and the lowest values were eliminated, and the computer calculated the mean and standard deviation automatically.
Ten healthy patients (eight females and two males; mean age 61.3±10.4 years) were enrolled as control group.
Statistical analysis was performed using MedCalc 12.3.0 statistical program (MedCalc Software, Ostend, Belgium). mfERG values of density, P1-wave amplitude and latency in rings 1, 2, 3, 4, 5 and laser flare-cell photometry values were analyzed applying Mann–Whitney U test and Spearman’s correlation test to assess differences between groups, considering P<0.05 as significant. Furthermore, receiver operating characteristic (ROC) curve and area under the curve (AUC) for mfERG and laser flare-cell photometry were measured to evaluate their sensitivity and specificity in detecting early retinal toxic damage.
Results
Regarding mfERG P1-wave in ring 2, data analysis showed a significant reduction in amplitude values for patients receiving treatment with HCQ compared to control patients, results are respectively 1.143±0.361 μV vs 1.316±0.236 μV (P=0.040) (), also with a significant increase in latency, results are respectively 38.611±2.857 ms vs 36.334±2.212 ms (P=0.024) (). These statistically significant changes in ring 2 amplitude and latency values are highly related to HCQ CD ().
Table 1 Statistical analysis of P1-wave amplitudes in patients treated with hydroxychloroquine vs healthy control subjects
Table 2 Statistical analysis of P1-wave latencies in patients treated with hydroxychloroquine vs healthy control subjects
Table 3 Spearman’s rank correlation analysis for mfERG P1-wave amplitude and latency in ring 2 and anterior chamber laser flare-cell photometry values compared to hydroxychloroquine CD
No statistically significant changes were found regarding mfERG photoreceptor density values ().
Table 4 Statistical analysis of photoreceptor density in patients treated with hydroxychloroquine vs healthy control subjects
Because we had no basal mfERG and laser flare-cell photometry values for these patients, we divided our patients into two subgroups according to the CD to evaluate possible changes correlated with this parameter. The first group presents CDs higher than 500 g (six patients; mean value 740.66±106.39 g), while the second group presents CDs lower than 500 g (four patients; mean value 453±30.6 g).
Analyzing these two subgroups, laser flare-cell photometry values are significantly higher in the group of patients with CD higher than 500 g compared to patients with CD lower than 500 g, results are respectively 14.4±6.3 ph/ms vs 8.1±2.9 ph/ms (P=0.029) (). This increase is found highly related to the CD of the drug (r=0.899; P=0.001) ().
Figure 1 Scatterplot showing correlation between aqueous humor flare photometry values and hydroxychloroquine CD of patients with CD higher than 500 g.
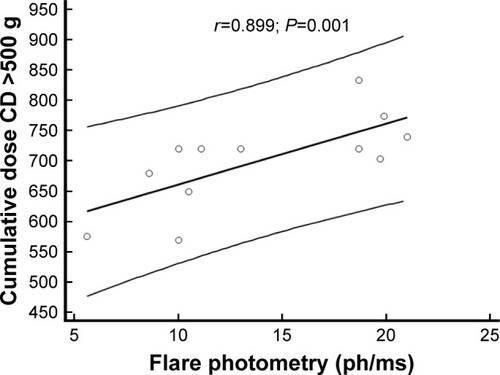
Table 5 Statistical analysis of anterior chamber laser flare-cell photometry values in patients with hydroxychloroquine CD >500 g and <500 g
Furthermore, mfERG data analyzed regarding these two subgroups, show a statistically significant reduction in P1-wave amplitude in ring 2 (0.974±0.261 μV vs 1.396±0.352 μV; P=0.006) () and a statistically significant increase in P1-wave latency in ring 1 (42.332±2.94 ms vs 37.513±3.191 ms; P=0.008) and 2 (40.142±2.442 ms vs 36.314±2.442 ms; P=0.031) in patients with CD higher than 500 g (). This increase in latencies in ring 1 and 2, and this reduction in amplitude in ring 2 is highly related to the increase in laser flare-cell photometry values (for latencies in ring 1: r=0.838, P=0.0007; and in ring 2, r=0.628, P=0.029; for amplitude in ring 2: r=−0.619, P=0.032) ( and –).
Figure 2 Scatterplot showing correlation between aqueous humor flare photometry value and P1-wave latency in ring 1 of patients with hydroxychloroquine CD higher than 500 g.
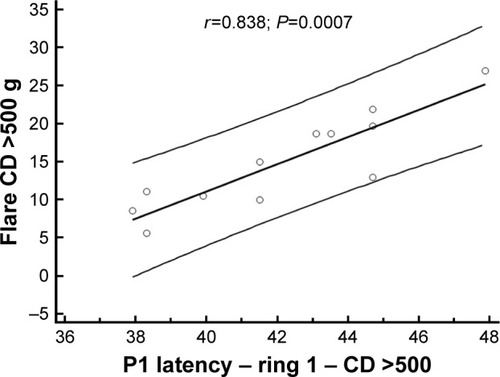
Figure 3 Scatterplot showing correlation between aqueous humor flare photometry value and P1-wave latency in ring 2 of patients with hydroxychloroquine CD higher than 500 g.
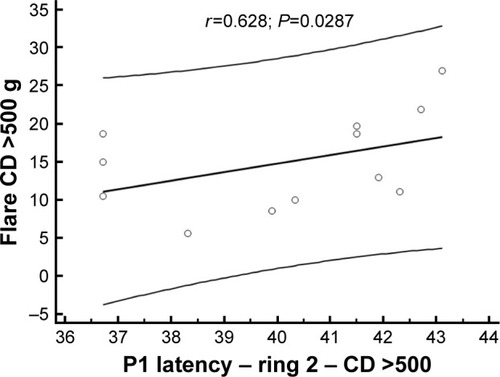
Figure 4 Scatterplot showing correlation between aqueous humor flare photometry value and P1-wave amplitude in ring 2 of patients with hydroxychloroquine CD higher than 500 g.
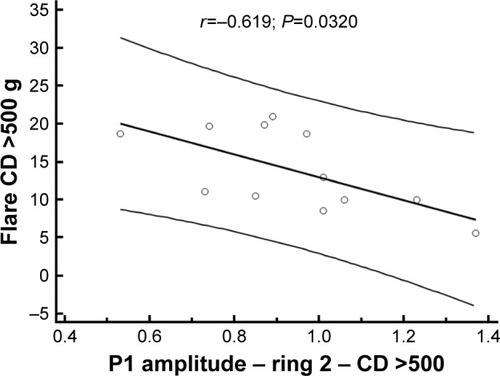
Table 6 Statistical analysis of P1-wave amplitudes in patients with hydroxychloroquine CD >500 g and <500 g
Table 7 Statistical analysis of P1-wave latencies in patients with hydroxychloroquine CD >500 g and <500 g
Table 8 Spearman’s rank correlation analysis for mfERG P1-wave latencies in ring 1 and ring 2 and for amplitude in ring 2 compared to anterior chamber laser flare-cell photometry values in patients with hydroxychloroquine CD >500 g and <500 g
No statistically significant changes were found regarding mfERG photoreceptor density values comparing the two subgroups ().
Table 9 Statistical analysis of photoreceptor density in patients with hydroxychloroquine CD >500 g and <500 g
Finally, ROC curve analysis demonstrates that the most sensitive test in detecting early retinal toxicity was mfERG P1-wave amplitude in ring 2 (AUC =0.931), followed by mfERG P1-wave latency in ring 2 (AUC =0.810), and then laser flare-cell photometry (AUC =0.791) ( and ).
Figure 5 ROC curve analysis showing mfERG P1-wave amplitude as the most sensitive test in detecting hydroxychloroquine toxic retinopathy.
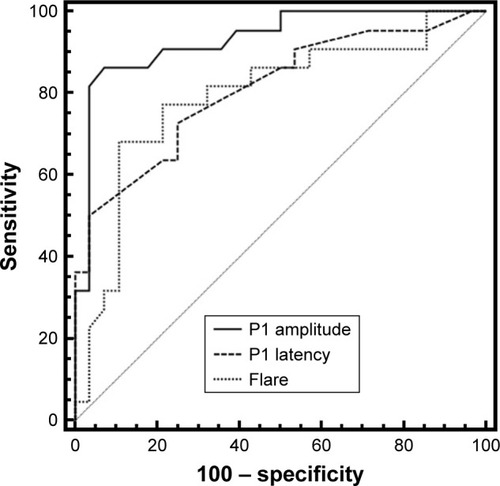
Table 10 ROC curve analysis for test sensitivity
Discussion
HCQ is an anti-malarial drug still commonly used for its anti-inflammatory activity to favorably modulate the clinical course of RA. Its use has been associated with various adverse side effects, particularly progressive toxic retinopathy. Major risk factors for the development of retinopathy seem to be: the duration of treatment (>5 years), a high daily dose (>6.5 mg/Kg), a high CD (>1,000 g), concurrent kidney or liver diseases, and age over 60 years old.Citation15–Citation17
How HCQ and CQ can lead to the development of retinopathy still remains to be elucidated. In vitro experimental studies showed that these molecules could bind to pigmented cells containing melanin, particularly in iris and RPE cells.Citation18
Moreover, HCQ causes the inhibition of some enzymes essential for RPE metabolic function,Citation19 leading to progressive photoreceptor functional damage.Citation16
Recently it has been described that HCQ, in addition to altering RPE function, can also alter blood-retinal barrier (BRB) stabilityCitation20 provoking a marked increase in permeability of ARPE-19 monostratified cells.Citation21 This increase in permeability seems to be related to a subsequent increase in tight junction molecules’ (ZO-1, occludin and claudin) production, which seems to disrupt RPE integrity, regardless of the direct drug action on RPE cells.Citation22,Citation23
Therefore, it is necessary to perform a thorough ophthalmological evaluation and follow these patients up with periodical screening exams, in order to detect any possible damage to photoreceptor function early on.
Actually, the AAO recommends the following screening exams: 10-2 pattern automated visual field analysis, macular SD-OCT, FAF, and mfERG.Citation12
Based on mfERG analysis, our study shows that the most frequent finding in patients treated with HCQ was P1-wave amplitude reduction in ring 2, followed by amplitude reduction in rings 3, 4, and 1 ().
Table 11 Number and percentage of patients with mfERG P1-wave amplitude reduction or latency increase, and corresponding mean percentage changes in these values
These results are consistent with previously reported data in literature, although many authors described mfERG damages as central, paracentral, pericentral, and peripheral, according to the following criteria: ring 1 to the fovea (0°–2°), ring 2 to the parafovea (2°–7°), ring 3 to the perifovea (7°–13°), ring 4 to the near periphery (3°–22°), and ring 5 to the central part of the middle periphery (22.0°–30.5°).Citation24–Citation26
Regarding P1-wave latency, the most frequent finding seems to be an increase in ring 2 followed by an increase in ring 1. These data are consistent with previous reports in the literature,Citation24,Citation27,Citation28 and only one study found an increased latency without reduction in amplitude.Citation29
P1-wave amplitude reduction seems to be an expression of histological and morphological RPE damage,Citation10 while increased P1-wave latency appears to be an inconstant parameter that is not always found in toxic retinopathy.Citation30
Our findings differ from those reported in the literature about damage onset timing, a previous study described damage starting after 5 years of therapy.Citation27
In this study we divided patients into two subgroups depending on whether CD values were higher or lower than 500 g. In the CD >500 g group, we found a significant decrease of P1-wave amplitude in ring 2, and a significant increase in P1-wave latencies in rings 1 and 2. These data appear to differ from reports by other authors,Citation26,Citation27 who assert that HCQ-related damage leads mainly to reduced P1-wave amplitude, and only rarely to an increase in latency in P1-wave analysis.
Finally, ROC curve analysis shows that mfERG sensitivity is extremely high regarding P1-wave amplitude decrease and latency increase, partially confirming previously described findings of some authors,Citation13 who indicate amplitude as the most sensitive value in detecting HCQ toxic retinopathy. We believe that this partial discordance could be ascribed to the different CDs of the drug in our group of patients compared to other clinical records.
Laser flare-cell photometry has rarely been used for the study of patients with RA without any sign of uveal involvement, and not yet in treatment with DMARDs. Nevertheless, a previous study described a significant increase of aqueous humor flare and cellularity values in these patients, compared to healthy control subjects.Citation31
In this study, we found higher laser flare-cell photometry values in the patient group with CD higher than 500 g compared to the patient group with CD lower than 500 g. Also in this case, the increase in flare values seemed to be correlated to higher HCQ CD.
To our knowledge, no previous clinical studies have described this correlation, however, it can be very interesting because we can find various possibilities to explain our results.
Our first hypothesis is that HCQ, binding to melanin in iris pigmented cells, can lead to their disruption, as occurs in RPE cells, with following pigment release in aqueous humor.Citation32
A second interesting hypothesis is that the observed increase in flare values may be due to a breakdown in BRB, as previously reported by some authors using fluorophotometry,Citation20 and caused by the increased permeability of ARPE-19 monostratified pigmented cells. This can be induced by HCQCitation21 not only directly, but also stimulating the production of enzymes such as ZO-1, claudin, and occludin.Citation22,Citation23 Thus, it appears possible to explain the correlation between increased flare values and increased P1-wave latencies in rings 1 and 2 observed in the group of patients with CDs higher than 500 g. Moreover, this BRB breakdown with the increase in circulating ET-1 levels found in patients with RA,Citation33 could justify the significant retinal functional changes localized particularly in ring 2 of mfERG, but also found in ring 3 by other authors.Citation25,Citation30 This could be due to the particular anatomical distribution of bipolar cells in the macular region, which is smaller in the fovea and becomes more dense toward the parafovea and perifovea regions,Citation34 where a proper choroidal blood supply is essential for neuronal function.
Conclusion
In conclusion, we believe that mfERG is a very sensitive test in detecting early retinal dysfunction caused by HCQ toxicity in patients with no ophthalmologic symptoms and normal fundus appearance, visual acuity, and 10-2 pattern automated visual field analysis.
In agreement with AAO recommendations, we suggest that mfERG should be used instead of automated visual field analysis as objective functional test for the screening of patients treated with HCQ.
Future studies on HCQ retinal toxicity with mfERG should be directed at the determination of the earliest point at which mfERG can detect retinopathy. Another interesting future evaluation could be to use laser flare-cell photometry to better understand the importance of vascular permeability deterioration and BRB integrity breakdown in the development of toxic damage.
Acknowledgments
The authors thank Mr Luca Teglia (Orthoptist) who performed the multifocal electroretinograms.
Disclosure
The authors do not have a financial relationship with any organization and declare that there are no conflicts of interest in this work.
References
- ScottDLSymmonsDPCoultonBLPopertAJLong-term outcome of treating rheumatoid arthritis: results after 20 yearsLancet198718542110811112883443
- MitchellDMSpitzPWYoungDYBlochDAMcShaneDJFriesJFSurvival, prognosis, and causes of death in rheumatoid arthritisArthritis Rheum19862967067143718563
- PincusTCallahanLFSaleWGBrooksALPayneLEVaughnWKSevere functional declines, work disability, and increased mortality in seventy-five rheumatoid arthritis patients studied over nine yearsArthritis Rheum19842788648726431998
- IsomäkiHLong-term outcome of rheumatoid arthritisScand J Rheumatol Suppl199295381475632
- WolfeFThe natural history of rheumatoid arthritisJ Rheumatol Suppl19964413228833046
- FiresteinGSEvolving concepts of rheumatoid arthritisNature2003423693735636112748655
- SmolenJSAletahaDKoellerMWeismanMHEmeryPNew therapies for treatment of rheumatoid arthritisLancet200737096021861187417570481
- RadnerHNeogiTSmolenJSAletahaDPerformance of the 2010 ACR/EULAR classification criteria for rheumatoid arthritis: a systematic literature reviewAnn Rheum Dis201473111412323592710
- RainsfordKDParkeALClifford-RashotteMKeanWFTherapy and pharmacological properties of hydroxychloroquine and chloroquine in treatment of systemic lupus erythematosus, rheumatoid arthritis and related diseasesInflammopharmacology201523523126926246395
- MahonGJAndersonHRGardinerTAMcFarlaneSArcherDBStittAWChloroquine causes lysosomal dysfunction in neural retina and RPE: implications for retinopathyCurr Eye Res200428427728415259297
- RütherKFoersterJBerndtSSchroeterJChloroquine/hydroxychloroquine: variability of retinotoxic cumulative dosesOphthalmologe200710410875879 German17653725
- MarmorMFKellnerULaiTYMellesRBMielerWFAmerican Academy of OphthalmologyRecommendations on screening for chloroquine and hydroxychloroquine retinopathy (2016 Revision)Ophthalmology201612361386139426992838
- TsangACAhmadi PirshahidSVirgiliGGottliebCCHamiltonJCouplandSGHydroxychloroquine and chloroquine retinopathy: a systematic review evaluating the multifocal electroretinogram as a screening testOphthalmology201512261239125125824328
- HoodDCBachMBrigellMISCEV standard for clinical multifocal electroretinography (mfERG) (2011 edition)Doc Ophthalmol20121241113
- BernsteinHNOcular safety of hydroxychloroquineAnn Ophthalmol19912382922961952638
- BrowningDJHydroxychloroquine and chloroquine retinopathy: screening for drug toxicityAm J Ophthalmol2002133564965611992862
- MarmorMFCarrREEasterbrookMFarjoAAMielerWFAmerican Academy of OphthalmologyRecommendations on screening for chloroquine and hydroxychloroquine retinopathy: a report by the American Academy of OphthalmologyOphthalmology200210971377138212093666
- BernsteinHNGinsbergJThe pathology of chloroquine retinopathyArch Ophthalmol19647123824514089397
- WrightCISabineJCCholinesterases of human erythrocytes and plasma and their inhibition by antimalarial drugsJ Pharmacol Exp Ther194893223023918865209
- RainesMFBhargavaSKRosenESThe blood-retinal barrier in chloroquine retinopathyInvest Ophthalmol Vis Sci1989308172617312759787
- KorthagenNMBastiaansJvan MeursJCvan BilsenKvan HagenPMDikWAChloroquine and hydroxychloroquine increase retinal pigment epithelial layer permeabilityJ Biochem Mol Toxicol201529729930425752684
- AbeTSuganoESaigoYTamaiMInterleukin-1beta and barrier function of retinal pigment epithelial cells (ARPE-19): aberrant expression of junctional complex moleculesInvest Ophthalmol Vis Sci20034494097410412939333
- YoshikawaTOgataNIzutaHShimazawaMHaraHTakahashiKIncreased expression of tight junctions in ARPE-19 cells under endoplasmic reticulum stressCurr Eye Res201136121153116321978097
- MoschosMMNitodaEChatziralliIPGatzioufasZKoutsandreaCKitsosGAssessment of hydroxychloroquine maculopathy after cessation of treatment: an optical coherence tomography and multifocal electroretinography studyDrug Des Devel Ther2015929932999
- SoSCHedgesTRSchumanJSQuirezaMLEvaluation of hydroxychloroquine retinopathy with multifocal electroretinographyOphthalmic Surg Lasers Imaging200334325125812757106
- MoschosMNMoschosMMApostolopoulosMMalliasJABourosCTheodossiadisGPAssessing hydroxychloroquine toxicity by the multifocal ERGDoc Ophthalmol20041081475315104166
- MaturiRKYuMWeleberRGMultifocal electroretinographic evaluation of long-term hydroxychloroquine usersArch Ophthalmol2004122797398115249360
- LaiTYChanWMLiHLaiRYLamDSMultifocal electroretinographic changes in patients receiving hydroxychloroquine therapyAm J Ophthalmol2005140579480716310457
- AliferisKMermoudCSafranABMultifocal electroretinography in follow-up of patients treated with hydroxychloroquineJ Fr Ophtalmol2011347468475 French21549445
- KellnerURennerABTillackHFundus autofluorescence and mfERG for early detection of retinal alterations in patients using chloroquine/hydroxychloroquineInvest Ophthalmol Vis Sci20064783531353816877425
- CelliniMVersuraPLeonettiPOcular surface and intraocular inflammation are related in SS-I and rheumatoid arthritis patientsRheumatol Int200727985385717297622
- TreseMLiYGaoHQiaoXInflammation exacerbates hydroxychloroquine-induced retinotoxicity in human retinal pigment epithelial cellsInvest Ophthalmol Vis Sci2013546090
- PacheMSchwarzHAKaiserHJElevated plasma endothelin- 1 levels and vascular dysregulation in patients with rheumatoid arthritisMed Sci Monit200289CR616CR61912218941
- MiyakeYFocal macular electroretinographyNagoya J Med Sci1998613–479849879190