
Abstract
Purpose
The purpose of the study was to determine the accuracy of intraocular pressure (IOP) measurement after small incision lenticule extraction (SMILE) using Goldmann applanation tonometry (GAT) and ocular response analyzer (ORA).
Methods
This is a prospective clinical study that was conducted on 30 eyes in the interval between February 2016 and September 2016. The age of the patients ranged between 19 and 40 years. The patients underwent SMILE surgery using the femto laser. IOP was measured preoperatively and 1 month postoperatively by both techniques, the GAT and the ORA.
Results
GAT recorded lower values than ORA values (IOPcc) preoperatively and postoperatively and the difference was statistically significant. Both GAT and ORA IOP measurements decreased after SMILE. There was no statistically significant correlation between the changes in the GAT and ORA readings and the postoperative corneal pachymetry or the lenticule thickness. Both corneal hysteresis and corneal resistance factor showed significant decline after the procedure, which correlated with the lenticule thickness.
Conclusion
SMILE causes significant reduction in IOP measurement by ORA and GAT. Corneal biomechanics decreases following SMILE and this correlates with lenticule thickness.
Introduction
Intraocular pressure (IOP) is an important routine for ophthalmological examination. It is an important risk factor for glaucoma.Citation1 Adequate measurement of IOP is crucial for early diagnosis and management of glaucoma.
Nowadays, refractive surgery became very popular, which affects the central corneal thickness and corneal biomechanics which in turn affect IOP readings measured by using the traditional methods.
Several studies were conducted to assess the ease and accuracy of IOP measurement following refractive surgery especially LASIK. The aim of the current study was to assess the ease and accuracy of IOP measurements before and after small incision lenticule extraction (SMILE) using the Goldmann applanation tonometry (GAT) and the ocular response analyzer (ORA) and the effect of the surgery on corneal biomechanics.
Materials and methods
Study design
This study is a prospective clinical study that was conducted on 30 eyes in the interval between February 2016 and September 2016. Approval was obtained from the Cairo University Hospitals ethical committee to ensure the adherence of the study to the rules of the Helsinki declaration. Patients were divided into 2 groups: Group A including 30 corneas of patients before undergoing femto SMILE surgery and Group B including 30 corneas of the same patients 1 month after femto SMILE surgery.
The study included patients who were candidates for SMILE, aged >18 years, both the sexes are enrolled, with myopic refractive error or myopic astigmatism and with clear corneas. The exclusion criteria included patients with corneal pathology such as scarring and keratoconus and patients with history of previous ocular surgery.
Preoperative assessment
A complete ocular and medical history was obtained, with particular attention paid to the presence of collagen vascular disease, hormonal changes such as pregnancy, previous refractive or other anterior segment surgery, ocular injuries, and vitreoretinal surgery or disease. Medications and allergies were also noted. Written informed consent was obtained after detailed instruction and discussion. Soft contact lens wearers were required to leave their lenses out for 1 week.
All patients underwent the following tests before surgery: slit lamp exam, measurement of best corrected visual acuity (BCVA), manifest refraction, assessment of cornea using Pentacam (Pentacam®, Oculus, Wetzlar, Germany) and ocular response analyzer (ORA) (model 30 classic, software version 2.0; Reichert, New York, NY, USA), measurement of central corneal thickness (CCT, Pachymetry) by Pentacam (Pentacam®, Oculus), measurement of IOP using applanation tonometry (Goldmann tonometer; Haag-Streit, Koeniz, Switzerland), and ORA (Reichert Ophthalmic Instrument, Inc., Buffalo, NY, USA).
Surgical technique
The surgery was performed bilaterally and under topical anesthesia using three drops of Topical Benoxinate (Benoxinate hydrochloride 0.4%) 2–3 min before surgery.
A VisuMax 500-kHz femtosecond laser (Carl Zeiss Meditec AG, Jena, Germany) was used for SMILE treatment. First, the back of the intrastromal lenticule was created by photodisruption from the periphery to the center, followed by the creation of the lenticule front from the center to the periphery and an incision tunnel located at 11 o’clock. The lenticule diameter was 6.5 mm and the cap diameter was 7.5 mm. The incision length was 2.0–2.5 mm. The intended cap thickness was 100–110 μm. After laser treatment, a thin blunt spatula was inserted through the incision site to break the remaining tissue bridges and loosen the stromal lenticule, which was pulled out using McPherson forceps and removed. After the removal of the lenticule, the stromal pocket was flushed with saline.
Postoperative assessment
In addition to routine assessment, pachymetry and IOP were re-evaluated 1 month after performing the refractive surgery using the same devices. Although the full preoperative assessment was performed by a single assistant, the postoperative assessment was carried out by a different person to ensure that the study is properly blinded.
Statistical analysis
Data were coded and entered using the statistical package SPSS version 23 and were summarized using mean and standard deviation or median and interquartile range according to their distribution whether normal or nonparametric. Shapiro Wilk was used for testing normality of distribution in each parameter. Comparisons between paired measurements in each patient were done using paired t-test or the nonparametric Wilcoxon signed rank test. Comparisons between unpaired measurements in each patient were done using unpaired t-test or the nonparametric Mann–Whitney U test. Correlations between quantitative variables were done using Pearson correlation coefficient or Spearman correlation coefficient. P-values <0.05 were considered as statistically significant. No statistical correction was performed for including both the eyes of same patients.
Results
This study included 30 eyes of 15 patients with age ranging from 19 to 40 years who underwent femto SMILE procedure, and 53.3% of them were male.
Patients’ demographics, preoperative and postoperative pachymetry, and IOP values are summarized in . The preoperative IOP measured by ORA was significantly higher than that measured by GAT (P=0.007) and the comparison was done using the nonparametric Mann–Whitney U test ().
Figure 1 Comparison between GAT pre and IOPcc pre.
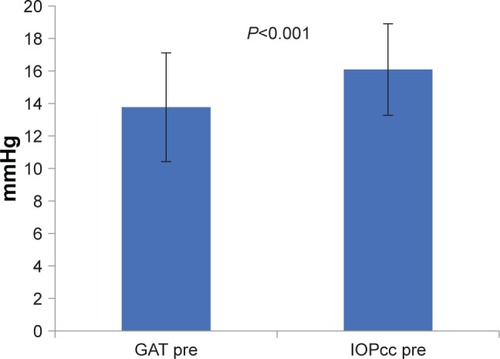
Table 1 Demographics and pre- and postoperative IOP values
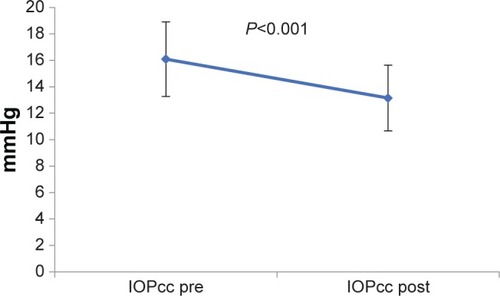
Spearman correlation coefficient shows significant positive correlation between the preoperative GAT and the preoperative CCT (P=0.011). However, no significant correlation was found between the preoperative IOP measured by ORA and CCT (). The postoperative IOP was found to be significantly lower than the preoperative values when measured by both GAT and the ORA (IOPcc). The change between the preoperative and postoperative readings (Delta change or Δ change) was higher in the GAT readings than the ORA readings ( and ).
Figure 2 Correlation between the preoperative IOP measurement by GAT and preoperative CCT.
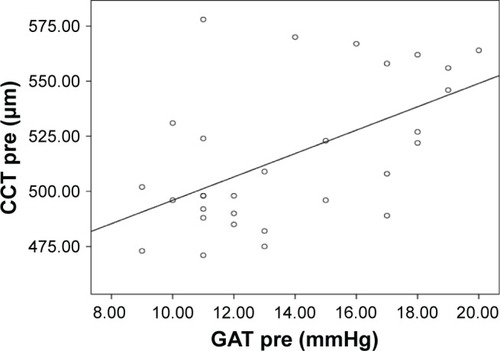
Figure 3 Comparison between preoperative and postoperative GAT measurements.
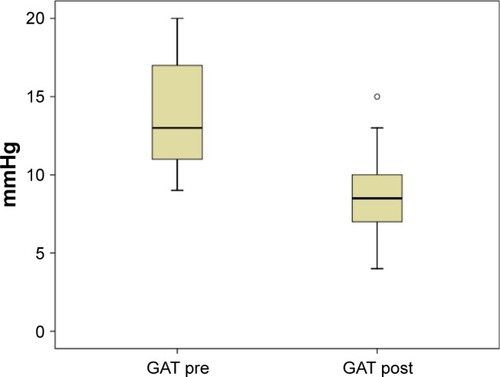
Figure 4 Comparison between pre and postoperative ORA measurements.
Comparison was done using paired t-test showing statistically significant difference between the postoperative IOP readings by both GAT and ORA (P<0.001) with lower IOP readings by GAT (). Using Spearman correlation coefficient, no significant correlation was found between the degree of decline of the postoperative IOP readings by both methods and the postoperative pachymetry and the lenticule thickness or the postoperative CCT (–).
Figure 5 Graph showing comparison between postoperative intraocular measurement by GAT and ORA.
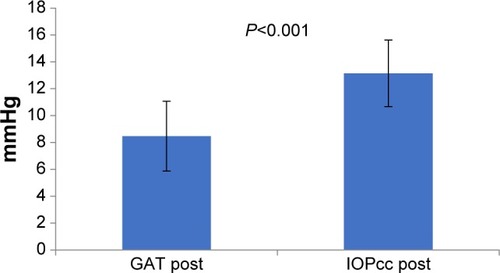
Figure 6 Correlation between CCT post and ΔGAT.
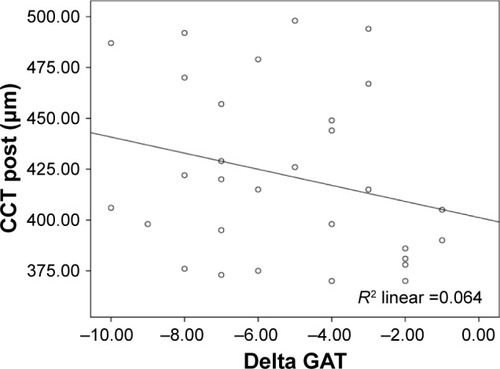
Figure 7 Correlation between CCT post and ΔIOPcc.
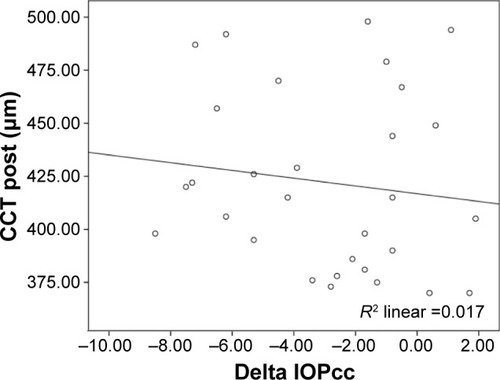
Figure 8 Correlation between the lenticule thickness and ΔGAT.
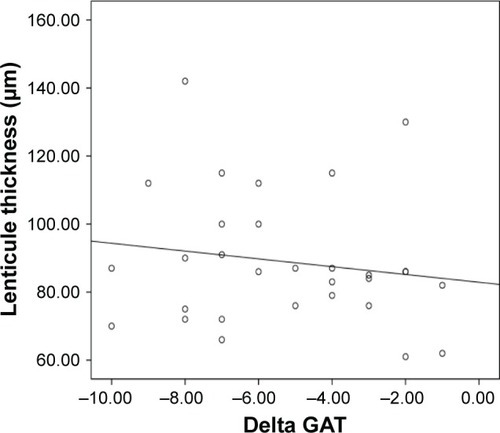
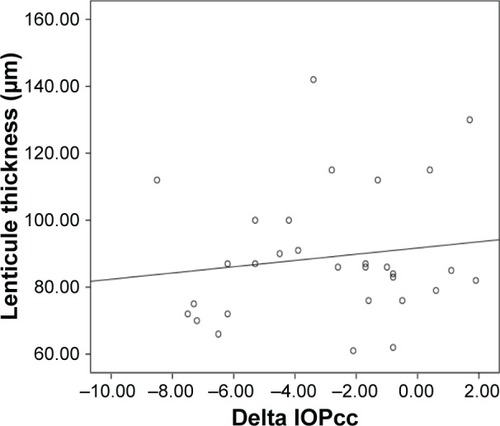
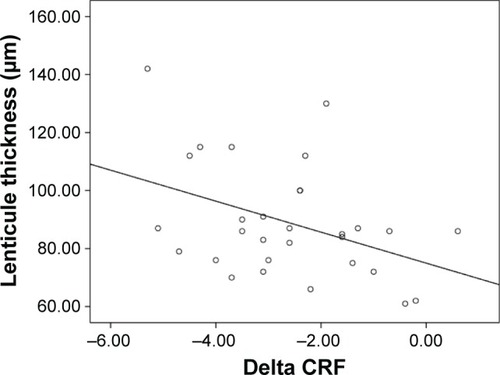
Figure 9 Correlation between the lenticule thickness and ΔIOPcc.
It was found that both corneal hysteresis (CH) and corneal resistance factor (CRF) show significant decline after the procedure, and this decline was directly proportionate to the lenticule thickness (–).
Figure 10 Comparison between pre and postoperative corneal hysteresis.
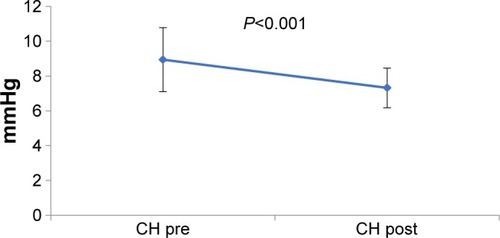
Figure 11 Comparison between the pre and postoperative CRF.
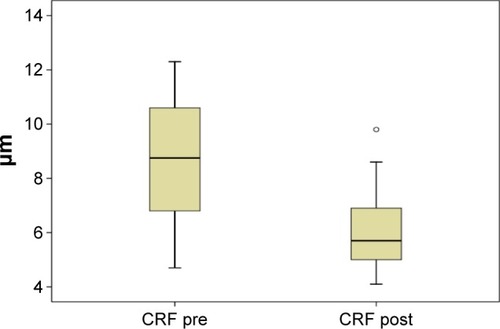
Figure 12 Correlation between the change in the corneal hysteresis (CH) and the lenticule size.
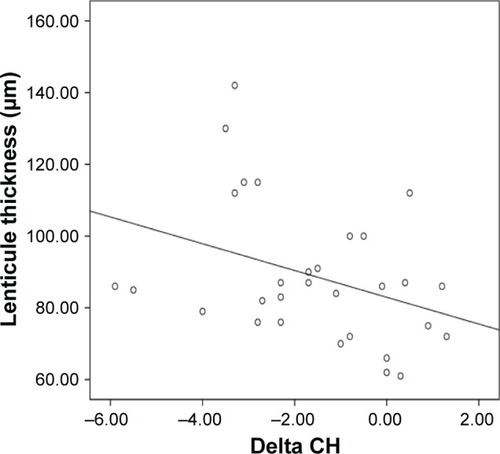
Figure 13 Correlation between the change in the corneal resistance factor (CRF) and the lenticule size.
Discussion
Corneal refractive surgery, such as femtosecond laser-assisted laser in situ keratomileusis (FS-LASIK) and small incision lenticule extraction (SMILE), has emerged as having good efficacy, predictability, safety, and stability for surgical correction of low, moderate, and high myopia.Citation2–Citation4
However, CCT, corneal curvature, and corneal biomechanics change after corneal refractive surgery, which may affect IOP measurements.Citation5 This prospective clinical study demonstrated that refractive surgery causes significant lowering of IOP measured using Goldmann applanation tonometry (GAT) and ORA.
Significant positive linear correlation was found between the preoperative measurement of the IOP by GAT and ORA (P=0.007, r=0.71) with ORA readings usually higher than GAT readings. In addition, significant positive linear correlation was found between the preoperative GAT and CCT (P=0.011, r=0.457). However, no significant correlation was found between the preoperative ORA measurement and CCT.
The results of previous studies are consistent with the finding of the present study which shows a strong correlation between GAT and CCT.Citation6–Citation8 However, Vandewalle et al found that IOP readings from Icare are in accordance with those from GAT, whereas CCT readings correspond well to (Goldmann correlated) ORA measurements and that there was no correlation between the IOP measurements and CCT for the four instruments.Citation9
This study also found statistically significant decline in the postoperative (IOP) measurements by both GAT and ORA (P<0.001). The decline in IOP was more in GAT when compared with ORA. The change in the GAT was (−5.30±2.67 mmHg) whereas the change in the ORA was (−2.93±2.97 mmHg).
Also, there is statistically significant decline in both CH and CRF (with P=0.001). The change in CH was (−1.6±1.87 mmHg) and the change in the CRF was (−2.62±1.49 mmHg).
These results coincide with Dou et al who found that IOPg as measured by the ORA, IOPcc, CH, and CRF decreased greatly in both SMILE and LASEK groups after surgery (P<0.05). However, an increase was observed in CH values 3 months after surgery.Citation10
Pedersen et al who evaluated corneal biomechanical properties after LASIK, ReLEx flex, and ReLEx SMILE by Scheimpflug-based dynamic tonometry (Corvis ST, Wetzlar, Germany) and ORA found that CH and CRF were significantly lower after all keratorefractive procedures compared to healthy controls (P<0.05).Citation11
This study found no significant relation between ΔGAT, ΔIOPcc, and the lenticule thickness (P>0.05). This implies that the decrease in IOP readings cannot be predicted when the lenticule thickness is known, which is dependent on the refraction.
Significant correlation was found between ΔCH, ΔCRF, and the lenticule thickness (r=−0.376, P=0.04 and r=−0.41, P=0.025, respectively). The ΔCH/LT in this study was (−0.018±0.01) and the ΔCRF/LT was (−0.029±0.01).
Duo et al found that ΔCRF/LT and ΔCH/LT after SMILE were lower than the ΔCRF/AD and ΔCH/AD in the LASEK group, which meant that per unit of tissue removal, the decreases in CRF and CH are smaller in the SMILE group than in the LASEK group. This may be due to that after SMILE, most of the collagen fiber connections from the epithelium to the superior location of ablation, the Bowman layer, and the stiffer anterior stroma were preserved.Citation10
Li et al found that ΔIOPg/AD and ΔIOPcc/AD in FS-LASIK were higher than ΔIOPg/LT and ΔIOPcc/LT in SMILE at the 6-month follow-up and ΔCRF and ΔCH per removed or ablated tissue in FS-LASIK were higher than in SMILE.Citation12 Wu et al found a noticeable decrease in the biomechanical parameters after both SMILE and FS-LASIK. After SMILE, corneal biomechanical parameter values were stable with no progressive deterioration during the 6-month follow-up. There was a positive recovery in CH 3 months and 6 months after surgery. The same recovery was not observed after FS-LASIK during the postoperative follow-up.Citation13
Disclosure
The authors report no conflicts of interest in this work.
References
- KassMAHeuerDKHigginbothamEJThe Ocular Hypertension Treatment Study: a randomized trial determines that topical ocular hypotensive medication delays or prevents the onset of primary open-angle glaucomaArch Ophthalmol200212070171312049574
- LeeJKChuckRSParkCYFemtosecond laser refractive surgery: small-incision lenticule extraction vs. femtosecond laser-assisted LASIKCurr Opin Ophthalmol201526426026426058022
- VestergaardAIvarsenARAspSSmall-incision lenticule extraction for moderate to high myopia: predictability, safety, and patient satisfactionJ Cataract Refract Surg201238112003201022981612
- ReinsteinDZCarpGIArcherTJGobbeMOutcomes of small incision lenticule extraction (SMILE) in low myopiaJ Refract Surg2014301281281825437479
- ChengACFanDTangELamDSEffect of corneal curvature and corneal thickness on the assessment of intraocular pressure using non-contact tonometry in patients after myopic LASIK surgeryCornea2006251262816331036
- CarbonaroFAndrewTMackeyDASpectorTDHammondCJComparison of three methods of intraocular pressure measurement and their relation to central corneal thicknessEye20102471165117020150923
- OncelBDincUAOrgeFYalvacBIComparison of IOP measurement by ocular response analyzer, dynamic contour, Goldmann applanation, and noncontact tonometryEur J Ophthalmol200919693619882585
- ShoushaSMAAbo SteitMAHosnyMHEwaisWAShalabyAMComparison of different intraocular pressure measurement techniques in normal eyes, post surface and post lamellar refractive surgeryClin Ophthalmol20137717923326186
- VandewalleEVandenbroeckSStalmansIZeyenTComparison of ICare, dynamic contour tonometer, and ocular response analyzer with Goldmann applanation tonometer in patients with glaucomaEur J Ophthalmol20091978378919787598
- DouRWangYXuLComparison of corneal biomechanical characteristics after surface ablation refractive surgery and novel lamellar refractive surgeryCornea201534111441144626226471
- PedersenIBBak-NielsenSVestergaardAHIvarsenAHjortdalJCorneal biomechanical properties after LASIK, ReLEx flex, and ReLEx smile by Scheimpflug-based dynamic tonometryGraefes Arch Clin Exp Ophthalmol201425281329133524862302
- LiHWangYDouRIntraocular pressure changes and relationship with corneal biomechanics after SMILE and FS-LASIKInvest Ophthalmol Vis Sci201657104180418627548888
- WuDWangYZhangLCorneal biomechanical effects: small-incision lenticule extraction versus femtosecond laser-assisted laser in situ keratomileusisJ Cataract Refract Surg201440695496224751146