Abstract
Objective
The aim of this article is to characterize pathomorphologic changes within particular layers of fluorescein angiographically ‘ischemic’ compared to ‘nonischemic’ retina in patients with diabetic retinopathy.
Methods
Cross-sectional images of ischemic retinal areas were obtained using Heidelberg Spectralis optical coherence tomography (OCT). Presumed retinal ischemia was defined as focal hypofluorescence in early or early and late phase fluorescein angiography. Pathomorphologic changes on OCT were evaluated and the thickness of retinal layers measured and compared with nonischemic retina at corresponding topographic locations in a matched-pairs design based on 22 eyes (mean age 64 ± 14).
Results
In all eyes, based on spectral domain-OCT cross-section images, the retina layers in ischemic retinal areas could be segmented. Total retinal thickness was significantly increased in ischemic compared to nonischemic areas (381 ± 94 μm versus 323 ± 89 μm, P = 0.005). Middle retinal layers (inner nuclear layer, outer plexiform layer, and outer nuclear layer) were significantly thickened in retinal ischemic areas (215 ± 82 μm versus 168 ± 62 μm, P = 0.002). The inner retinal layers (retinal nerve fiber layer, ganglion cell layer, and inner plexiform layer) showed a nonsignificant change (117 ± 53 μm versus 98 ± 30 μm), while the outer layers were slightly thinned (photoreceptors plus retinal pigment epithelium layer; 51 ± 9 μm versus 57 ± 8 μm, P = 0.02) in ischemic versus nonischemic retina.
Conclusions
Ischemic diabetic retina seems to be thickened due to thickening of, in particular, middle retinal layers, which can be measured with high-resolution OCT.
Introduction
Diabetic retinopathy (DR) as an ocular manifestation of diabetes mellitus with its rapidly increasing prevalence is one of the leading causes for blindness in industrialized countries. Citation1 Usually, DR starts as a mild nonproliferative form, continues to develop first into a severe nonproliferative, and finally into a proliferative form of the disease. Accumulation of toxic sorbitol and metabolized end products of the glycosylation process leads to microangiopathic changes of the retinal vessels which then in turn cause exudation, edema, hypoxia, and formation of new vessels on retinal level. The basic treatment of DR is to control blood sugar levels and blood pressure followed by focal or panretinal laser photocoagulation or pharmacologic treatments such as intravitreal anti-vascular endothelial growth factor as specific ophthalmological therapies to slow down the process of progression of the disease.
Rapidly evolving and improving imaging techniques have made it possible to characterize the phenotype and pathologic changes of the retina. Using a noninvasive optical coherence tomography (OCT) technique, it is possible to detect retinal changes such as macular edema or ischemia and depict them as progression parameters.Citation2–Citation4 Prior studies using OCT showed the possibility to image pathologic changes of particular retinal layers of patients or animal models with degenerative macular diseaseCitation5 and ischemic retinopathy.Citation6,Citation7
The aim of this study was to identify ischemic retinal areas of patients with DR using fluorescein angiography (FA) and characterize pathophysiologic changes in particular retinal layers within these areas compared to nonischemic retina using the noninvasive spectral domain-OCT (SD-OCT) technique.
Methods
Patients
A total of 22 eyes from 16 consecutive patients undergoing FA and SD-OCT (HRA-OCT, Heidelberg Engineering, Heidelberg, Germany) at the same day for the evaluation of DR at the Department of Ophthalmology, Ludwig Maximilian University, Munich, were included in this study. In total, 12 Caucasian men and 4 women with a mean age of 64 ± 14 (range 27–82 years) were included. All had known diabetes mellitus for at least 3 years, with the majority of patients (n = 14) having diagnosed type 2 diabetes. All patients had nonproliferative DR. Objective refraction was mean +0.69 ± 1.91 sphere (minimum −4.25, maximum +4.0 D) and −1.06 ± 0.51 cylinder, while all cylinder was ≤2 D. Inclusion criteria were diagnosed diabetes and a mild or severe nonproliferative or proliferative DR with an ischemic area seen in FA located within major temporal blood vessels and at a distance of at least 500 μm from the fovea. Exclusion criteria were previous laser treatment in scanned and analyzed ischemic area, degenerative disorders of the posterior pole, or significant media opacities. In all patients, a full ophthalmological examination was performed, and both FA and SD-OCT were carried out after informed consent. All research was conducted in accordance with institutional guidelines and board approval and conformed to the tenets of the World Medical Association Declaration of Helsinki.
Procedures
A commercially available HRA-OCT (Heidelberg Engineering) model was used for FA and SD-OCT examination. Wavelengths of HRA for FA and SD-OCT are 488 and 870 nm, respectively. Optical resolution is ~3.8 μm axial and 6 μm lateral (high resolution mode). Acquisition speed for SD-OCT is 40,000 A-scans/sec. The scan depth is 1.9 mm.
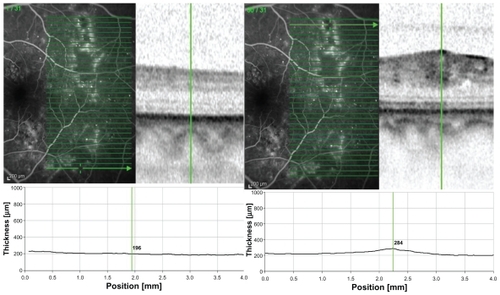
FA was obtained for each study eye to determine the extent of the ischemic area being localized within major temporal retinal blood vessels. An ischemic area was defined as circumscribed hypofluorescence in early or early and late phase FA. A nonischemic area in corresponding topographic location (ie, mirrored around a horizontal axis through the optic nerve) was chosen as reference in each study eye. If more than one ischemic area was imaged, the selected area was chosen such that it was corresponding to the nonischemic area and the most distant to the macular center. By applying this selection rule, we could identify corresponding ischemic and nonischemic areas in all cases. An SD-OCT volume scan (using automatic real-time eye-tracking: average frame number, 9) of the macula covering the ischemic and corresponding nonischemic areas within one scan was performed for each eye to visualize specific retinal layers and measure their thickness in micrometers ().
Figure 1 A) Heidelberg Spectralis optical coherence tomography image showing the retinal thickness (located superior temporally within major blood vessels) along the scan in micrometers with the marker located in ischemic retina of a left eye. B) Retinal thickness of the same eye in micrometers along the scan with the marker located in nonischemic retina at corresponding topographic location (which was selected to be ‘mirrored’ around a horizontal axis through the optic nerve).
Measurements
Thickness of the whole retina and its singular layers displayed at SD-OCT cross-section images were measured by one person using ImageJ software (NIH, Bethesda, MD; see http://rsb.info.nih.gov/ij/disclaimer.html) to warrant repeatability and to allow for measurements of nonperpendicular pictured retina. Measurements of ischemic retina were taken from the center of the affected area and analogous from the control area.
Retinal layers were segmented into three layers ():
Figure 2 SD-OCT scan through nonischemic extrafoveal retina with different hyper-reflective bands representing the anatomical retinal layers of the retina.
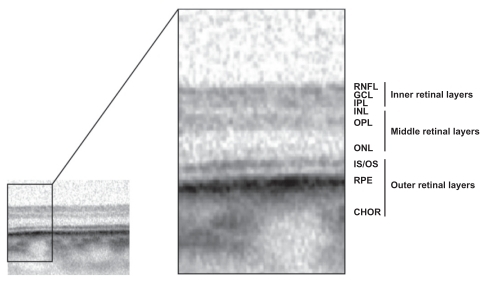
Inner retinal layers: including retinal nerve fiber layer (RNFL), ganglion cell layer (GCL), and inner plexiform layer (IPL)
Middle retinal layers including: inner nuclear layer (INL), outer plexiform layer (OPL)
Outer retinal layers including: outer nuclear layer (ONL), the retinal pigment epithelium layer (RPE) and the inner choriocapillaris.
Statistical analysis
Data were collected and analyzed using SPSS software (version 17.0; SPSS Inc., Chicago, IL). A P value of <0.05 was considered as statistically significant. Univariate analyses were applied, and paired testing (n = 22) and nonparametrical methods were chosen, for example, Wilcoxon testing for paired differences.
Results
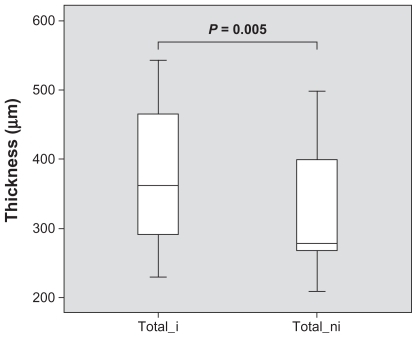
The obtained SD-OCT cross-section images of the retina allowed segmentation into the anatomical retinal layers in all 22 cases in both fluorescein angiographic ischemic and the control area. Overall, mean retinal thickness in ischemic retina was 381 ± 94 μm compared to a mean retinal thickness of 323 ± 89 μm of corresponding nonischemic retina (P = 0.005; Wilcoxon). This means that ischemic retina – nonischemic retina showed a mean retinal thickening of 59 ± 82 μm with a 95% confidence interval from 22 to 95 μm. illustrates those findings.
Figure 3 Mean retinal thickness in micrometers with standard deviation at ischemic (total_i) and nonischemic (total_ni) retina. Ischemic retina is significantly (P = 0.005) thickened compared to nonischemic retina.
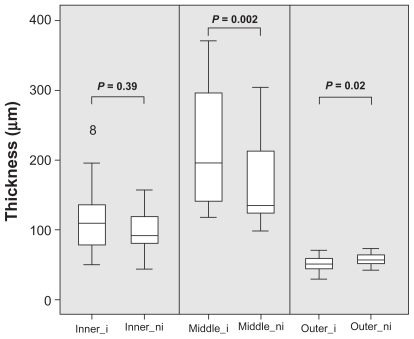
Middle retinal layers (INL, OPL, and ONL) in ischemic retinal areas revealed a thickness of 215 ± 82 μm compared to 168 ± 62 μm in nonischemic retina (P = 0.002; Wilcoxon). This means a mean retinal thickening of 47 ± 67 μm with a 95% confidence interval from 17 to 76 μm (see ). Looking at the inner layers (RNFL, GCL, and IPL) of ischemic retina, the SD-OCT measurements revealed a thickness of 117 ± 53 μm compared to 98 ± 30 μm of nonischemic retina (P = 0.39). The outer retinal layers (photoreceptors and RPE) in ischemic retinal areas showed a slightly reduced thickness of 51 ± 9 μm compared to 57 ± 8 μm in nonischemic retina (P = 0.02).
Figure 4 Mean thickness, in micrometers, of ischemic (inner_i) and nonischemic (inner_ni) inner retinal layers, ischemic (middle_i) and nonischemic (middle_ni) middle retinal layers, and ischemic (outer_i) and nonischemic (outer_ni) outer retinal layers. Data exceeding the 25 and 75 percentiles are shown as single rings. Of note, ischemic middle retinal layers are significantly thickened compared to nonischemic middle retinal layers.
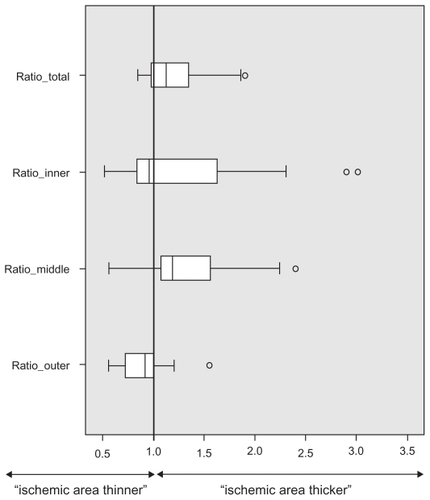
To account for the different distances of the measured ischemic areas toward the macula center, in addition, we calculated individual relative thickness: ischemic/nonischemic retinal thickness (). A value of ‘1’ thus corresponds to equal retinal thickening, while values >1 indicate thickening and <1 thinning of the fluorescein angiographic ischemic area. This analysis confirms the overall thickening and in particularly thickening of the middle retinal layers, as shown with absolute numbers in and .
Figure 5 Relative thickness of ischemic/nonischemic retina for total retina (Ratio_total) and the inner (Ratio_inner), middle (Ratio_outer), and outer (Ratio_outer) retinal layers. Data exceeding the 25 and 75 percentiles are shown as single rings.
Discussion
High-resolution OCT imaging allows for measurement of the thickness of segmented retinal layers in ischemic retinal areas. Hypofluorescent areas with mainly hyperfluorescent surroundings seen in FA in patients with DR were defined as ischemic areas. In this study, we were able to demonstrate a thickening of ischemic retina caused by thickening of, in particular, middle retinal layers in patients with DR. By measuring ischemic areas and comparing with nonischemic areas at corresponding location of the same subject, we tried to exclude variables such as gender, ethnicity, age, and refraction that usually affect retinal thickness and thus could bias the results of measurements comparing different individuals.Citation8–Citation11
Besides glaucoma diagnosis, pathologic thickness alterations regarding inner retinal layers can be seen in rare hereditary retinopathies.Citation12,Citation13 Vascular pathologies of the retina can also modify the thickness of inner retinal layers such as central or branch retinal artery occlusion with an initial thickening and a final thinning of the inner retinal layers or ischemic maculopathy in diabetic patients with a detectable atrophy of the foveal GCL.Citation6,Citation14,Citation15 Other studies indicate an additional neurodegenerative component in DR by observing a reduced thickness of inner retinal layers in preclinical DR.Citation16 Similar results were found in ischemic maculopathy in a recent study.Citation15
Our measurements indicate a slight nonsignificant thickening rather than thinning of the inner retinal layers in angiographically apparent ischemic DR. Of note, our segmentation included IPL, which was measured together with GCL and RNFL and could account for the different results. Another possible explanation for our results could be an edematous swelling of the nonfoveal GCL prior to atrophic damage caused by ischemia. In our study, we also measured a slightly reduced thickness of the outer retinal layers in ischemic areas, which are in line with previously published reports on patients with no clinical evidence of DR, where the photoreceptor layer was found to be significantly reduced, which could be interpreted as an early damage to the neurosensory retina due to diabetic microangiopathy.Citation17
Most clearly, in our study, we observed thickening of the middle retinal layers (INL, OPL, and ONL). Of note, retinal pathologies such as diffuse macular edema, cystoid macular edema, or exudates are found to occur in the middle retinal layers and are responsible for retinal thickening and hence need to be treated, for example, with laser photocoagulation.Citation18,Citation19 However, by defining hypofluorescent areas seen in FA as ischemic retina, we did not differentiate between ischemic retina and hypofluorescence due to edema. The observed thickening may, therefore, be caused by accumulation of extracellular fluid from a leaking venous system approximating the underperfused areas which was observed in FA as hyperfluorescent surroundings (see ) and may be masking other intracellular changes such as retinal ischemia or even atrophy.
Another possibility to explain our observations on a more molecular basis is that fluid accumulates intracellularly in ischemic retinal areas and thus leads to cellular swelling with consecutive retinal thickening. In contrast, in type 1 diabetic patients with no or minimal retinal changes, retinal thinning was observed indicating chronic neurodegenerative damage before DR could evolve.Citation20,Citation21 Our findings of thickened ischemic retina due to primarily thickened middle retinal layers in patients with DR suggest an edematous process as a possible stage before advanced irreversible atrophic changes occur. Further studies are needed to investigate the importance of fluorescein angiographic ischemic areas for staging DR and to test for its reversibility.
Disclosure
The authors do not have any commercial interest in any of the materials and methods used in this study. The authors have no competing interest to declare in this work.
References
- US Centers for Disease Control and PreventionNational Diabetes Fact Sheet: General Information and National Estimates on Diabetes in the United States, 2005Atlanta, GACenters for Disease Control and Prevention2005
- KookDWolfAKreutzerTLong-term effect of intravitreal bevacizumab (avastin) in patients with chronic diffuse diabetic macular edemaRetina20082881053106018779710
- ChungEJRohMIKwonOWKohHJEffects of macular ischemia on the outcome of intravitreal bevacizumab therapy for diabetic macular edemaRetina200828795796318698297
- GoebelWKretzchmar-GrossTRetinal thickness in diabetic retinopathy: a study using optical coherence tomography (OCT)Retina200222675976712476103
- FleckensteinMCharbel IssaPHelbHMHigh-resolution spectral domain-OCT imaging in geographic atrophy associated with age-related macular degenerationInvest Ophthalmol Vis Sci20084994137414418487363
- AsefzadehBNinyoKLongitudinal analysis of retinal changes after branch retinal artery occlusion using optical coherence tomographyOptometry2008792858918215797
- ShoKTakahashiKFukuchiTMatsumuraMQuantitative evaluation of ischemia-reperfusion injury by optical coherence tomography in the rat retinaJpn J Ophthalmol200549210911315838726
- RauscherFMSekhonNFeuerWJBudenzDLMyopia affects retinal nerve fiber layer measurements as determined by optical coherence tomographyJ Glaucoma200918750150519745664
- NeuvilleJMBronson-CastainKBearseMAJrOCT reveals regional differences in macular thickness with ageOptom Vis Sci2009867E810E81619525884
- ParikhRSParikhSRSekharGCPrabakaranSBabuJGThomasRNormal age-related decay of retinal nerve fiber layer thicknessOphthalmology2007114592192617467529
- BudenzDLAndersonDRVarmaRDeterminants of normal retinal nerve fiber layer thickness measured by Stratus OCTOphthalmology200711461046105217210181
- SaviniGBarboniPValentinoMLRetinal nerve fiber layer evaluation by optical coherence tomography in unaffected carriers with Leber’s hereditary optic neuropathy mutationsOphthalmology2005112112713115629832
- ItoYNakamuraMYamakoshiTLinJYatsuyaHTerasakiHReduction of inner retinal thickness in patients with autosomal dominant optic atrophy associated with OPA1 mutationsInvest Ophthalmol Vis Sci20074894079408617724190
- FalkenberrySMIpMSBlodiBAGuntherJBOptical coherence tomography findings in central retinal artery occlusionOphthalmic Surg Lasers Imaging200637650250517152548
- ByeonSHChuYKLeeHLeeSYKwonOWFoveal ganglion cell layer damage in ischemic diabetic maculopathy: correlation of optical coherence tomographic and anatomic changesOphthalmology20091161019491959e819699533
- PengPHLinHSLinSNerve fibre layer thinning in patients with preclinical retinopathyCan J Ophthalmol200944441742219606163
- VermaARaniPKRamanRIs neuronal dysfunction an early sign of diabetic retinopathy? Microperimetry and spectral domain optical coherence tomography (SD-OCT) study in individuals with diabetes, but no diabetic retinopathyEye (Lond)20092391824183019648899
- DeakGGBolzMKriechbaumKEffect of retinal photocoagulation on intraretinal lipid exudates in diabetic macular edema documented by optical coherence tomographyOphthalmology2010117477377920079541
- BarkmeierAJNicholsonBPAkdumanLEffectiveness of laser photocoagulation in clinically significant macular edema with focal versus diffuse parafoveal thickening on optical coherence tomographyOphthalmic Surg Lasers Imaging200940547247919772271
- van DijkHWKokPHGarvinMSelective loss of inner retinal layer thickness in type 1 diabetic patients with minimal diabetic retinopathyInvest Ophthalmol Vis Sci20095073404340919151397
- AsefzadehBFischBMParenteauCECavalleranoAAMacular thickness and systemic markers for diabetes in individuals with no or mild diabetic retinopathyClin Experiment Ophthalmol200836545546318925914