Abstract
Purpose
The aim of this article is to investigate the effect of transcorneal electrical stimulation (TES) on chorioretinal blood flow in healthy human subjects.
Methods
The chorioretinal blood flow of 10 healthy subjects was measured before and after TES by laser speckle flowgraphy and expressed as the square blur rate (SBR). The chorioretinal blood flow was determined before and immediately after TES and 0.5, 1, 1.5, 2, 2.5, 3, 24, and 40 h after TES in three different areas: the margin of the optic disc, a point located midway between the optic disc and macula, and the macula area. The SBR of the stimulated eye is expressed relative to the value of the fellow eye. The mean standardized blur ratio was calculated as the ratio of the standardized SBR to the baseline SBR. The changes of intraocular pressure (IOP), blood pressure (BP), and pulse rate (PR) were determined after each measurement of the SBR. The ocular perfusion pressure (OPP) was calculated from BP and IOP.
Results
The mean standardized blur ratio at the optic disc did not change significantly throughout the course of the experiment. However, the mean standardized blur ratio midway between the optic disc and macula and at the macula area were significantly higher after TES than that after sham stimulation at 3 and 24 h (P < 0.05, P < 0.01, respectively). At all times, the mean BP, PR, IOP, and OPP were not significantly different from the prestimulation values.
Conclusions
TES increases the chorioretinal blood flow in normal subjects with minimal effects on the systemic blood circulation and the IOP. The increase in chorioretinal blood flow may be one of the beneficial effects that TES has on ischemic retinal diseases.
Introduction
Electrical stimulation has been used to treat various neurological disorders and has been reported to have beneficial effects on the functional recovery of the upper limbs after a stroke and to relieve chronic tinnitus and hyperalgesia.Citation1–Citation3 For the eye, several recent studies have shown that transcorneal electrical stimulation (TES), a noninvasive method to activate the retina, improved the visual function of patients with traumatic optic neuropathy, anterior ischemic optic neuropathy (AION), and retinal artery occlusions (RAOs).Citation4,Citation5 One of the mechanisms suggested to explain the neuroprotective effects of TES was an upregulation of neurotrophic factors by Müller cells.Citation6–Citation8
It has also been reported that TES increased the cerebral blood flow by activating the trigeminal nerve which innervates the middle cerebral artery in rats.Citation9 Low-voltage electrical stimulation also increased the blood flow in the ischemic tibialis muscle of rats.Citation10 Thus, TES may increase chorioretinal blood flow and improve the visual impairment induced by ischemic insults. However, it has not been determined how the chorioretinal blood flow is changed after TES.
Thus, the purpose of this study was to determine whether the chorioretinal blood flow is changed by TES in normal human subjects. To accomplish this, we used laser speckle flowgraphy (LSFG) to measure the chorioretinal blood flow before and after TES. We shall show that TES of the eye led to an increase in the chorioretinal blood flow.
Materials and methods
Subjects
The subjects were 10 healthy male volunteers without any systemic or ophthalmic diseases. The Institutional Review Board of Hyogo College of Medicine approved the procedures to be used and also the consent forms to be signed by the volunteers. These procedures conformed to the tenets of the Declaration of Helsinki. All of the subjects were fully informed of the purpose of the study, and all signed an informed consent form.
The age of the subjects ranged from 26 to 37 years, and their refractive errors ranged from −10 to +1 diopters (D). To dilate the pupils, 0.4% tropicamide (Mydrin Ms; Santen, Osaka, Japan) was instilled into both eyes.
TES
TES was performed according to a protocol that has been presented in detail.Citation4 In brief, the cornea was anesthetized with 0.4% oxybuprocaine hydrochloride and covered with 3% hyaluronic acid to prevent injury of the corneal surface. A Burian-Allen (B-A) contact lens electrode (Hansen Ophthalmic Laboratories, Iowa City, IA) was placed on the cornea. Biphasic pulses at 20 Hz frequency and up to 150 μA, which evoked phosphenes in both the central and peripheral visual fields, were applied through the two concentric electrodes embedded in the contact lens. The electrical pulses were obtained from an electronic waveform generator (SEN 8203; Nihon Koden, Tokyo, Japan) and delivered to the eye through a stimulus isolation unit (A385R; WPI, Sarasota, FL). The stimulation lasted for 30 min. The sham stimulation consisted of placing the electrode on the cornea for 30 min without delivering electrical stimulation. After TES or sham stimulation, the stimulated eyes were examined by slit-lamp microscopy to determine whether any injury had occurred.
Chorioretinal blood flow measurements by LSFG
The principle and method of LSFG have been described in detail.Citation11,Citation12 The measurement system consisted of a fundus camera (TRC-WT3; Topcon, Tokyo, Japan) equipped with a diode laser (wavelength 808 nm). The laser beam illuminated the retina, and the reflected scattered laser light was seen as a speckle pattern.
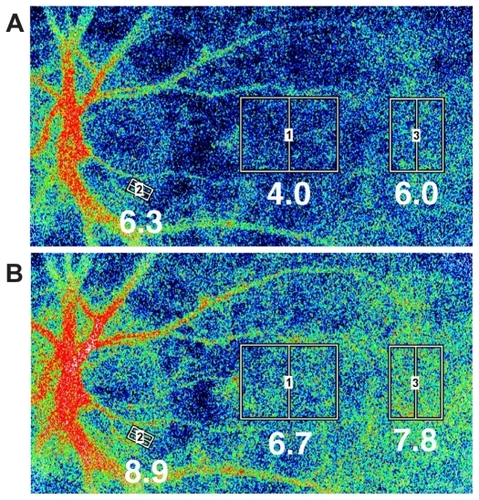
The normalized blur (NB) value is an approximate reciprocal of the speckle contrast which is related to the interference pattern produced when laser light is scattered by the retina and choroid. The NB value was originally regarded as a quantitative index of tissue blood velocity, but the relative changes of the NB value have been shown to be highly correlated with tissue blood flow measured by the hydrogen clearance method. Citation12 The square blur rate (SBR) is another index obtained from the NB and is better correlated with the blood flow than the NB.Citation13 The chorioretinal blood flow was measured with the LSFG before and after the TES. The blood flow was measured immediately after the TES and at 0.5, 1, 1.5, 2, 2.5, 3, 24, and 40 h after the TES. Measurements were performed at three different retinal areas: the margin of the optic disc in an area without vessels and cupping, a point midway between the optic disc and the macula whose size was 1/3 optic disc diameter (ODD) × 1/2 (ODD), and a parafoveal area which was 1/4 ODD from the midway point and a size of 1/2 midway size (). The area and location of the measurement points were the same throughout the experiment. (Position was controlled by NAVI analysis software, version 3; Softcare, Fukuoka, Japan). The blood flow was measured three to five times at each point. To minimize the effect of diurnal changes on the chorioretinal blood flow, the SBR values were expressed relative to that of fellow eye. The standardized blur ratio was calculated as the ratio of the standardized SBR at each time divided by the baseline SBR. To assess the reproducibility of the measurements by the LSFG, the coefficient of variation (%CV) of the standardized SBR was calculated for each measurement point.
Figure 1 Representative images of the chorioretinal blood flow taken by a LSFG instrument with a SBR. A) Before TES. Squares were positioned in three different areas: the rim of the optic disc flanked by two branched vessels crossing the margin of optic disc. This area was selected so that there were no blood vessels. The other two areas were a point midway between the optic disc and macula and the macula area. The macula area was identified by the region without retinal vessels. B) Twenty-four hours after TES. The averaged SBR values within the square for each measurement are indicated below the square. The color map of chorioretinal blood flow shows an increase of blood flow after TES. In all areas, the chorioretinal blood flow was increased, especially in the midway point.
Measurement of blood pressure and intraocular pressure
The brachial blood pressure (BP) and pulse rate (PR) were measured by an automated sphygmomanometer (JENTOW- 7700 [CS]; Nippon Colin, Komaki, Japan) before the TES and 0.5, 3, 24, and 40 h after the TES. The mean blood pressure (MBP) was calculated as MBP = BPd + 1/3(BPs − BPd), where BPd is the diastolic blood pressure, and BPs is the systolic blood pressure. The ocular perfusion pressure (OPP) was calculated as OPP = 2/3(MBP − intraocular pressure [IOP]).
The IOP was measured with a Goldmann applanation tonometer before TES and after each measurement of the SBR.
Statistical analyses
One-way or two-way repeated measures ANOVA followed by unpaired t-tests were used for the statistical analyses of the mean standardized ratio and all other parameters. P < 0.05 was considered to be statistically significant.
Results
All of the volunteers reported seeing phosphenes in the central and peripheral fields with currents >150 μA (data not shown), and the currents eliciting the phosphenes were comparable to those reported.Citation14 No corneal or other ocular complications occurred at the end of the experiment in all volunteers.
In the sham stimulation group (n = 4), the mean standardized blur ratio did not change significantly throughout the experiments in all three areas (data not shown). In the TES group (n = 6), the mean standardized blur ratio changed significantly at both the point midway between the optic disc and macula and at the macula area ( and ). The mean ratio at the midway point was significantly increased immediately and at 3 and 24 h after the TES. The mean ratio then decreased to the level of sham stimulation at 40 h ( and ). Similarly, the mean ratio in the macula area was significantly increased at 3 and 24 h after TES ( and ). At the optic disc, there were no significant differences between the TES and sham stimulation ( and ). The mean ratio in the macular area gradually increased from 3 h after TES and remained high compared to sham stimulation at 40 h (). The mean standardized blur ratio in the TES group was 1.40 ± 0.14 (3 h) and 1.53 ± 0.11 (24 h), which were significantly higher than that of the sham stimulation group, 0.98 ± 0.05 (3 h) and 0.86 ± 0.04 (24 h; P < 0.05 and P < 0.01).
Figure 2 Changes of the mean standardized blur ratio in volunteers with (n = 6) or without (n = 4) TES (mean ± SEM). Dash lines indicate the TES group and solid lines the sham stimulation group. A) In optic disc area, there were no significant differences between the sham stimulation and TES at any times. B) However, for the point located midway between the optic disc and macula, the mean standardized blur ratio was significantly increased at immediate, 3, and 24 h after TES. C) Similarly in the macula area, the mean standardized blur ratio was significantly increased at 3 and 24 h after TES.
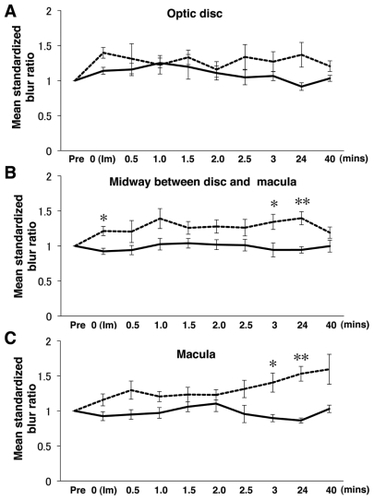
Table 1 Time course of standardized blur ratio after TES in optic disc and macula
To examine the reproducibility of LSFG, the CV of the values of the midway point was calculated at each time after the TES and sham stimulation. The CV in the sham stimulation group was 13% ± 4.2% and that in the TES groups was 12% ± 7.3% for prestimulation. The CV immediately after stimulation was 19% ± 8.7% in the sham group and 13% ± 6.7% in the TES group. Later, the CVs in the sham stimulation were 13% ± 6.8% (0.5 h), 18% ± 12% (1 h), 20% ± 12% (1.5 h), 20% ± 7.8% (2.0 h), 23% ± 3.8% (2.5 h), 13% ± 1.5% (3.0 h), 8.0% ± 6.0% (24 h), and 19% ± 7.6% (40 h). CVs in the TES group were 9.2% ± 6.4% (0.5 h), 10% ± 5.2% (1 h), 8.0% ± 4.6% (1.5 h), 12% ± 6.7% (2.0 h), 17% ± 12% (2.5 h), 5.6% ± 6.1% (3.0 h), 10% ± 7.1% (24 h), and 6.3% ± 3.9% (40 h). In most of time points except for 3.0 and 40 h, there were no significant differences between sham stimulation and TES (one-way ANOVA). At both 3 and 40 h, the CVs in the sham stimulation group were higher than that of TES group (3 h, P < 0.05; 40 h, P < 0.01). As a result, the measurements by LSFG in sham stimulation group varied widely at specific time points.
To determine whether the TES affected the systemic circulation and IOPs, we measured the BPd, BPs, PR, and IOP after each LSFG measurement. At all measurement times, the values of the MBP, PR, and IOP did not change significantly in both the TES and sham groups. In addition, the OPP did not change significantly after TES (two-way repeated measure ANOVA) ().
Table 2 Changes of ocular and systemic parameters in the subjects with TES or sham stimulation
Discussion
Our results showed that single application of TES induced a gradual and sustained increase of chorioretinal blood flow in the midway between optic disc and macula and macula area with a relatively rapid increase at 30 min, then peaked at 24 h, and gradually decreased by 40 h after the TES.
The mechanism of how TES leads to an increase of chorioretinal blood flow has still not been determined. Earlier studies have shown that low-voltage electrical stimulation to skeletal muscles increases the blood flow in the muscle, which was accompanied by an upregulation of vascular endothelial growth factors (VEGF).Citation10,Citation15 It has also been reported that electrical stimulation relaxes the rat aorta which was mediated by nitrous oxide synthase (NOS) in the vascular smooth muscle.Citation16
Our observations suggest that it is likely that the electrical stimulation led to a dilation of the blood vessels, and the dilation may have been mediated by NOS and/or VEGF expression. Our results showed that the chorioretinal blood flow after TES increased gradually, suggesting that it was probably not neurally mediated. The slow and lasting increase suggests that some molecules, which are responsible for the increase of blood flow, are synthesized and released by the ocular tissues. Considering this possibility and the results of earlier studies,Citation10,Citation15,Citation16 TES may stimulate the synthesis of some molecules from the retinal or choroidal tissues during the 24 h when the chorioretinal blood flow increased.
In the retina, Müller cells maintain the homeostasis of the retinal extracellular environment, for example, the ions, water, neurotransmitter molecules, and pH. Müller cells can also regulate the retinal blood flow by synthesizing and releasing growth factors.Citation17 Two studies have reported that the expression of insulin-like growth factors (IGF-1) is upregulated in Müller cells after TES.Citation6,Citation8 It has also been found that IGF-1 affects the vasodilation that is NOS-dependent in coronary, mesenteric, and skeletal muscle arteries.Citation18–Citation22 Taken together, the increase of chorioretinal blood flow after TES is consistent with an upregulation of IGF-1 by activated Müller cells, but this mechanism needs to be confirmed in future studies.
There are several limitations of this study. First, the exact time when the increase in the chorioretinal blood flow occurred and when the blood flow returned to the prestimulation level were not determined. Different experimental conditions would be necessary to determine this. However, we did find that the rate had already increased just after the end of TES, and it continued to increase for at least 24 h. Second, LSFG can detect the changes in the chorioretinal blood flow, but it does not reflect the real volume of ocular blood flow. Thus, further experiments will be needed using other strategies, for example, by laser Doppler flowmetry. In addition, these observations were made in normal subjects, and it was not determined whether eyes with ischemic diseases will have the same pattern. Further studies are being planned to resolve these questions.
In conclusion, TES increases the chorioretinal blood flow for at least 24 h without affecting the systemic circulation. This increase of chorioretinal blood flow may be one of the factors that contribute to the visual improvement found in patients with RAO or AION after TES. Because no adverse effects were found after TES, we recommend that TES be tried in other ocular diseases related to ischemic changes.
Acknowledgments
We thank Professor Duco Hamasaki, Bascom Palmer Eye Institute, University of Miami School of Medicine, for editing this manuscript.
Disclosure
We report no conflicts of interest in this work.
References
- KleinjungTSteffensTLonderoALangguthBTranscranial magnetic stimulation (TMS) for treatment of chronic tinnitus: clinical effectsProg Brain Res200716635936717956800
- DeSantanaJMWalshDMVanceCRakelBASlukaKAEffectiveness of transcutaneous electrical nerve stimulation for treatment of hyperalgesia and painCurr Rheumatol Rep200810649249919007541
- PlowEBCareyJRNudoRJPascual-LeoneAInvasive cortical stimulation to promote recovery of function after stroke: a critical appraisalStroke20094051926193119359643
- FujikadoTMorimotoTMatsushitaKShimojoHOkawaYTanoYEffect of transcorneal electrical stimulation in patients with nonarteritic ischemic optic neuropathy or traumatic optic neuropathyJpn J Ophthalmol200650326627316767383
- InomataKShinodaKOhdeHTranscorneal electrical stimulation of retina to treat longstanding retinal artery occlusionGraefes Arch Clin Exp Ophthalmol2007245121773178017593383
- MorimotoTMiyoshiTMatsudaSTanoYFujikadoTFukudaYTranscorneal electrical stimulation rescues axotomized retinal ganglion cells by activating endogenous retinal IGF-1 systemInvest Ophthalmol Vis Sci20054662147215515914636
- SatoTFujikadoTLeeTSTanoYDirect effect of electrical stimulation on induction of brain-derived neurotrophic factor from cultured retinal Müller cellsInvest Ophthalmol Vis Sci200849104641464618539944
- SatoTFujikadoTMorimotoTMatsushitaKHaradaTTanoYEffect of electrical stimulation on IGF-1 transcription by L-type calcium channels in cultured retinal Müller cellsJpn J Ophthalmol200852321722318661273
- AtalayBBolayHDalkaraTSoylemezogluFOgeKOzcanOETranscorneal stimulation of trigeminal nerve afferents to increase cerebral blood flow in rats with cerebral vasospasm: a noninvasive method to activate the trigeminovascular reflexJ Neurosurg20029751179118312450041
- KannoSOdaNAbeMEstablishment of a simple and practical procedure applicable to therapeutic angiogenesisCirculation199999202682268710338463
- TamakiYAraieMKawamotoEEguchiSFujiiHNoncontact, twodimensional measurement of retinal microcirculation using laser speckle phenomenonInvest Ophthalmol Vis Sci19943511382538347928179
- SugiyamaTUtsumiTAzumaIFujiiHMeasurement of optic nerve head circulation: comparison of laser speckle and hydrogen clearance methodsJpn J Ophthalmol19964033393438988423
- AraieMIn vivo measurement of ocular circulation with the laser speckle method–development of apparatus and application in ophthalmological researchNippon Ganka Gakkai Zasshi19991031287190910643292
- MorimotoTFukuiTMatsushitaKEvaluation of residual retinal function by pupillary constrictions and phosphenes using transcorneal electrical stimulation in patients with retinal degenerationGraefes Arch Clin Exp Ophthalmol2006244101283129216550408
- NagasakaMKohzukiMFujiiTEffect of low-voltage electrical stimulation on angiogenic growth factors in ischaemic rat skeletal muscleClin Exp Pharmacol Physiol200633762362716789930
- CheahLSGweeMDasREvidence for the existence of a constitutive nitric oxide synthase in vascular smooth muscleClin Exp Pharmacol Physiol200229872572712100009
- BringmannAPannickeTGroscheJMüller cells in the healthy and diseased retinaProg Retin Eye Res200625439742416839797
- HaylorJSinghIEl NahasAMNitric oxide synthesis inhibitor prevents vasodilation by insulin-like growth factor IKidney Int19913923333352002647
- SteinbergHOBrechtelGJohnsonAFinebergNBaronADInsulinmediated skeletal muscle vasodilation is nitric oxide dependent. A novel action of insulin to increase nitric oxide releaseJ Clin Invest1994943117211798083357
- WuYHJengYYYueCJChyuKYHsuehWAChanTMEndothelial- dependent vascular effects of insulin and insulin-like growth factor I in the perfused rat mesenteric artery and aortic ringDiabetes1994438102710328039596
- ChenYLMessinaEJDilation of isolated skeletal muscle arterioles by insulin is endothelium dependent and nitric oxide mediatedAm J Physiol19962706 Pt 2H2120H21248764264
- OltmanCLKaneNLGuttermanDDBarRSDellspergerKCMechanism of coronary vasodilation to insulin and insulin-like growth factor I is dependent on vessel sizeAm J Physiol Endocrinol Metab20002791E176E18110893337