
Abstract
Aim
The aim was to study the variability of choroidal scleral interface (CSI) thickness in healthy subjects and its relevance for designing future studies.
Methods
A total of 123 volunteers were imaged using swept-source optical coherence tomography. Early treatment diabetic retinopathy grid was used.
Results
Mean central retinal thickness was 285.85±14.53 µm and 287.18±12.93 µm, and mean central CSI thickness was 273.94±77.77 µm and 271.19±78.85 µm for the right and left eyes, respectively. Mean retinal and CSI thicknesses correlated negatively with age (p=0.023, r=−0.208 and p<0.0001, r=−0.426, respectively) and axial length (p=0.016, r=−0.220 and p<0.0001, r=−0.504, respectively). To detect a CSI change of at least 112 µm, a sample size of 11 or 36 per group is needed for a single- or double-arm study, respectively (α=0.05, power =0.90, no loss to follow-up, assuming standard deviation in future studies as 100 µm).
Conclusion
Future clinical studies using CSI as end point are possible with regard to sample size needed.
Introduction
The development of optical coherence tomography has revolutionized the ophthalmology. Using this technology, we are able to produce a high-detailed image of the retina. In recent years, the development of swept-source technology has enabled us to produce images in a much faster way.Citation1 Also, the use of 1,050 nm wave length enables us to penetrate the retina much better, therefore allowing a deeper penetration into the choroid.Citation2
Several authors have shown that choroidal thickness is associated with retinal diseases such as central serous chorioretinopathy and age-related macular degeneration.Citation3–Citation6 However, choroidal thickness is also influenced by other factors, such as axial length.Citation7–Citation9 Although visual acuity is a common parameter measured in clinical trials, there is a need to examine secondary end points as well. For example, in trials in which cataract is a common adverse event, objective measurements of retina and choroid are desirable.
Therefore, the exact measurements of choroidal thickness in healthy individuals are essential for future clinical research using this parameter. In the present study, we measure choroidal and retinal thicknesses in healthy participants. We examine its variability and relevance in designing clinical trials using this parameter.
Patients and methods
In this paper, we examined the retinal and choroidal thicknesses in 123 volunteers. Main inclusion criterion for the analysis was a best-corrected visual acuity (BCVA) better than 20/25 in both eyes. Exclusion criteria included signs of other ocular diseases compromising retinal thickness, such as early or late age-related macular degeneration, macular pucker, macular hole, vitreomacular traction, glaucoma, glaucoma suspect patients, and diabetic macular edema. All subjects underwent full ophthalmic examinations including BCVA measurement, slit lamp examination, binocular indirect ophthalmoscopy, fundus photography, and swept-source optical coherence tomography (SS-OCT). Subjects with insufficient quality of SS-OCT images were excluded from the analysis. All volunteers were examined in the University of Cologne. By doing this, there is a selection bias in the collective. This is however intended, because we would like to study the variability of healthy individuals, before moving to cross-sectional type study not excluding individuals with other ocular conditions. Informed consent was obtained from each subject. Some of the participants were under the legal age of consent, in this case written informed consents were provided by their parents or legal guardians. The study was approved by the ethic committee of the University of Cologne (number 15-177).
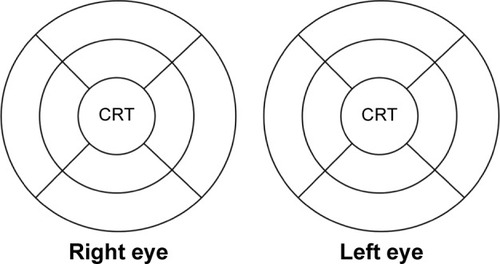
Axial length was measured using Zeiss IOLMaster 500 (Carl Zeiss Meditec AG, Jena, Germany). Retinal and choroidal thicknesses were measured using swept-source optical coherence tomography (DRI OCT-1; TopCon Corporation, Tokyo, Japan). Using this device, a retinal–choroidal map was produced. The Early Treatment Diabetic Retinopathy Study (ETDRS) grid was centered manually at the fovea. The following retinal layers were delineated automatically: RETINA, total retinal thickness from internal limiting membrane to Bruch’s membrane; RNFL, retinal nerve fiber layer; GCLIPL, Ganglion cell layer and inner plexiform layer; RNFLGCLIPL, sum of retinal nerve fiber layer to inner plexiform layer; and CSI, choroid scleral interface. The thicknesses analyzed were the mean of all thickness within the ETDRS grid ().
Figure 1 ETDRS grid used in this study.
Abbreviation: ETDRS, Early Treatment Diabetic Retinopathy Study.
Statistical analyses were done using MedCalc version 16.8.4 (MedCalc Software bvba, Ostend, Belgium). Demographic characteristics of the population are described with summary statistics. Continuous data are presented with mean ± standard deviation. Student’s t-test for dependent variables is used, comparing the right eye and the left eye. Comparison between eyes of different subjects was done using Student’s t-test for independent variables. p-value <0.05 was deemed to be statistically significant. All correlations between two values are presented as Pearson product-moment correlation coefficient (r). Sample size calculations were done using the G*Power 3 software (available at www.psycho.uni-duesseldorf.de/abteilungen/aap/gpower3/download-and-register), which was described and developed by Faul et al.Citation10,Citation11 Sample size calculations for all hypothetical studies are done using the assumptions α=0.05, power =0.9, and no loss to follow-up.Citation12,Citation13
Results
Among these volunteers, 45 were men (36.6%) and 78 were women (63.4%). A summary of demographic characteristics is shown in . Mean RETINA thickness was 285.85±14.53 µm and 287.18±12.93 µm for the right and left eyes, respectively. The mean RNFL was 29.43±3.16 µm and 30.20±3.46 µm. For GCLIPL, the mean thickness was 75.95±5.94 µm and 76.04±4.89 µm. The mean RNFLGCLIPL was 105.37±8.01 µm and 106.22±6.92 µm. For CSI thickness, the mean thickness was 273.94±77.77 µm (range: 81.77–480.56 µm) and 271.19±78.85 µm (range: 76.56–471.22 µm) for the right and left eyes, respectively.
Table 1 Summary of demographic characteristics
In patients with axial length >23 mm, mean CSI in the ETDRS region was 261.25±74.61 µm and 259.43±75.63 µm for the right and left eyes, respectively. Mean RETINA thickness was 285.37±15.01 µm and 286.81±13.38 µm. In patients with axial length ≤23 mm, mean CSI was 316.07±73.43 and 307.34±75.51 µm. In these patients, mean RETINA was 286.25±13.93 µm and 287.32±12.07 µm for the right and left eyes, respectively.
The correlation between retinal choroidal thickness, age, and axial length is presented in . Overall CSI thickness within the ETDRS grid and within the central retinal thickness (CRT) region correlated significantly with age and axial length (p<0.0001, respectively). Male participants had no statistical difference in retinal thickness (288.33±16.25 µm) compared to female participants (284.43±13.34 µm), t(121) =1.441, p=0.15.
Table 2 Partial correlation between retinal and choroidal thicknesses, age, and axial length
Overall, RETINA correlates with CSI (r=0.24, p=0.007 for the right eye and r=0.24, p=0.008 for the left eye). The overall mean retinal thickness in ETDRS grid differed significantly between the right (285.85±14.53 µm) and left eyes (287.18±12.93 µm), t(122) =3.124, p=0.002. On comparing only the CRT regions, RETINA differed between both eyes of the same individual (p=0.005). However, CSI in the CRT region did not differ between both eyes (p=0.23). We found a considerable amount of concordance between CSI within ETDRS grid and within CRT region of the right and left eyes of the same individual ().
Figure 2 (A) Bland–Altman plot between CSI thickness of the right and left eyes within the 6 mm grid in the ETDRS grid. (B) Bland–Altman plot of CSI thickness between the right and left eyes within the CRT grid.
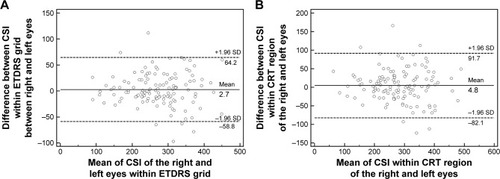
Mean absolute difference between CSI within ETDRS grid between both eyes of the same individual was 23.491±20.877 µm (range: 0.111–112 µm). The mean absolute difference of CSI in the CRT region between both eyes of the same individual was 33.366±29.459 µm (range: 0–166 µm).
Sample size calculation
For designing future clinical trials using choroidal thickness measurements in SS-OCT as one possible primary end point, the sample size needed has to be defined in detail. In this study, we found choroidal thickness differences of up to 112 µm in normal individuals between both eyes. Since CSI changes are a generalized change, we have chosen the overall CSI within the ETDRS grid as a logical parameter for future clinical studies. A 112 µm threshold was chosen for the detection of CSI changes. Assuming a hypothetical study to detect at least a 112 µm difference using the fellow eye as a control without a prior SS-OCT measurement, a sample size calculation was done for either single-arm or double-arm studies (). Hypothetical clinical studies using a threshold <112 µm, such as to detect subtle changes, will increase the number of patients required and vice versa.
Table 3 Sample size calculations
Discussion
With the introduction of enhanced depth imaging and swept-source optical coherence tomography, the imaging of the choroidea has improved tremendously. Various studies have shown an association of choroidal thickening with various diseases, such as central serous chorioretinopathy,Citation14,Citation15 polypoidal choroidal vasculopathy,Citation16 and uveitis.Citation17,Citation18 Therapeutical approaches such as intravitreal injections or surgical manipulation have also been shown to affect the choroid.Citation19
In the present study, we demonstrated the variability of choroidal thickness in healthy subjects. We showed that choroidal thickness is influenced by many factors, such as age and axial length. However, even the same individual might have a considerable amount of choroidal thickness asymmetry between both eyes. Therefore, the results from this study are important to understand the variability of the choroid in more detail. We also use the results from this study to calculate sample size needed to design future clinical studies using choroidal thickness as one possible end point.
The standard deviation in such clinical trials might also vary considerably. It depends on which underlying disease is being investigated. In this study, we found a CSI standard deviation of ~78 µm, assuming the same amount of standard deviation in future clinical trials, a sample size of 5–11 will be needed for a study, using fellow eye as reference. In a study with two groups, a sample size between 12 and 36 subjects will be needed ().
Conclusion
We examine the variability of retinal and choroidal thicknesses in healthy subjects in this study. The choroidal thickness might vary up to 112 µm between both eyes of the same individuals. The choroidal thickness is associated with axial length and age. The sample size for future clinical studies calculated here shows us that such studies are feasible.
Disclosure
The authors report no conflicts of interest in this work.
References
- MurthyRKHajiSSambhavKGroverSChalamKVClinical applications of spectral domain optical coherence tomography in retinal diseasesBiomed J201639210712027372166
- LavinskyFLavinskyDNovel perspectives on swept-source optical coherence tomographyInt J Retina Vitreous201622527847643
- MrejenSSpaideRFOptical coherence tomography: imaging of the choroid and beyondSurv Ophthalmol201358538742923916620
- CaramoyAEngelLKochKRKirchhofBCursiefenCHeindlLMMultiple imaging modalities for the detection of optic nerve head drusen: is echography still mandatory?Acta Ophthalmol201795332032327681817
- ZhengFGregoriGSchaalKBChoroidal thickness and choroidal vessel density in nonexudative age-related macular degeneration using swept-source optical coherence tomography imagingInvest Ophthalmol Vis Sci201657146256626427849311
- CerquagliaAIaccheriBFioreTFull-thickness choroidal thinning as a feature of Fuchs Uveitis Syndrome: quantitative evaluation of the choroid by Enhanced Depth Imaging Optical Coherence Tomography in a cohort of consecutive patientsGraefes Arch Clin Exp Ophthalmol2016254102025203127590056
- OnerVBulutABuyuktarakciSKaimMInfluence of hyperopia and amblyopia on choroidal thickness in childrenEur J Ophthalmol201626662362626541109
- AbbeyAMKuriyanAEModiYSOptical coherence tomography measurements of choroidal thickness in healthy eyes: correlation with age and axial lengthOphthalmic Surg Lasers Imaging Retina2015461182425559504
- Ruiz-MedranoJFlores-MorenoIPena-GarciaPAnalysis of age-related choroidal layers thinning in healthy eyes using swept-source optical coherence tomographyRetina20173771305131327755379
- FaulFErdfelderELangAGBuchnerAG*Power 3: a flexible statistical power analysis program for the social, behavioral, and biomedical sciencesBehav Res Methods200739217519117695343
- FaulFErdfelderEBuchnerALangAGStatistical power analyses using G*Power 3.1: tests for correlation and regression analysesBehav Res Methods20094141149116019897823
- GaudermanWJBarlowWESample size calculations for ophthalmologic studiesArch Ophthalmol199211056906921580847
- CaramoyAFoersterJAllakhiarovaESpectral-domain optical coherence tomography in subjects over 60 years of age, and its implications for designing clinical trialsBr J Ophthalmol201296101325133022863948
- HondaSMikiAKusuharaSImaiHNakamuraMChoroidal thickness of central serous chorioretinopathy secondary to corticosteroid useRetina20173781562156727787451
- RegatieriCVNovaisEABranchiniLChoroidal thickness in older patients with central serous chorioretinopathyInt J Retina Vitreous201622227847640
- LeeWKBaekJDansinganiKKLeeJHFreundKBChoroidal morphology in eyes with polypoidal choroidal vasculopathy and normal or subnormal subfoveal choroidal thicknessRetina201636suppl 1S73S8228005665
- TakahashiASaitoWHashimotoYIshidaSMultiple evanescent white dot syndrome associated with retinal vasculitisInt Med Case Rep J2015820921326451125
- HirookaKSaitoWNambaKSignificant role of the choroidal outer layer during recovery from choroidal thickening in Vogt-Koyanagi-Harada disease patients treated with systemic corticosteroidsBMC Ophthalmol20151518126677974
- YumusakEOrnekKDikelNHComparison of choroidal thickness changes following intravitreal dexamethasone, ranibizumab, and triamcinolone in eyes with retinal vein occlusionEur J Ophthalmol201626662763226847213