
Introduction
Changes in macular thickness measurements in neovascular age-related macular degeneration (nAMD) are thought to reflect disease activity, and can be used to guide treatment with antiangiogenic agents.Citation1 Both spectral-domain optical coherence tomography (SD-OCT) and the more recently introduced swept-source optical coherence tomography (SS-OCT) have onboard segmentation algorithms that deliver automated retinal thickness measurements. Agreement between OCT derived macular thickness measurements is critical for monitoring of patients if these modalities are to be used interchangeably. This prospective cross-sectional study sought to determine the limits of agreement between SD-OCT (Spectralis; Heidelberg Engineering) and SS-OCT (DRI OCT-1 Atlantis; Topcon Medical Systems) in patients with nAMD.
Methods
This study formed part of the Distance of Choroid Study (DOCS) at Moorfields Eye Hospital, London in 2014. All subjects gave written informed consent prior to inclusion in the study. The study was approved by the local ethics committee (NRES Committee, South East Coast, Surrey) and adhered to the tenets set forth in the Declaration of Helsinki. Subjects aged 50–90 years with subfoveal choroidal neovascularization secondary to nAMD were included. Exclusion criteria included media opacity, previous ocular surgery (other than cataract surgery), significant ocular comorbidity, and diabetes mellitus. All patients underwent three Spectralis scans and three DRI OCT-1 scans in the same imaging session. The Spectralis scan was a macular volume scan consisting of a 25-line horizontal-line scan (512 A scan per B scan) in enhanced depth-imaging mode. The DRI OCT-1 scan consisted of a 12×9 mm raster scan centered on the fovea. Automated retinal thickness measurements of the Early Treatment Diabetic Retinopathy Study were obtained using proprietary software on both SD-OCT (version 3.1) and SS-OCT (version 9.30).
Results
A total of 36 eyes of 36 patients with nAMD were included in the study. Subject characteristics are summarized in . Bland–Altman analysis showed low agreement between OCT-derived macular thickness measurements, with mean difference ranging from 18.2 μm (A7) to 77.6 μm (A2) (). The 95% limits of agreement of the central macular subfield (A1) were −20.5 μm to 156.3 μm. There was a correlation between the magnitude of the retinal thickness measurement and the degree of variation between SD-OCT and SS-OCT for the A1 subfield (Spearman’s correlation coefficient 0.59, P=0.02), suggesting that the variation in OCT derived metrics was perhaps more evident in those with more active disease. Given this association, it is possibly more appropriate to express the limits as a ratio after logarithmic transformation (95% limits of agreement 0.97–1.74), indicating that the SD-OCT measurements can be between 3% smaller and 74% larger than SS-OCT central macular subfield-thickness measurements.Citation2
Figure 1 Bland-Altman analysis comparing the mean difference between spectral-domain and swept source optical coherence tomography macular thickness measurements in neovascular age related macular degeneration.
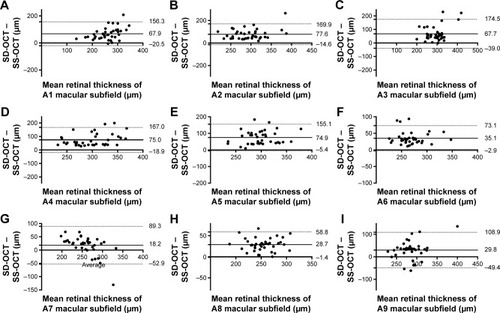
Table 1 Subject characteristics of patients with neovascular age-related macular degeneration
Discussion
This analysis suggests there is surprisingly limited level of agreement between SD-OCT- and SS-OCT-derived retinal thickness measurements in subjects with nAMD included in our study. Alteration in foveal structure due to developing choroidal neovascularization, changes in foveal centration and segmentation error may affect retinal thickness measurements in nAMD.Citation3–Citation5 The Spectralis and DRI OCT function at different imaging-light wavelengths (840 nm and 1,050 nm, respectively) with different spatial resolution (7×14 μm and 8×20 μm, respectively). Differences in segmentation algorithms, particularly in the location of the inner retinal boundary, have the potential to alter automated retinal thickness measurements.Citation6 Further analysis with a larger study population is required to evaluate the disparity between retinal thickness measurements. We suggest that the use of absolute retinal thickness measurements in nAMD can only be interpreted in the context of the OCT technology used. Differences in the central macular subfield measurements appeared greatest at larger retinal thicknesses, where disease activity was presumably higher. Clinicians should be aware of this variability, and should consider utilization of a single form of OCT during monitoring of patients with nAMD to prevent conflation of variation in disease activity and different forms of OCT technology.
Acknowledgments
This work was funded by SalutarisMD and supported by the National Institute of Healthy Research (NIHR) Biomedical Research Centre at Moorfields Eye Hospital National Health Service (NHS) Foundation Trust and UCL Institute of Ophthalmology. The views expressed are those of the authors, and not necessarily those of the NHS, the NIHR, or the Department of Health.
Disclosure
The authors report no conflicts of interest in this work.
References
- KeanePALiakopoulosSJivrajkaRVEvaluation of optical coherence tomography retinal thickness parameters for use in clinical trials for neovascular age-related macular degenerationInvest Ophthalmol Vis Sci20095073378338519264895
- BlandJMAltmanDGMeasuring agreement in method comparison studiesStat Methods Med Res19998213516010501650
- MansouriKMedeirosFATathamAJMarchaseNWeinrebRNEvaluation of retinal and choroidal thickness by swept-source optical coherence tomography: repeatability and assessment of artifactsAm J Ophthalmol201415751022103224531020
- MidenaERadinPPPilottoEGhirlandoAConventoEVaranoMFixation pattern and macular sensitivity in eyes with subfoveal choroidal neovascularization secondary to age-related macular degeneration: a microperimetry studySemin Ophthalmol2004191–2556115590535
- KimMLeeSHanJYuSYKwakHSegmentation error and macular thickness measurements obtained with spectral-domain optical coherence tomography devices in neovascular age-related macular degenerationIndian J Ophthalmol201361521321723314254
- Pierre-KahnVTadayoniRHaouchineBMassinPGaudricAComparison of optical coherence tomography models OCT1 and Stratus OCT for macular retinal thickness measurementBr J Ophthalmol200589121581158516299134