Abstract
Purpose:
Occult macular dystrophy (OMD) is a hereditary retinal disease characterized by a normal fundus, normal full-field electroretinograms (ERGs), progressive decrease of visual acuity, and abnormal focal macular ERGs. The purpose of this study was to report pattern-reversal visual-evoked potential (pVEPs) findings in OMD patients.
Patients and method:
The pVEPs recorded from four patients with OMD (aged 42–61 years; 2 men and 2 women) were reviewed. The visual acuities ranged from 20/200 to 20/30. The amplitudes of the N-75 and P-100 (P2 amplitude) and the latency of the N-75 components (N1 latency) were analyzed.
Results:
The mean (±SD) P2 amplitude was 2.7 ± 1.9 μV for the 5′, 4.8 ± 2.9 μV for the 10′, 3.2 ± 2.1 μV for the 20′, and 4.4 ± 3.5 μV for the 40′ checkerboard stimuli. The N1 latency was 122.2 ± 6.4 ms for the 5′, 105.0 ± 11.5 ms for the 10′, 97.7 ± 10.0 ms for the 20′, and 91.0 ± 13.7 ms for the 40′ checkerboard stimuli. The mean P2 amplitude was reduced and the N1 latency was delayed in comparison with the laboratory standard for the Keio University Hospital.
Conclusions:
The delayed latency and reduced amplitude suggest a major contribution of the central cone pathway to the pVEPs.
Introduction
Occult macular dystrophy (OMD) is a hereditary macular dystrophy characterized by a progressive decrease of the visual acuity, normal fundus, and normal fluorescein angiograms.Citation1,Citation2 The hereditary form is an autosomal dominant trait, and recently the response gene was identified with mutation in RP1L1.Citation3
The cone and rod components of the full-field electroretinograms (ERGs) are normal, but the focal macular ERGs are reduced. A reduction of the visual acuity without visible fundus abnormalities, and the presence of a central scotoma and/or reduced central fusion flicker frequencyCitation4 are often seen, and the patients can be misdiagnosed with amblyopia, optic nerve disease, or a nonorganic visual disorder.Citation4 Only limited information is available on the visual-evoked potentials (VEPs) in patients with OMD.Citation5 How the VEPs are affected in this disease with central cone dysfunction has not been fully determined. Thus, the purpose of this study was to evaluate the pattern-reversal VEPs (pVEPs) in patients with OMD.
Subjects and methods
Subjects
Four patients diagnosed with OMD at the Keio University Hospital between 2000 and 2002 were studied; two were men and two were women aged 42, 49, 60, and 69 years, respectively ().
Table 1 Clinical characteristics of the patients and the result of the examinations
Stimulus and recording of pattern-reversal VEPs
The visual stimulus was a black-and-white pattern checkerboard generated on a CRT (cathode ray tube) monitor (20-inch, high-resolution display; Ikegami Tsushinki Co, Ltd, Tokyo, Japan). The mean luminance was kept at 109.5 cd/m2, and each check was either white (154 cd/m2) or black (65 cd/m2) with a 40.6% contrast. Four check sizes were used: 5, 10, 20, and 40 min of arc at an observation distance of 150 cm. The amplitude of N-75 and P-100 (P2 amplitude) and the latency of the N-75 (N1 latency) were analyzed.
Patients were preadapted to the room lighting, and all recordings were performed under dim room lights with an illumination of about 50 cd/m2. A small black fixation point was present in the center of the stimulus display, and the subjects were instructed to fixate the point or the center of the screen and to try not to blink. The subjects wore their best refractive correction, and all recordings were monocular.
The recording electrode was placed 2.0 cm superior to the inion, and the reference electrode was placed on one earlobe. The ground electrode was placed on the other earlobe.
Signals were amplified 50,000 times with an amplifier (VC-11; Nihon Kohden, Tokyo, Japan) and filtered with a band-pass filter from 0.5 to 30 Hz. Sixty-four responses were averaged.
Normative data were collected from 40 age-matched patients who did not have any ocular diseases except for refractive errors (age range 40–67 years; average 53.1 ± 8.41 years).
All of the procedures conformed to the guidelines of the Declaration of Helsinki, and an informed consent was obtained from all subjects after an explanation of the purpose and the procedures to be used in the experiments.
Results
Patients were diagnosed with OMD by the following findings in both eyes: progressive decrease in the visual acuity, normal fundus, normal fluorescein angiograms, central scotoma in Goldman perimetry, normal cone and rod components of the full-field ERGs, and abnormal focal macular or multifocal ERGs (mfERGs). Their visual acuities ranged from 20/200 to 20/30. None had a history of ophthalmological abnormalities, such as glaucoma or diabetic retinopathy that could affect the visual function especially the pVEPs.
All cases had at least one individual in their pedigree who was also diagnosed with OMD. Case 4 was a second cousin of case 2 (). The interval between the onset of the decreased visual acuity and diagnosis at our clinic was 1–25 years. Three of the cases were genetically diagnosed with OMD.
VEP results
A plot of the P2 amplitudes as a function of pattern check size in the four patients with OMD is shown in . In three of the cases, the amplitudes of P2 were smaller than that of the normal controls. In the second case (case 2), the P2 amplitudes overlapped the amplitudes of the normal controls.
Figure 1 Plot of the A) P2 amplitude and B) N1 latency as a function of the size of the checks of the stimulus for the four patients. The average and the standard error of the means of normal subjects are plotted as the black line. The N1 latency was delayed in all eyes, while the P2 amplitude was reduced in all eyes except both eyes in case 2.
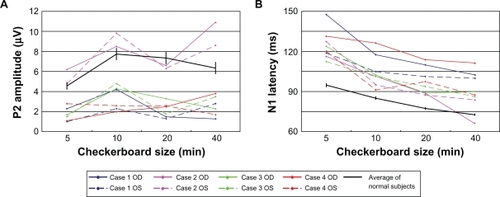
The latencies of the N-75 component from all of the patients were longer than those of normal subjects ().
Case reports
All four cases share typical OMD features, and definitive diagnosis was made genetically in the three of four cases. We present case 1 as the representative data.
Case 1
Case 1 was a 42-year-old woman who stated that her visual acuity has been reduced in both eyes for 10 years. Several ophthalmologists, psychiatrists, and physicians in other clinics failed to diagnose her condition, and she was referred to Keio University Hospital for further examination. Her sister and cousin had similar symptoms – bilateral progressive decrease of vision – and were diagnosed with OMD at other hospitals. Her corrected visual acuity was 20/200 in both eyes. Funduscopy and fluorescein angiography were normal (). Goldman perimetry showed a central scotoma of 5° in both eyes (). The central fusion flicker frequency was 28.6 Hz in the right eye and 29.6 Hz in the left eye (48.2 ± 5.3 Hz: mean ± SD as normal range in our laboratory). Her right eye had normal color vision, and her left eye had mild atypical dyschromatopsia.
Figure 2 Fundus photograph (above) and fluorescein angiography (below) of case 1 showing no abnormal findings.
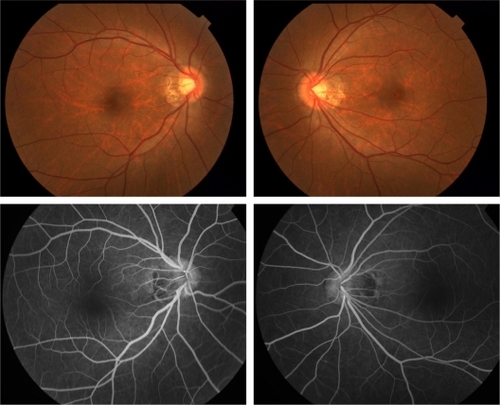
Figure 3 A) Goldman perimetry and multifocal electroretinogram (ERG) of case 1. B) Multifocal ERG of cases 2, 3, and 4. Goldman perimetry revealed relative central scotoma of 5° in both eyes. The amplitudes of the multifocal ERGs are reduced in the central area in all cases.
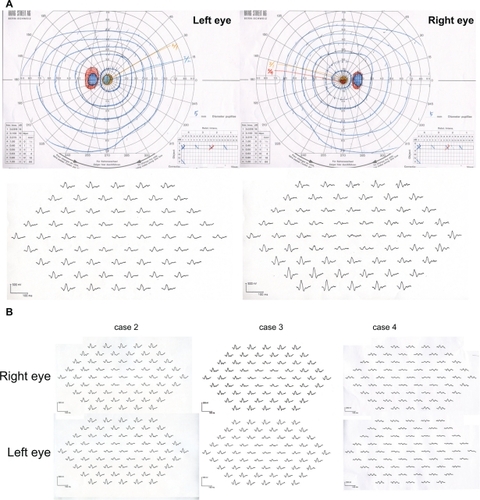
The scotopic, bright-flash, photopic, and 30-Hz flicker full-field ERGs were normal (). However, the mfERGs in the central areas were reduced (). The focal macular ERGs recorded at another clinic were clearly reduced in both eyes (). A diagnosis of OMD was made.
Figure 4 Full-field electroretinogram (ERG) recorded following ISCEV standard protocol. The stimuli are indicated by the arrowheads. Scotopic, bright-flash, photopic, and 30-Hz flicker full-field ERGs are normal.
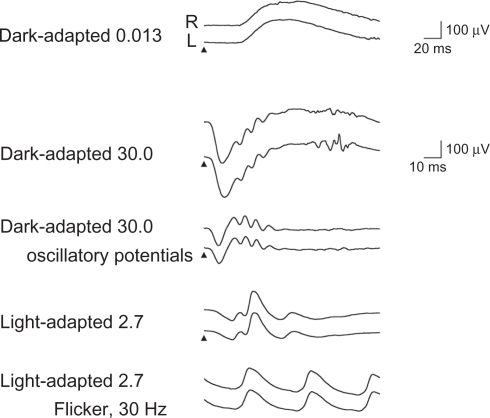
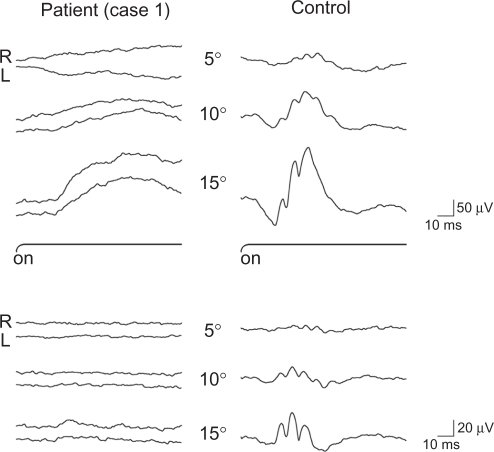
Figure 5 Focal macular electroretinogram (ERG) (above) and oscillatory potentials (below) recorded from case 1 (left) and normal subject (right). The focal macular ERGs from the patient are clearly smaller than the responses from the normal eye. These ERGs were elicited by 5′, 10′, and 15′ stimulus centered on the fovea. The black bars show the stimulus duration (100 ms).
The P2 amplitude was 2.3 μV for the 5′, 4.2 μV for the 10′, 1.5 μV for the 20′, and 1.3 μV for the 40′ checkerboard stimuli of the right eye (). For the same stimuli for the left eye, the P2 amplitudes were 1.0, 2.3, 1.3, and 2.8 μV, respectively. The N1 latency was 147.5 ms for the 5′, 117.5 ms for the 10′, 110.0 ms for the 20′, and 102.5 ms for the 40′ checkerboard stimuli in right eye (). For the left eye and the same stimuli, the N2 latencies were 118.8, 105.0, 101.3, and 100.0 ms, respectively. The average P2 amplitude was reduced, and the N1 latency was delayed in comparison to our laboratory standard values ().
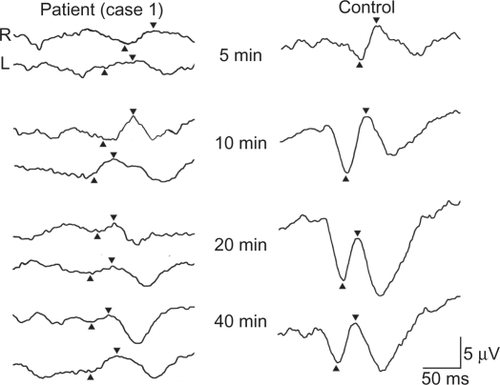
Figure 6 pVEPs of case 1 (left) and normal subject (right) elicited by checkerboard stimulus. The N1 latency is delayed and the P2 amplitude is reduced in all the responses elicited by each checkerboard stimuli. The visual angles of the stimuli are shown in the middle. Up arrowheads show N-75 and down arrowheads show P-100.
Discussion
A delayed N2 latency of the pVEPs is not a specific sign of optic neuropathy because it is also found in eyes with retinal diseases.Citation6–Citation10 Thus for delayed N2 latencies, the differential diagnosis is between optic nerve disease and macular disease. There are a number of studies that have examined how macular diseases affect the pVEPs.Citation6–Citation17 However, the results are not all in agreement. In general, the pVEPs are attenuated and the latencies are delayed in several macular diseases such as age-related macular degeneration,Citation6,Citation10,Citation14,Citation16,Citation17 macular hole,Citation6,Citation12,Citation13 central serous chorioretinopathy,Citation6,Citation10,Citation11,Citation15,Citation18 branch retinal vein occlusions,Citation10 and macular dystrophies.Citation6,Citation8,Citation19
Our findings showed that the pVEPs were decreased in three of the four cases, and the latencies were delayed in all four cases. We would have predicted that the responses would be more altered at more advanced stages of the disease.Citation14,Citation16 However, Bass et alCitation6 showed a significant delay in the latency even in eyes with relative good visual acuity of 0.4 or better. Our case 4 had a visual acuity of 20/30 in the right eye, but the pVEPs were delayed even with the larger check size stimulation. The delayed latency and reduced amplitude suggest a major contribution of the central cone pathway to the pVEPs.
A relative delay in the N1 latency was observed in all eyes, while the P2 amplitude was within normal range in both eyes in one case (case 2). Okuno et alCitation5 reported that one of three affected family members with OMD had a delayed P-100 implicit time, whereas two other patients, who were daughters of the first patient, had normal implicit times. Thus, younger OMD patient may have a relatively intact visual pathway function. Okuno et al used a 1° checkerboard pattern, and we routinely use four stimulus check sizes in the recording of the pVEPs. Thus, the stimulus protocol and laboratory settings might be the cause of the discrepancy between their results and our results. Unfortunately, they did not report the amplitude of any component of the pVEP.
Several investigatorsCitation7,Citation9,Citation10 have reported that retinal diseases may cause an increase in the pVEP latency, and the increase was significantly less for eyes with macular diseases than that in eyes with optic neuropathy. Shimada et alCitation10 concluded that the pVEPs appear to be more sensitive for optic nerve diseases than for macular diseases in patients with similar visual acuities.
From another point of view, one may ask what is the possibility of the concurrent impairment of optic nerve only from reduced responses in pVEP and focal macular ERG. We believe that such possibility is low in OMD because recently identified responsible gene RP1L1 suggests that the pathologic site is retina. However, further investigation to compare ERG/pVEP signal ratio in such patients and in patients affected solely by macular degeneration matched for age and visual acuity is waited.
Optical coherence tomography (OCT) examination of the fovea of eyes with OMD showed that the fovea was significantly thinner.Citation4,Citation20 Recent study in OCT of OMD patientsCitation21–Citation23 demonstrated a defect of the inner segment–outer segment junction of the photoreceptors and of the Verhoeff membrane (cone outer segment tips). However, degrees of abnormality in the photoreceptor layer varied among patients and some OMD patients show normal OCT, which means OCT findings are not enough to make definitive diagnosis.
There are some limitations in this study. The number of cases was limited and this was a retrospective study without proper controls. In addition, from retrospective nature, pVEP recordings did not accord with ISCEV standards: different electrode position, relative small size, and low-contrast stimuli. Further investigations, using proper stimulus according to updated ISCEV standards, are needed to determine whether we can differentiate OMD from optic neuritis using pVEP.
In conclusion, we showed reduced amplitudes and longer latencies of the pVEPs in eyes with OMD. It would be helpful to find additional parameters in the differential diagnosis of OMD from optic neuritis in addition to focal macular ERG, which so far is the only diagnostic test to differentiate OMD from amblyopia, optic nerve disease, and nonorganic disorders.
Acknowledgements
This study was partly supported by 1) Research Grants on Sensory and Communicative Disorders from the Ministry of Health, Labor, and Welfare, Japan and from the Ministry of Education, Culture, Sports, Science and Technology, Japan and 2) SENTAN, JST, Japan.
Disclosure
The authors declare no conflict of interest in this work.
References
- MiyakeYHoriguchiMTomitaNOccult macular dystrophyAm J Ophthalmol199612256446538909203
- MiyakeYIchikawaKShioseYKawaseYHereditary macular dystrophy without visible fundus abnormalityAm J Ophthalmol198910832922992774037
- AkahoriMTsunodaKMiyakeYDominant mutations in RP1L1 are responsible for occult macular dystrophyAm J Hum Genet201087342442920826268
- MiyakeYElectrodiagnosis of Retinal DiseaseTokyo, JapanSpringer-Verlag2006
- OkunoTOkuHKondoMAbnormalities of visual-evoked potentials and pupillary light reflexes in a family with autosomal dominant occult macular dystrophyClin Experiment Ophthalmol200735878178317997791
- BassSJShermanJBodis-WollnerINathSVisual evoked potentials in macular diseaseInvest Ophthalmol Vis Sci1985268107110744019098
- FujimotoNAdachi-UsamiEMurayamaKDelayed pattern VECP latency in optic nerve diseases and central serous retinopathyFolia Ophthalmologica Japonica19914214451448
- LennerstrandGDelayed visual evoked cortical potentials in retinal diseaseActa Ophthalmol (Copenh)19826044975047158314
- NegishiCTakasohMFujimotoNTsuyamaYAdachi-UsamiEVisual evoked potentials in relation to visual acuity in macular diseaseActa Ophthalmol Scand200179327127611401637
- ShimadaYAdachi-UsamiEMurayamaKHow are macular changes reflected in pattern visually evoked cortical potentials?Acta Ophthalmol Scand19977532772809253974
- FolkJCThompsonHSHanDPBrownCKVisual function abnormalities in central serous retinopathyArch Ophthalmol19841029129913026477246
- JohnsonLNYeeRDHeplerRSMartinDAAlteration of the visual evoked potential by macular holes: comparison with optic neuritisGraefes Arch Clin Exp Ophthalmol198722521231283582995
- KatoMNakagamiTWatanabeIVisual evoked potentials in macular holeDoc Ophthalmol19917643413491935542
- MarcusMMerinSWolfMFeinsodMElectrophysiologic tests in assessment of senile macular degenerationAnn Ophthalmol19831532352386847049
- ShermanJBassSJNobleKGNathSSutijaVVisual evoked potential (VEP) delays in central serous choroidopathyInvest Ophthalmol Vis Sci19862722142213943944
- SokolSAn electrodiagnostic index of macular degeneration. Use of a checkerboard pattern stimulusArch Ophthalmol19728866196245085205
- WalterPKonigsfeldPSoudavarFBrunnerRUnusual visual evoked potentials in patients with age-related macular degenerationOphthalmologica2000214531231910965243
- HanDPThompsonHSFolkJCDifferentiation between recently resolved optic neuritis and central serous retinopathy. Use of tests of visual functionArch Ophthalmol198510333943963977714
- WajimaRKatsumiOMehtaMCItabashiRHiroseTPattern-reversal visual-evoked response in bull’s eye maculopathy associated with Stargardt’s diseaseOphthalmic Res19952742342428539004
- KondoMItoYUenoSPiaoCHTerasakiHMiyakeYFoveal thickness in occult macular dystrophyAm J Ophthalmol2003135572572812719092
- BrockhurstRJSandbergMAOptical coherence tomography findings in occult macular dystrophyAm J Ophthalmol2007143351651817317401
- KoizumiHMaguireJISpaideRFSpectral domain optical coherence tomographic findings of occult macular dystrophyOphthalmic Surg Lasers Imaging200940217417619320307
- ParkSJWooSJParkKHHwangJMChungHMorphologic photoreceptor abnormality in occult macular dystrophy on spectral-domain optical coherence tomographyInvest Ophthalmol Vis Sci20105173673367920164460