
Abstract
Purpose
To develop and validate a diagnostic prediction model for patients with suspected giant cell arteritis (GCA).
Methods
A retrospective review of records of consecutive adult patients undergoing temporal artery biopsy (TABx) for suspected GCA was conducted at seven university centers. The pathologic diagnosis was considered the final diagnosis. The predictor variables were age, gender, new onset headache, clinical temporal artery abnormality, jaw claudication, ischemic vision loss (VL), diplopia, erythrocyte sedimentation rate (ESR), C-reactive protein (CRP), and platelet level. Multiple imputation was performed for missing data. Logistic regression was used to compare our models with the non-histologic American College of Rheumatology (ACR) GCA classification criteria. Internal validation was performed with 10-fold cross validation and bootstrap techniques. External validation was performed by geographic site.
Results
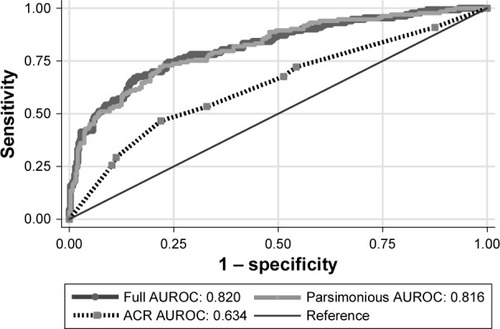
There were 530 complete TABx records: 397 were negative and 133 positive for GCA. Age, jaw claudication, VL, platelets, and log CRP were statistically significant predictors of positive TABx, whereas ESR, gender, headache, and temporal artery abnormality were not. The parsimonious model had a cross-validated bootstrap area under the receiver operating characteristic curve (AUROC) of 0.810 (95% CI =0.766–0.854), geographic external validation AUROC’s in the range of 0.75–0.85, calibration pH–L of 0.812, sensitivity of 43.6%, and specificity of 95.2%, which outperformed the ACR criteria.
Conclusion
Our prediction rule with calculator and nomogram aids in the triage of patients with suspected GCA and may decrease the need for TABx in select low-score at-risk subjects. However, misclassification remains a concern.
Introduction
Giant cell arteritis (GCA) is the most common systemic vasculitis in the elderly, and may result in irreversible blindness, aortitis, myocardial infarction, stroke, or even death. De Smit et al suggest that the incidence of GCA will increase with our aging population with an estimated 3 million cases worldwide by the year 2050 as well as 500,000 patients with blindness at a cost of 76 billion dollars in the US alone.Citation1
GCA can be a diagnostic conundrum, especially when it presents in an occult or atypical fashion. To date, there is no specific biomarker for GCA. Blood tests for inflammation have very poor specificity, and “seronegative” GCA can occur in up to 4% of the patients.Citation2 Temporal artery biopsy (TABx) remains the gold standard in the diagnosis of GCA, but is an invasive, time-consuming test with suboptimal sensitivity. Numerous articlesCitation3–Citation7 incorporate the 1990 American College of Rheumatology (ACR) classification criteria for GCACitation8 to guide the decision for TABx. However, the ACR criteria were not meant to be diagnostic criteria,Citation9 and without the TABx result, the ACR criteria only have a sensitivity of 29%. There are many clinical prediction rules in the diagnosis and management of patients with suspected GCA,Citation10–Citation16 but few were developed using more than 500 TABx or 100 biopsy-positive GCA cases,Citation17 and few if any have external validation. Large collaborative studies can clarify the reliability and generalizability of prediction algorithms for patients with suspected GCA prior to TABx. We used a large multicenter dataset to develop and geographically validate a multivariable diagnostic prediction rule for GCA with an accompanying spreadsheet calculator and nomogram.
Methods
The consecutive records of subjects undergoing TABx for suspected GCA at secondary/tertiary care referral clinics were retrieved from four medical centers in ON, Canada; two from the US; and one from Switzerland (). This clinical audit was approved by the Michael Garron Hospital Research Ethics Board and Queen’s Medical school, and was compliant with the Declaration of Helsinki and the TRIPOD guidelines.Citation18 Some of the data came from the de-identified records of prior research ethics board approved TABx projects (patient consent was not required by the ethics board),Citation19–Citation22 and two centers conducted a chart review in July 2017 with patient consent. The chart review was not blinded.
Table 1 Characteristics of patients with negative versus positive temporal artery biopsy (n=530)
This paper only considered cases of biopsy-proven GCA (BPGCA). As such the pathologic diagnosis was considered the final diagnosis. Healed arteritis was considered as positive for GCA. If the pathologic diagnosis was indeterminate, the record was considered negative for GCA.
Based on the literature reviewCitation15,Citation17,Citation23,Citation24 and subject matter expertise, the candidate predictors for this study were age, gender, jaw claudication, new onset headache, temporal artery abnormality on physical examination (tenderness to palpation, decreased pulse, and scalp nodularity), diplopia, ischemia-related loss of visual acuity or field, or VL (a composite of ischemic optic neuropathy, retinal artery occlusion, or stroke), platelet level, C-reactive protein (CRP), and Westergren erythrocyte sedimentation rate (ESR) prior to glucocorticoid initiation.
Polymyalgia rheumatica (PMR) was not included as it can be a non-specific clinical manifestation, with overlapping age and acute phase response characteristics with GCA. The distinction of PMR from osteoarthritis flare can sometimes be difficult, and reports of joint X-rays were not uniformly available in this study. Except in patients on low-dose prednisone for PMR, bloodwork obtained after glucocorticoid initiation was excluded, but later patients were still considered for multiple imputation analysis. Abnormal ESR was defined as Westergren ESR >50 mm/hour. As there was variation in the CRP technique (highly sensitive versus rapid/regular) and upper limit of normal of CRP from different labs, each CRP was divided by the upper limit of normal to standardize the data.
To avoid overfitting, the minimum estimated sample size was found to be 500. With 10 candidate predictors, a minimum of 100 events (positive TABx) was required. Assuming a utility ratio of four negative TABx for each positive TABx, the minimum estimated sample size was found to be 500 subjects. Missing data at a rate of 10% was anticipated, suggesting that at least 550 records would require to be reviewed.
Statistical calculations were performed using Stata 14.2 (StataCorp LLC, College Station, TX, USA), and JMP Pro13 (JMP SAS Institute, Marlow, Buckinghamshire, UK) and α=0.05 was used for statistical significance. Model misspecification was evaluated with Stata “linktest” and multicollinearity analyzed with Stata “collin” test.
Logistic regression (LR) does not require assumptions of normality, although multivariable normality provides a more stable solution. To optimize model fit, logarithmic transformation of any data that showed skewed distribution was examined. The best predictor subsets for the optimized full model, with and without log-transformed variables, were chosen based on clinical significance and statistical factors: p-values, confidence intervals, penalized-likelihood criteria to minimize Akaike information criterion (AIC), and minimize Bayesian information criterion (BIC), discrimination (area under the receiver operating characteristic curve [AUROC]), and calibration (Hosmer–Lemeshow goodness of fit, and Brier score with Spiegelhalter’s z-statistic) (Table S1).
LR only analyzes complete cases and performs listwise deletion. As it cannot be assumed that data was missing completely at random (“Discussion” section) multiple imputation with 250 imputations was performed to discern possible bias, and to determine if there were any discrepancies in the confidence intervals of the predictor variables. Multiple imputation using chained equations (MICE) was performed on the full model without log transformations, as per convention.
As all covariates were clinically important, we retained the full model, but we developed a parsimonious model as per statistical convention ( and ). The statistically significant variables from the optimal full model were selected for the parsimonious model. A stepwise regression was performed in JMP Pro 13 software with 60% of the data for training, 20% for validation, and 20% for testing, using the forward direction and combined stopping rules to minimize AIC and BIC. Predictor(s) that were statistically significant on MICE but not the complete case analysis were forced on to the parsimonious model for evaluation. An additional nested model excluding the two covariates with the highest p-value was made.
Table 2 Multivariable logistic regression, full model (n=530, pseudo R2=0.256, AUROC =0.820, pHosmer–Lemeshow =0.549, 530 jackknife replications, 3000 bootstrap replications, log likelihood −222.12)
Table 3 Multivariable logistic regression, parsimonious model (n=530, pseudo R2=0.248, AUROC =0.816, pHosmer–Lemeshow =0.812, 530 jackknife replications, 3000 bootstrap replications, log likelihood −224.51)
Internal validation of the final models was assessed by combined cross-fold validation and bootstrap techniques. After multivariable LR, 10-fold cross validation was performed, and the c-statistic corresponding to each fold was averaged. The cross-validated area under the receiver operator characteristics (ROC) curve was then bootstrapped to determine statistical inference. Three thousand computer-generated bootstrap samples, each including 530 patients from the study were refitted and the average odds ratio was obtained.
Geographic external validation was performed by holding out the data from each regional contributing center. Since large datasets are recommended for external validation,Citation25 if a regional dataset had fewer than 30 subjects, then it was placed in the combined group (). One-way analysis of variance (ANOVA) was performed to compare the patient characteristics in the different regions.
Table 4 Geographic external validation of full and parsimonious models by regional site
The actual performance of our models at the 5th and 95th percentile and Liu optimal cutoff points ( and S2) were compared with the ACR model. JMP Pro 13 prediction profiler was used to compare our models using hypothetical examples.
Table 5 Model performance at 5th, 85th and 95th percentile
An online spreadsheet calculator was made for both models, and a Kattan nomogram was made for the parsimonious model.
Length of biopsy was not a primary concern in our initial data collection. Recent literature suggests shorter specimen lengths are adequate for diagnosis (“Discussion” section) and bilateral TABx was routinely performed in patients with continued suspicion for GCA if the initial unilateral TABx was negative.Citation26,Citation27 For completeness sake and to help guide the discussion, biopsy length was examined post hoc.
Results
Of the 688 TABx cases retrieved, 530 were complete records with 397 being negative and 133 being positive biopsies. The TABx dates from the various centers ranged from November 2005 to June 2017, and at least 56% of the TABx were done after 2010. Forty-eight percent of the patients were referred by ophthalmology, and the remainder was referred by rheumatology, internal medicine, or primary care centers.
The characteristics of the positive versus negative TABx are summarized in . Patients with positive TABx were older and had more jaw claudication, higher platelet level, higher ESR, higher CRP, and had more ischemic vision loss (VL) compared with the negative TABx group. The youngest patient with biopsy-proven GCA (BPGCA) was 54 years of age. GCA was more common in women, but on multivariable analysis, gender, new onset headache, temporal artery abnormality, ESR, diplopia, and biopsy length did not show a statistically significant difference between positive and negative biopsy groups.
Ten patients had BPGCA (10/133=7.5%) with normal platelet count (<400 per microliter), ESR <50 mm/hour, and adjusted CRP ≤1. The subjects with “seronegative” BPGCA originated from five different regions, and each case was rechecked to ensure the absence of glucocorticoids prior to bloodwork. The seronegative BPGCA group had mean probability score of 0.108, median of 0.082, and less clinical temporal artery abnormality (p=0.012) than their seropositive counterparts, but other demographic features including age, gender, and biopsy length showed no statistically significant difference in the independent t-test.
Data on biopsy length was readily available for 482/530 (91%) patients that was used for LR. There was no statistically significant difference found with respect to the length of the specimen between the positive and negative biopsy groups on univariate LR (p=0.31). Bilateral biopsies were performed in 23% of the cases. One patient in the negative biopsy group had a TABx length of 0.1 cm, but this was a unique case.
Funduscopic findings were readily available for 32 out of 47 patients with BPGCA and VL. In this group, 23 (72%) patients had anterior ischemic optic neuropathy, 4 (12.5%) had central retinal artery occlusion, 4 (12.5%) had presumed posterior ischemic optic neuropathy, and 1 (3%) had a central retinal vein occlusion. We were able to retrieve the fundus findings in 26/72 patients with VL and a negative TABx, and all these patients had non-arteritic ischemic neuropathy.
The ESR and CRP levels had skewed distributions, but platelet values had a normal distribution. Although LR makes no assumptions of normality, model fitting with the log-transformed ESR and CRP yielded lower AIC and lower BIC than any combination of non-transformed/transformed ESR and CRP. Multivariable LR showed that age, jaw claudication, ischemic VL, platelets, and log-transformed CRP values were significantly predictive of positive TABx () and these covariates were later used for the parsimonious model. There was no model specification error. There was no multicollinearity, with mean variance inflation factor (VIF) of 1.19 in the full model and maximum individual VIF of 1.45 (Supplementary material).
Twenty-three percent of the records had incomplete data, in which serology values were predominantly missing. Following were the major missing value patterns: 12% of the records had no serology values, 3% of the records had missing data regarding platelets and CRP, 3% had missing data regarding platelets alone, 2% had missing CRP values, and <1% had missing ESR values. MICE estimates of the non-transformed full model with 250 imputations showed little bias, if any, with the predictors that were statistically significant on complete case analysis, but the temporal artery abnormality predictor became statistically significant (poriginal =0.117, pMICE =0.036) and was evaluated for the parsimonious model.
Variable selection for statistical modeling was based on the following clinical significance and statistical factors: p-values, the minimum AIC and BIC, discrimination, and calibration. The full model with log-transformed CRP and ESR had better discrimination and calibration than the non-transformed models. There were no statistically significant interaction terms. The full model and the parsimonious model both had good discrimination (AUROC 0.82), and calibration (; Table S1) with misclassification rate of 17.7%. However, the full model had a false negative rate of 54.1% and the parsimonious model had 56.4%. Bootstrap sensitivity analysis with 3,000 replications did not reveal any discrepancies. ( and )
Figure 1 ROC curves for full, parsimonious and ACR models.
Abbreviations: ROC, receiver operator characteristics; ACR, American College of Rheumatology Classification non-histologic Criteria.
The gender and diplopia variables had the highest p-values, but when removed from the full model, the eight covariate nested model had poor calibration (Reduced model A, log transformed). Multiple imputation analysis suggested that the temporal artery abnormality variable is statistically significant, but its addition in the parsimonious model resulted in a poorly calibrated model (Reduced model B, log transformed). (Table S1)
Internal validation with 10-fold cross validation and bootstrap technique showed the following c-statistics: 0.803 (95% CI =0.757–0.849) for the full model and 0.810 (95% CI =0.766–0.854) for the parsimonious model.
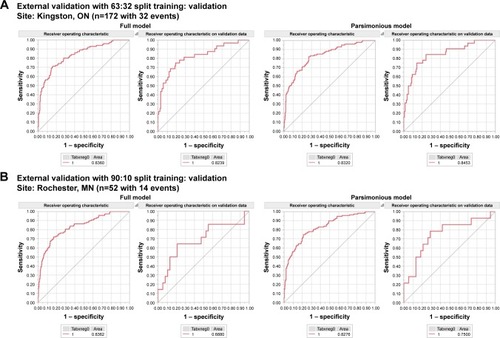
Five spatial external validations were performed with the largest datasets, and the c-statistics ranged from 0.688 to 0.824 for the full model and from 0.750 to 0.845 for the parsimonious model. (; ) ANOVA of the covariates for the regional datasets showed statistically significant difference (all at p<0.001) in clinical temporal arterial abnormality, platelets, ESR, CRP, ischemic VL, diplopia, and biopsy length between the different centers but not for age (p=0.534), gender (p=0.556), jaw claudication (p=0.239), or new headache (p=0.362). The post-hoc pairwise comparisons with Bonferroni correction are shown in supplementary material.
Figure 2 External geographic validation results of the highest (A) and lowest ranking datasets (B).
The full and parsimonious prediction models had similar performance, with almost overlapping ROC curves. () Compared to our study models, the ACR model has lower sensitivity, specificity, and greater misclassification error at almost all cutoff points except the 5th percentile. ( and S2). The output of the full, parsimonious, and the ACR models was compared using hypothetical examples (; ). The ACR model had a small range of probability outputs compared to the study models.
Figure 3 Prediction risk profile using the full model and Case 4 of .
Abbreviations: CRP, C-reactive protein; GCA, giant cell arteritis; ESR, erythrocyte sedimentation rate; GCAonBx, biopsy-proven giant cell arteritis.
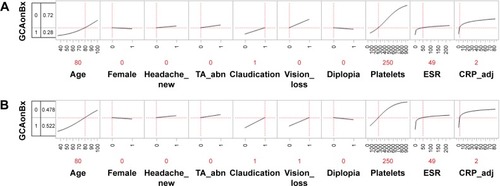
Table 6 Hypothetical cases comparing the full, parsimonious, and American College of Rheumatology models
In the full model, no subject with probability score <0.027 had a positive TABx, suggesting that 7% of the TABx in this study could have been avoided. A probability score of ≤0.07 corresponded with a 95% chance of negative TABx and approximately 30% of the patients in our negative biopsy group had a probability score of ≤0.07. A probability score of 0.23 approximates the 25th percentile of the positive TABx group, and a score of 0.43 was the median value of the positive biopsy group, and was considered high risk for GCA. A probability score of ≥0.89 was not seen in patients with a negative biopsy.
Discussion
Several prediction algorithms for GCA diagnosis have been published,Citation8,Citation11,Citation12,Citation17,Citation19,Citation24,Citation28 (Table S3) with the common goal of improving diagnostic accuracy and patient selection for TABx and for reducing patient morbidity and health care expenditures. Compared to other prediction algorithms, the following are the strengths and distinguishing features of our study:
Its large size, validation, and generalizability. Our study had sufficient GCA events to support more than 10 candidate predictor variables with LR. The 0.80 (95% CI =0.76–0.85) c-statistic from combined internal bootstrap cross-validation and multiple imputations supports reproducibility of the prediction model. On geographic external validation, the c-statistic was found to range from 0.69 to 0.82 for the full model and even better for the parsimonious model. Generalizability is further enhanced by the collection of TABx results from seven different medical centers with an almost equal proportion of patients referred from ophthalmic and non-ophthalmic practices.
Its design to independently predict the risk of GCA prior to TABx. Although TABx is usually a benign test, it is invasive and time-consuming. Ideally risk calculators should portend the risk of GCA prior to TABx to guide decision making. The ACR criteriaCitation8 and other LR modelsCitation11,Citation23 entreaty input of the TABx result or specimen length. The performance of our model was also directly compared against the 1990 ACR classification criteria.
The employment of four statistically significant objective predictors (age, platelets, logCRP, and ischemic VL), the first three of which were maintained as continuous variables to preserve statistical power.Citation29 Prediction algorithms heavily based on patient symptomsCitation23 may be disadvantageous when the physician has cognitive or affective biases,Citation30 or when patient responses are ambiguous. Many guidelines or prediction rules do not incorporate CRPCitation15,Citation17 and/or platelet count,Citation8,Citation11 which are more accurate than ESR in the diagnosis of GCA.Citation31 Prediction rules that incorporate ESR, CRP, and platelet count are laudableCitation13 but can be improved by the addition of patient symptoms, such as jaw claudication.
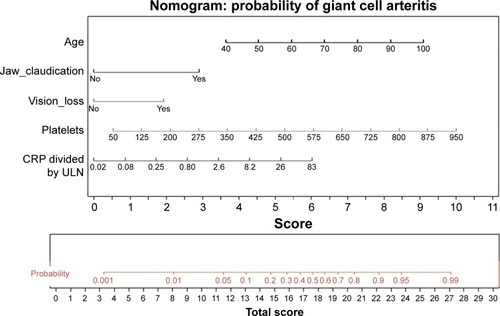
Provision of an output probability nomogram () and online calculator for the risk of GCA (https://docs.google.com/spreadsheets/d/1wlRFGleW2Vf-LlylmY76KSTzIAf1TrX5U_1770HhD1Y/edit?usp=sharing). Prior GCA studies have used univariate probability curves,Citation31 theoretical decision analysis tables,Citation15 scoring systems,Citation13,Citation20 or risk calculators,Citation11 but many only provide odds ratios,Citation12,Citation16,Citation17,Citation24 or likelihood ratiosCitation14 that require extensive calculation to determine the output probability of GCA. The length and location of our nomogram scales visually communicate the statistical importance of each covariate and the probability for GCA is enumerated from simple addition, rather than odds ratios or likelihood ratios.
Figure 4 Nomogram of parsimonious model.
Abbreviations: CRP, C-reactive protein; ULN, upper limit of normal.
Our work agrees with previous studies that have shown jaw claudication,Citation12,Citation16,Citation17,Citation23 age,Citation23 and thrombocytosis and elevated CRPCitation31,Citation32 to be statistically significant predictors for GCA. The odds ratio of 1.005× for platelet level seems outwardly small, but platelets were a continuous variable with a wide range. For a 50 unit increase in platelets, the odds ratio for positive TABx was found to be 1.29×, and for a 100 unit increase in platelets, the odds ratio was found to be 1.66×.
We also found that log CRP and ischemic VL were useful predictors for GCA. Few prediction rules incorporate CRP,Citation31,Citation32 in part due to epoch, lack of statistical power, and/or missing data.Citation23 In our study, 20% of the patients had missing CRP data as it was sometimes not requisitioned prior to glucocorticoid initiation, and some practitioners only requisition the ESR and not the CRP values in patients with suspected GCA or vice versa. In some institutions, the result of CRP test takes longer to return than the ESR test, and may not be available or recorded prior to referral for consideration of biopsy. Some private labs did not offer CRP testing. The health care facility where the patient was initially assessed may differ from the location where TABx was performed, making it more difficult to find the results retrospectively. As CRP and other predictors may not have been missing completely at random, multiple imputation was performed, which did not suggest bias of note in the missing data.
VL is one of the most feared complications of GCA, and absent from most rheumatology-based prediction schemas. In our study, half of the patients were referred by ophthalmologists; disc edema and retinal artery occlusion proved to be compelling predictors for GCA.
In contrast to other reports,Citation12,Citation24,Citation33 diplopia and new onset headache were not statistically significant predictors in this study. This may be because VL was a more common eye finding, and patients with monocular VL have little or no binocular diplopia. Six subjects had diplopia and ischemic VL, but only one had BPGCA. Since half of our patients originated from ophthalmologists, the complaint of diplopia should have been well scrutinized, and this may also account for bias compared to some rheumatology studies.
Headache is a common complaint in the elderly with up to 51% of the individuals at 65 years of age or older have this symptom.Citation34 Although ANOVA did not support geographic heterogeneity in the frequency of cephalgia, a standardized definition for the new onset headache of GCA may render headache a more discriminating predictor. The International Classification of Headache Disorders’ criteria specifies headache in close temporal relation to other signs and symptoms of GCA, worsening of headache in parallel to worsening GCA, and improvement of headache after 3 days of high dose glucocorticoids.Citation35
Statistical significance should be but one consideration in predictive modeling. Although parsimonious models save time and facilitate ease of use with nomograms, the spreadsheet calculator was generated for the full model; each of our study covariates is referenced in the literature as clinically significant, and as such, the full model may better control for confounding and bias. Although gender was not statistically significant, it is an expected control variable in most medical studies. The temporal arterial abnormality predictor variable became statistically significant on multiple imputation estimates. Predictors associated with a particular hypothesis can be retained, even if they are not statistically significant. It was hypothesized that if VL was an important predictor of GCA, there would be fewer tendencies for binocular diplopia. Our sample was large enough such that the covariates with p>0.05 had a negligible effect on the statistical degrees of freedom. Another important reason for covariate retention is because variables with high statistical significance are not necessarily highly predictive, due to different properties of their underlying distribution. Sets of variables with predictive power above a certain threshold may differ from variable modules identified by statistical significance-based criterion such as the chi-square test.Citation36
Although our study appears to be the largest TABx prediction rule study to date, and the only one with external validation, the limited size of our external validation (EV) sets is a potential weakness. ANOVA showed that six of the covariates were statistically significant regional case-mix, which likely accounts for the heterogeneous discrimination scores. The Rochester group had the lowest EV c-statistic, and the lowest proportion of temporal artery tenderness/decreased pulse, average platelet values, and training validation ratio (10%). The Mayo series is more likely to be a referral cohort, with possible atypical presentations of GCA.Citation17 The three smallest individual datasets, which comprised the “combined” EV set, had a higher proportion of positive TABx and may reflect referral bias or selection bias. The fair to good EV c-statistics AUROCEV (0.688–0.824 for the full model and 0.750–0.845 for the parsimonious model) in the setting of diverse regional case-mix suggests that our model is transportable. As our data came from seven different centers, the AUROC confidence intervals for the bootstrapped 10-fold internal validation (0.757–0.849) for the full model and 0.766–0.854 for the parsimonious model may be more representative than those from the geographic validation. Further collaborative, international studies such as the DCVASCitation37 may achieve the minimum size validation sets of 100 events and 100 non-events suggested for EV of LR prediction rules.Citation25
Our study had some limitations, which includes its retrospective nature with missing data, the constraint to BPGCA, and misclassification rate. Retrospective studies performed at different institutions may not have uniform definitions of jaw claudication, clinical temporal arterial abnormality, and recent onset headache, which can be inherently subjective assessments. With 10 predictor variables, missing data was not unexpected in a retrospective study. Multiple imputation analysis of the missing data showed minimal bias.
This study targets BPGCA. With the exception of Grossman,Citation24 most studies do not incorporate biopsy-negative GCA (BNGCA). Patients with BNGCA may have more headaches and polymyalgia rheumatica but less visual complications and jaw claudication than BPGCA and may require a different set of decision rules.Citation24,Citation38 TABx is the gold standard for BPGCA, but “there are no independent validating criteria to determine whether giant cell arteritis is present when a temporal artery biopsy is negative”.Citation39 The schema of Ellis and Ralston,Citation40 was utilized by Vilaseca et alCitation41 for BNGCA, but has not been widely applied. Unless imaging studies show evidence of vessel abnormality, the diagnosis of BNGCA relies on clinical judgment, exhaustive anamnesis,Citation23 and amelioration with systemic glucocorticoids in the absence of neoplasm. BNGCA may result from inadequate specimen length and skip areas, but routine bilateral biopsies are not strongly advocated and specimen lengths of 1.5 cm appear to be adequate.Citation42–Citation44 A review of 240 TABx found that specimen length was not associated with the diagnostic yield of TABx.Citation45 Others report fixed TABx length of 0.5 cmCitation26 (n=1,520 TABx), 0.7 cm (n=966 TABx),Citation27 or 1.5 cmCitation46 (n=538 TABx) as the possible optimum length threshold TABx length to predict GCA and avoid false negative TABx. There was no statistically significant difference in the lengths of TABx in the positive or negative biopsy groups in our study, 90% of which had a fixed length >1 cm in both groups.
Although our prediction model outperformed the non-histologic ACR classification criteria, at a probability cutoff point of 0.5, there remained an 18.1% misclassification rate with a sensitivity and specificity of 45.9% and 94.2%, respectively. To improve future models, large prospective studies or “big datasets” with standardized predictor definitions, additional clinical criteria (eg, neck pain, weight loss, fever), and objective predictors such as ocular pulse amplitude,Citation21 OCT ultrasound, MRI of the arteries, HLA-DRB1*04,Citation47 and genetic markers should be considered. Alternative prediction schemas such as neural networksCitation10 and support vector machineCitation28 can be compared with LR models.
In patients with suspected GCA whose blood results have not been clouded by high dose glucocorticoids, a possible clinical interpretation of the probability values from our cohort of 530 patients is summarized in . Since no subject with probability score <0.024 had BPGCA, TABx can probably be avoided in these patients. With GCA probability scores <0.07, the clinician and patient may contemplate deferral of TABx and glucocorticoids with close observant management. Patients with probability scores between 0.7 and 0.23 are at low to moderate risk of GCA and should be considered for TABx and glucocorticoid treatment. Probability scores in the range of 0.24–0.43 are at moderate to high risk of GCA, and scores ≥0.43 are at high risk of GCA. Although some may argue that TABx could be avoided with a ≥0.89 probability score, the authors endorse pathologic confirmation, given the side effects of prolonged glucocorticoid treatment and the occasional alternative diagnoses obtained from TABx.
Table 7 Probability score cutoff points and risk of GCA
Conclusion
We developed and validated a LR prediction model for BPGCA. Jaw claudication, platelet levels, log CRP, ischemic VL, and age were statistically significant predictors for positive TABx. Prediction models are not infallible and cannot substitute for clinical acumen or pathologic confirmation. However, they organize decision making and help systematize the decision to perform TABx.
Acknowledgments
We thank Drs Knecht and Bachmann for the use of their published data.Citation20
Disclosure
The authors report no conflicts of interest in this work.
References
- De SmitEPalmerAJHewittAWProjected worldwide disease burden from giant cell arteritis by 2050J Rheumatol201542111912525362658
- KermaniTASchmidtJCrowsonCSUtility of erythrocyte sedimentation rate and C-reactive protein for the diagnosis of giant cell arteritisSemin Arthritis Rheum201241686687122119103
- DaviesCGMayDJThe role of temporal artery biopsies in giant cell arteritisAnn R Coll Surg Engl20119314521418754
- PieriAMilliganRHegdeVHennessyCTemporal artery biopsy: are we doing it right?Int J Health Care Qual Assur201326655956324003755
- QuinnEMKearneyDEKellyJKeohaneCRedmondHPTemporal artery biopsy is not required in all cases of suspected giant cell arteritisAnn Vasc Surg201226564965422285348
- HussainOMcKayAFairburnKDoylePOrrRDiagnosis of giant cell arteritis: when should we biopsy the temporal artery?Br J Oral Maxillofac Surg201654332733026786198
- CristaudoATMizumotoRHendahewaRThe impact of temporal artery biopsy on surgical practiceAnn Med Surg (Lond)201611475127699002
- HunderGGBlochDAMichelBAThe American college of rheumatology 1990 criteria for the classification of giant cell arteritisArthritis Rheum1990338112211282202311
- HunderGGThe use and misue of classification and diagnostic criteria for complex diseasesAnn Intern Med199812954174189735071
- AstionMLWenerMHThomasRGHunderGGBlochDAApplication of neural networks to the classification of giant cell arteritisArthritis Rheum19943757607708185705
- González-LópezJJGonzález-MoralejaJRebolledaGMuñoz-NegreteFJA calculator for temporal artery biopsy result prediction in giant cell arteritis suspectsEur J Intern Med2014258e98e10025129703
- Rodriguez-ValverdeVSarabiaJMGonzález-GayMARisk factors and predictive models of giant cell arteritis in polymyalgia rheumaticaAm J Med199710243313369217613
- WeisETorenAJordanDPatelVGilbergSDevelopment of a predictive model for temporal artery biopsiesCan J Ophthalmol Epub2017628
- BelliveauMJTen HoveMWGiant cell arteritisCMAJ2011183558121324850
- NiederkohrRDLevinLAManagement of the patient with suspected temporal arteritis. a decision-analytic approachOphthalmology2005112574475615878052
- RieckKLKermaniTAThomsenKMHarmsenWSKarbanMJWarringtonKJEvaluation for clinical predictors of positive temporal artery biopsy in giant cell arteritisJ Oral Maxillofac Surg2011691364020674120
- GabrielSEO’FallonWMAchkarAALieJTHunderGGThe use of clinical characteristics to predict the results of temporal artery biopsy among patients with suspected giant cell arteritisJ Rheumatol199522193967699690
- CollinsGSReitsmaJBAltmanDGMoonsKGTransparent reporting of a multivariable prediction model for individual prognosis or diagnosis (TRIPOD): the TRIPOD statementBMJ20151625563
- TorenAWeisEPatelVMonteithBGilbergSJordanDClinical predictors of positive temporal artery biopsyCan J Ophthalmol201651647648127938961
- KnechtPBBachmannLMThielMALandauKKaufmannCOcular pulse amplitude as a diagnostic adjunct in giant cell arteritisEye (London)2015297860865
- IngEPagnouxCLutchmanCDynamic contour tonometry to measure ocular pulse amplitude in patients with suspected giant cell arteritisPaper presented at: North American Neuro-ophthalmology Society 43rd Annual MeetingApril 4; 2017Washington, DC
- ChenJJLeavittJAFangCCrowsonCSMattesonELWarringtonKJEvaluating the incidence of arteritic ischemic optic neuropathy and other causes of vision loss from giant cell arteritisOphthalmology201612391999200327297405
- González-LópezJJGonzález-MoralejaJBurdaspal-MoratillaARebolledaGNúñez-Gómez-ÁlvarezMTMuñoz-NegreteFJFactors associated to temporal artery biopsy result in suspects of giant cell arteritis: a retrospective, multicenter, case-control studyActa Ophthalmol201391876376822938720
- GrossmanCBarshackIKoren-MoragNBen-ZviIBornsteinGBaseline clinical predictors of an ultimate giant cell arteritis diagnosis in patients referred to temporal artery biopsyClin Rheumatol20163571817182226925851
- VergouweYSteyerbergEWEijkemansMJHabbemaJDSubstantial effective sample sizes were required for external validation studies of predictive logistic regression modelsJ Clin Epidemiol200558547548315845334
- MahrASabaMKambouchnerMTemporal artery biopsy for diagnosing giant cell arteritis: the longer, the better?Ann Rheum Dis200665682682816699053
- YpsilantisECourtneyEDChopraNImportance of specimen length during temporal artery biopsyBr J Surg201198111556156021706476
- LeeMDe SmitEWong Ten YuenASarossyMThe use of statistical modeling to predict temporal artery biopsy outcome from presenting symptoms and laboratory resultsActa Ophthalmol201492S253
- CumberlandPMCzannerGBunceCDoreCJFreemantleNGarcia-FinanaMOphthalmic Statistics GroupOphthalmic statistics note: the perils of dichotomising continuous variablesBr J Ophthalmol201498684184324682179
- SaposnikGRedelmeierDRuffCCToblerPNCognitive biases associated with medical decisions: a systematic reviewBMC Med Inform Decis Mak201616113827809908
- WalvickMDWalvickMPGiant cell arteritis: laboratory predictors of a positive temporal artery biopsyOphthalmology201111861201120421232803
- CostelloFZimmermanMBPodhajskyPAHayrehSSRole of thrombocytosis in diagnosis of giant cell arteritis and differentiation of arteritic from non-arteritic anterior ischemic optic neuropathyEur J Ophthalmol200414324525715206651
- SmetanaGWShmerlingRHDoes this patient have temporal arteritis?JAMA200228719210111754714
- PrencipeMCasiniARFerrettiCPrevalence of headache in an elderly population: attack frequency, disability, and use of medicationJ Neurol Neurosurg Psychiatry200170337738111181862
- International Headache Society, Headache Classification Committee6.4.1 Headache attributed to giant cell arteritis (GCA)The International Classification of Headache Disorders 3rd edition (Beta version)2016 Available from: https://www.ichd-3.org/6-headache-attributed-to-cranial-or-cervical-vascular-disorder/6-4-headache-attributed-to-arteritis/6-4-1-headache-attributed-to-giant-cell-arteritis-gca/Accessed August 16, 2017
- LoAChernoffHZhengTLoSWhy significant variables aren’t automatically good predictorsProc Natl Acad Sci U S A201511245138921389726504198
- RobsonJWattsRGraysonPAB0757 EULAR/ACR diagnostic and classification criteria of systemic vasculitis (DCVAS) study updateAnn Rheum Dis201371Suppl 3681
- Gonzalez-GayMAGarcia-PorruaCLlorcaJGonzalez-LouzaoCRodriguez-LedoPBiopsy-negative giant cell arteritis: clinical spectrum and predictive factors for positive temporal artery biopsySemin Arthritis Rheum200130424925611182025
- NesherGThe diagnosis and classification of giant cell arteritisJ Autoimmun201448–497375
- EllisMERalstonSThe ESR in the diagnosis and management of the polymyalgia rheumatica/giant cell arteritis syndromeAnn Rheum Dis19834221681706847261
- VilasecaJGonzálezACidMCLopez-VivancosJOrtegaAClinical usefulness of temporal artery biopsyAnn Rheum Dis19874642822853592783
- MukhtyarCGuillevinLCidMCEuropean Vasculitis Study GroupEULAR recommendations for the management of large vessel vasculitisAnn Rheum Dis200968331832318413441
- BienvenuBLyKHLambertMGroupe d’Étude Français des Artérites des gros Vaisseaux, under the Aegis of the Filière des Maladies Auto-Immunes et Auto-Inflammatoires RaresManagement of giant cell arteritis: recommendations of the French study group for large vessel vasculitis (GEFA)Rev Med Interne201637315416526833145
- DasguptaBBorgFAHassanNBSR and BHPR Standards, Guidelines and Audit Working GroupBSR and BHPR guidelines for the management of giant cell arteritisRheumatology (Oxford)20104981594159720371504
- GrossmanCBen-ZviIBarshackIBornssteinGAssociation between specimen length and diagnostic yield of temporal artery biopsyScand J Rheumatol201746322222527440169
- OhLJWongEGillAJMcCluskeyPSmithJEValue of temporal artery biopsy length in diagnosing giant cell arteritisANZ J Surg Epub2016111
- MackieSLTaylorJCHaroon-RashidLUK GCA ConsortiumUKRAG ConsortiumAssociation of HLA-DRB1 amino acid residues with giant cell arteritis: genetic association study, meta-analysis and geo-epidemiological investigationArthritis Res Ther201517119526223536