
Abstract
Purpose
To evaluate the hypotenuse of the vertical optic nerve head cup (HVOC), measured using the length and depth of the cup obtained with enhanced depth imaging spectral-domain optic coherence tomography (SD-OCT), as a biomarker for glaucoma diagnosis.
Methods
This was a prospective cross-sectional study of patients with glaucoma and controls. SD-OCT was performed in all participants to assess average circumpapillary retinal nerve fiber layer (RNFL) thickness. A vertical B-scan of the optic nerve head (ONH) was obtained for HVOC measurement. The length and depth of the optic nerve cup formed the sides of a right triangle that were used to calculate the HVOC. Participants also underwent standard automated perimetry.
Results
One hundred and fifty-six eyes were divided into three groups: mean deviation (MD) <−7 dB (60 eyes); MD ≥−7 dB (74 eyes); and healthy subjects (22 eyes). The mean (SD) HVOC in these groups was 1,419.8 (347.2) µm, 1,234.6 (258.8) µm, and 685.79 (315.4) µm (P<0.01), respectively. In the secondary structure–function analysis, only discs with a vertical diameter of 1.51–2.00 mm were included (120 eyes). The HVOCs were divided into four percentile groups, with the following means: 940, 1,128, 1,390, and 1,662 µm. There was a significant difference in MD between percentile groups 1 and 3 (P<0.03), 1 and 4 (P<0.001), 2 and 3 (P<0.02), and 2 and 4 (P<0.001). RNFL thickness differed among all percentile groups (P<0.001).
Conclusion
HVOC may provide an additional morphometric biomarker for the structural evaluation of ONH remodeling in glaucoma.
Introduction
The relationship between structural and functional damage is an important component of glaucoma diagnosis and management.Citation1–Citation3 The structural evaluation of the optic nerve head (ONH), retinal nerve fiber layer (RNFL), and macula using optical coherence tomography (OCT) provides important clinical information and is a useful tool for the diagnosis of glaucoma and assessment of its progression.Citation4–Citation11
The development of spectral-domain OCT (SD-OCT) has improved test speed and resolution compared to time-domain OCT.Citation12 Scan speeds between 29,000 and 70,000 Hz and an axial resolution of up to 2 µm can be demonstrated.Citation13,Citation14 Other features used to improve image quality in some commercially available SD-OCT devices include the automated real time (ART) mode for image averaging, noise reduction, and an eye-tracking system that follows the saccades.Citation15 Enhanced depth imaging (EDI) OCT described by Spaide et al was originally developed to visualize the full thickness of the choroid, but it has also been used to evaluate the lamina cribrosa (LC) and deep ONH structures.Citation16–Citation18 Swept source OCT (SS-OCT) is a novel technology that can reach even higher scan speed rates (up to 400 KHz) with increased penetration, emerging as a promising tool for the assessment of the choroid and LC.Citation19
Notwithstanding the improvements in technology, the structural evaluation of glaucoma still includes important evidence-based clinical parameters, such as optic disc appearance and size, neuroretinal rim tissue, presence of hemorrhage, peripapillary atrophy, and cup-to-disc ratio (CDR).Citation20–Citation23 OCT may enable further evaluation of morphometric and topographic parameters of the ONH, such as CDR, cup volume, rim area, and rim volume.Citation24 The minimum rim area assessed by SD-OCT, based on the shortest distance from the Bruch’s membrane opening (BMO) to the internal limiting membrane (ILM), has been correlated with RNFL thickness and visual field mean deviation (MD).Citation25,Citation26
Deep ONH structures, such as LC, as well as LC defects and posterior LC displacement can be evaluated using EDI SD-OCT.Citation17,Citation27–Citation29 Posterior LC displacement has been demonstrated as an important histopathological hallmark of deformation of glaucomatous ONH in experimental glaucoma and in studies using postmortem glaucomatous eyes.Citation30–Citation32
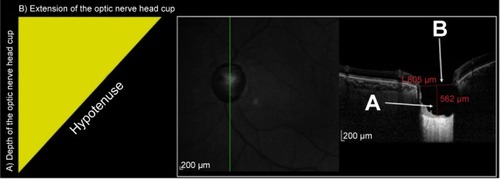
The purpose of this study was to evaluate the hypotenuse of the vertical optic nerve head cup (HVOC) as a novel morphometric biomarker for the assessment of ONH using EDI SD-OCT. The vertical B-scan with the largest cup seen on infrared is used for HVOC measurement. The depth of the posterior LC displacement, measured from the BMO level, and the length of the vertical cup form the sides of a right triangle that are used to calculate the hypotenuse. The authors hypothesize that HVOC is a useful parameter for the quantitative evaluation of ONH remodeling in glaucoma.
Methods
The study was approved by the Ethics Committees of Hospital de Clínicas de Porto Alegre and Universidade Federal de São Paulo and was registered at Plataforma Brasil, the Brazilian national research directory (registration number: 53521916.2.3001.5505). Written informed consent was obtained from all participants. The study followed the tenets of the Declaration of Helsinki.
This was a prospective non-interventional cross-sectional study of patients evaluated for open-angle glaucoma at Hospital de Clínicas de Porto Alegre. All patients were evaluated according to an established clinical protocol that includes a broad review of medical history and a comprehensive ophthalmic examination.
Participants
Eligible participants were all patients with a diagnosis of glaucoma defined as the presence of characteristic optic disc and retinal changes, such as neuroretinal rim thinning, RNFL defect, localized notching, and splinter hemorrhage, and at least one intraocular pressure (IOP) measurement >21 mmHg. Participants with ocular or systemic conditions that could affect the optic nerve or examination results were excluded. Exclusion criteria for glaucoma cases were cognitive impairment, eye diseases (including diabetic retinopathy and retinal vein occlusion), trauma, dense cataract, and previous ocular surgery that could influence the results of standard automated perimetry (SAP) or the measurements made with OCT. Poor-quality images with a Q score <20 were disqualified.
Patients with glaucoma were arbitrarily divided into two groups based on visual field MD: patients with an MD worse than −7 dB and patients with an MD ≥−7 dB, including those with optic disc findings characteristic of glaucoma and no SAP changes (preperimetric glaucoma).
Controls had an IOP between 10 and 21 mmHg, normal SAP, optic disc within normal limits, and normal appearing iridocorneal angles. Inclusion criteria for controls were age between 18 and 60 years, clear media, and good cooperation during examination. Exclusion criteria were an IOP >21 mmHg, optic discs suspected of having glaucoma (with one of the following conditions: CDR >0.5, hemorrhage, or RNFL defect evaluated clinically), visual field defects meeting the Anderson criteria for glaucoma, and any previous ocular disease or ocular surgery.
Study protocol
Participants provided a detailed medical and ophthalmic history and underwent ophthalmic examination including slit-lamp biomicroscopy, IOP measurements using applanation tonometry, gonioscopy, and dilated fundus examination. All participants underwent SD-OCT (Spectralis OCT; Heidelberg Engineering GmbH, Dossenheim, Germany). The SD-OCT protocol included a 3.45-mm circular scan to determine circumpapillary RNFL thickness. The 3.45-mm scan circle was then positioned manually at the center of the optic disc, and, using the image of the ONH, a vertical B-scan was obtained with the EDI mode for HVOC measurement. The EDI mode places the zero delay at the bottom of the screen without inverting the images, thus enhancing visualization of deeper ONH layers. All participants also underwent SAP (Humphrey VF Analyzer, 24-2 SITA-Standard strategy; Carl Zeiss Meditec AG, Jena, Germany). A SAP defect was defined as the presence of at least three contiguous points within the same hemifield on the pattern deviation plot at a P<5% level and one of which is depressed at a P<1% level, and a glaucoma hemifield test outside normal limits. Unreliable SAP measurements were disqualified. All included participants with glaucoma had previous SAP measurements. Perimetry and OCT were performed within a 3-month period.
HVOC measurement
HVOC was measured by an experienced examiner. For each patient, the vertical B-scan with the largest identifiable vertical cup on the infrared imaging mode of the SD-OCT device was selected for HVOC measurement. The eye-tracking system was used to place the vertical line on the exact location selected by the examiner, and the ART mode was used for noise reduction. The 1:1 ratio was used to obtain B-scans. B-scans with a Q score <20 were disqualified. Measurements were made using the caliper provided by the software. The length and depth of the cup were measured and formed the sides of a right triangle that were used to calculate the HVOC. The first line, which was measured at the BMO level starting at the innermost portion of the descending RNFL tissue (ILM level) and connecting to the opposite side, represented the length of the cup. A second line starting at the former line and ending at the deepest portion of the anterior prelaminar tissue at the middle third of the cup represented the depth of the cup. The Pythagorean theorem was then used to calculate the hypotenuse of the triangle: c2 = a2 + b2, where c is the HVOC and a and b are the length and depth of the cup that represent the lengths of the two sides of the right triangle ().
Figure 1 Measurement of the hypotenuse of the vertical optic nerve head cup using the depth (A) and length (B) of the cup as the sides of a right-angled triangle whose hypotenuse is calculated by the Pythagorean theorem.
Statistical analysis
Baseline characteristics were compared using generalized estimating equations (GEE), which take into account the correlation between both eyes of the same individual. A generalized linear model, with coefficients obtained by GEE, was used to correlate and compare variables. A P-value <0.05 was considered to be statistically significant. SPSS, version 22.0 (IBM Corporation, Armonk, NY, USA), was used for statistical analysis.
Results
ONH was evaluated using the EDI mode of the Spectralis OCT device in 156 eyes of 95 participants. Demographic data are summarized in . In the glaucoma group, mean (SD) age was 69.7 (9.8) years for patients with MD <−7 dB and 68.2 (10.1) years for patients with MD ≥−7 dB. Mean (SD) age was 40.1 (14.2) years in the control group.
Table 1 Demographic characteristics of study participants
The global average RNFL thickness was significantly different between the three groups (; ) (P<0.001).
Figure 2 Box plot of average circumpapillary retinal nerve fiber layer (RNFL) thickness.
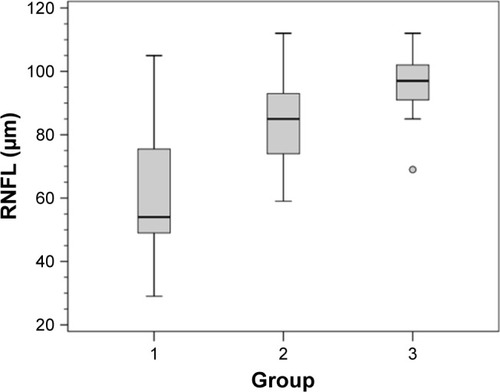
Table 2 Global average and median circumpapillary RNFLthickness measured by SD-OCT
The SAP MD mean was −16.7 dB (6.8) and −2.5 dB (2.0) for the glaucoma groups with MD <−7 dB and MD ≥−7 dB, respectively, and −1.7 dB (3.7) for controls (P<0.01). The correlation between average RNFL thickness and MD in our population was r=0.681 (P<0.001).
HVOC measurement
The components of HVOC are described in . The values obtained for HVOC and the length of the cup were significantly different between the three groups (P<0.01), while the depth values were significantly different only between groups 1 and 3 and between groups 2 and 3.
Table 3 Mean extension and mean depth of the vertical optic nerve head cup and the hypotenuse between these values
HVOC was also analyzed within the different vertical diameters of the optic disc: <1.5 mm (); between 1.5 and 2.0 mm (); and >2.0 mm (). A significant difference was found between the three groups in different optic disc diameters, except for groups 1 and 2 with an optic disc diameter <1.5 mm, which showed only a borderline significance ().
Figure 3 Box plot of the mean hypotenuse of the vertical optic nerve head cup for glaucoma groups and controls in different vertical diameters of the optic disc.
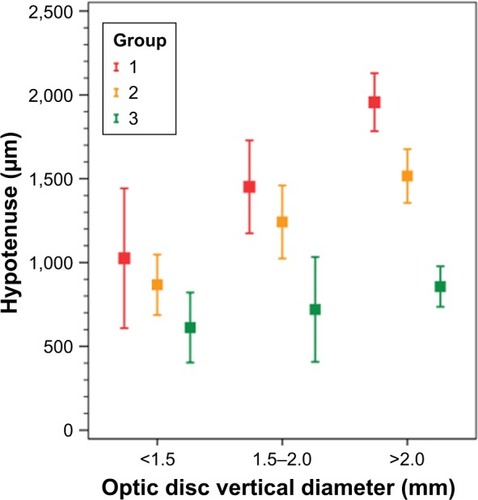
Table 4 Mean (SE) of the hypotenuse of the vertical optic disc in nerves with vertical diameter <1.5 mm and the significance between groups (n=20)Table Footnotea
Table 5 Mean (SE) of the hypotenuse of the vertical optic disc in nerves with vertical diameter between 1.50 and 2.00 mm and the significance between groups (n=120)Table Footnotea
Table 6 Mean (SE) of the hypotenuse of the vertical optic disc in nerves with vertical diameter >2.0 mm and the significance between groups (n=16)Table Footnotea
Structure–function correlation of HVOC with SAP MD and structure–structure correlation of HVOC with RNFL thickness
The structure–function and structure–structure correlations of HVOC with SAP MD and RNFL thickness were analyzed using 120 eyes with an optic disc diameter between 1.5 and 2.0 mm. The correlation of HVOC with MD was r=−0.47 (P<0.001) (length of the cup: r=−0.539; depth of the cup: r=−0.131) (). The correlation of HVOC with RNFL thickness was r=−0.64 (P<0.001) ().
Figure 4 Scatter plot of the correlation between the mean deviation (MD) of standard automated perimetry and the hypotenuse of the vertical optic nerve head cup.
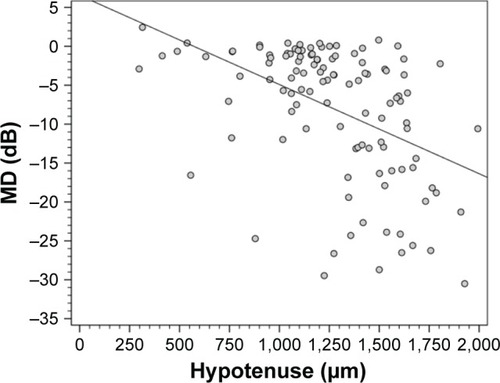
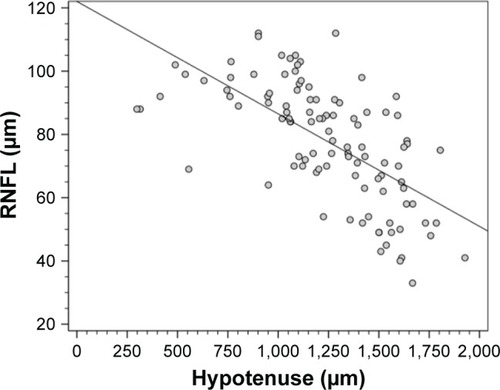
Figure 5 Scatter plot of the correlation between peripapillary retinal nerve fiber layer (RNFL) thickness measured by spectral-domain optical coherence tomography and the hypotenuse of the vertical optic nerve head cup.
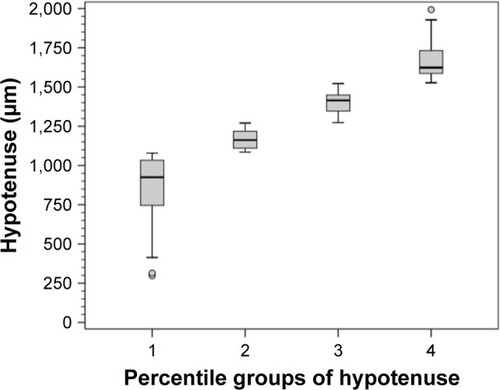
The 120 eyes were further divided into four percentile groups according to their HVOC value. The mean HVOC values in each percentile group are as follows: group 1: 940 µm; group 2: 1,128 µm; group 3: 1,390 µm; and group 4: 1,662 µm ().
Figure 6 Box plot of the percentile groups of the hypotenuse of the vertical optic nerve head cup.
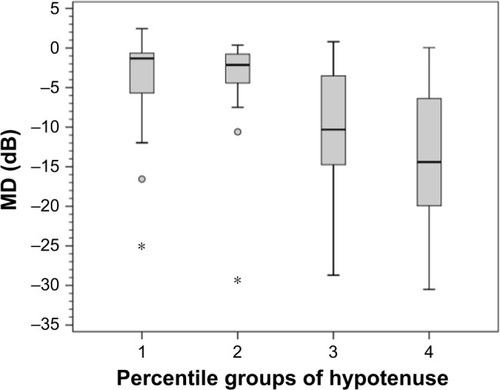
The mean (standard error [SE]) and 95% confidence interval (95% CI) of SAP MD in each HVOC percentile group are as follows: group 1: −4.70 (1.2) dB (95% CI −7.1 to −2.2); group 2: −5.10 (1.0) dB (95% CI −7.2 to −2.9); group 3: −10.40 (1.4) dB (95% CI −13.2 to −7.6); and group 4: −12.90 (1.4) dB (95% CI −15.7 to −10.0). There was a statistically significant difference in SAP MD between groups 1 and 3 (P<0.03), groups 1 and 4 (P<0.001), groups 2 and 3 (P<0.02), and groups 2 and 4 (P<0.001). A borderline significance was observed between groups 3 and 4 (P<0.08) ().
Figure 7 Box plot of the mean deviation (MD) of standard automated perimetry in each percentile group of the hypotenuse of the vertical optic nerve head cup.
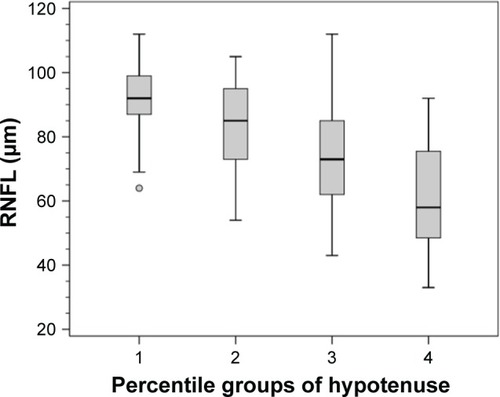
The mean (SE) and 95% CI of RNFL thickness in each HVOC percentile group are as follows: group 1: 91.7 (2.5) µm (95% CI 87.3–96.2); group 2: 83.2 (2.5) µm (95% CI 78.1–88.2); group 3: 71.1 (3.3) µm (95% CI 64.6–72.6); and group 4: 62.6 (2.97) µm (95% CI 56.2–69.3). There were statistically significant differences between all groups: 1 versus 2 (P<0.04); 1 versus 3 (P<0.001); 1 versus 4 (P<0.001); 2 versus 3 (P<0.03); 2 versus 4 (P<0.001); and 3 versus 4 (P<0.036) ().
Figure 8 Box plot of circumpapillary retinal nerve fiber layer (RNFL) thickness measured by spectral-domain optical coherence tomography in each percentile group of the hypotenuse of the vertical optic nerve head cup.
shows the distribution of eyes with glaucoma (MD < and ≥−7 dB) and without glaucoma (controls) among HVOC percentile groups. The presence of controls was significantly higher in HVOC percentile group 1, while the presence of glaucoma with an MD worse than −7 dB was significantly higher in percentile groups 3 and 4.
Table 7 Distribution of eyes with and without glaucoma among the four percentile groups of the HVOC
Clinical examples of glaucomatous eyes in each HVOC percentile group are shown in –.
Figure 9 Structural and functional findings in a glaucomatous eye in percentile group 1 of the HVOC (mean =940 µm, mean MD =−4.70 (1.2) dB). (A) Circumpapillary RNFLT; (B) standard automated perimetry grayscale map; (C) B-scan of the largest vertical optic disc cup and length and depth used to calculate the HVOC.
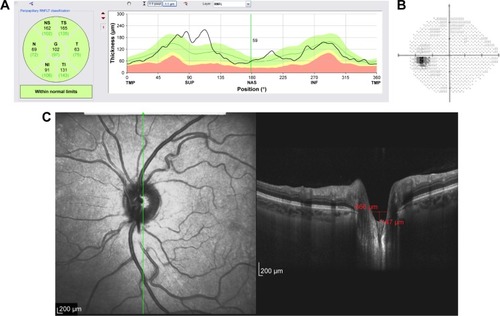
Figure 10 Structural and functional findings in a glaucomatous eye in percentile group 2 of the HVOC (mean =1,128 µm, mean MD =−5.10 (1.0) dB). (A) Circumpapillary RNFLT; (B) standard automated perimetry grayscale map; (C) B-scan of the largest vertical optic disc cup and length and depth used to calculate the HVOC.
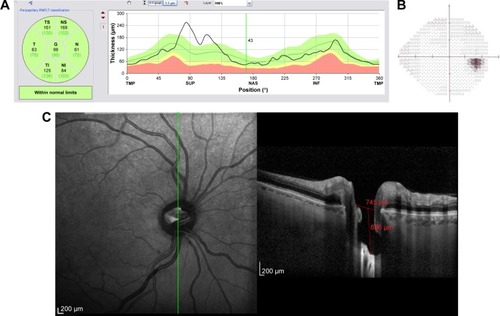
Figure 11 Structural and functional findings in a glaucomatous eye in percentile group 3 of the HVOC (mean =1,390 µm, mean MD =−10.40 (1.4) dB). (A) Circumpapillary RNFLT; (B) standard automated perimetry grayscale map; (C) B-scan of the largest vertical optic disc cup and length and depth used to calculate the HVOC.
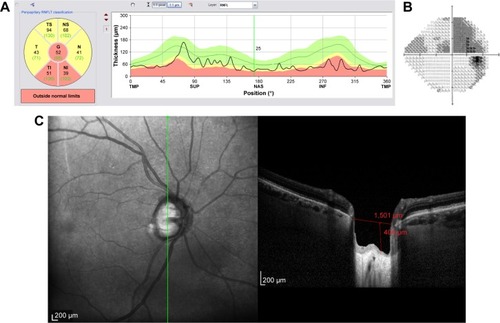
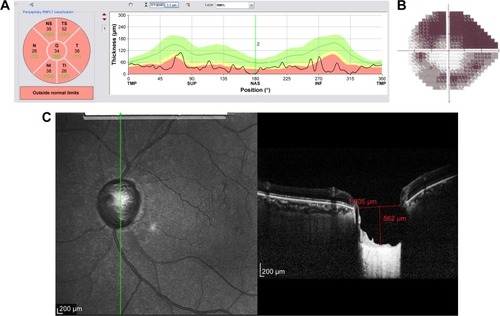
Figure 12 Structural and functional findings in a glaucomatous eye in percentile group 4 of the HVOC (mean =1,662 µm, mean MD =−12.90 (1.4) dB). (A) Circumpapillary RNFLT; (B) standard automated perimetry grayscale map; (C) B-scan of the largest vertical optic disc cup and length and depth used to calculate the HVOC.
Discussion
The present study evaluated HVOC, a novel structural parameter for the multimodal assessment of glaucoma, using the EDI mode of the SD-OCT device. This mode has proven useful for in vivo morphological and morphometric analysis of deep ONH structures, including LC and adjacent structures.Citation17,Citation18 In the present sample, HVOC was significantly increased in glaucomatous eyes compared to normal eyes and in patients with more severe compared to less severe glaucoma. HVOC correlated well with structure (RNFL) and function (MD).
HVOC is a simple and easily reproducible parameter. The use of the eye-tracking system of SD-OCT ensures that the parameter will be obtained at the same location in multiple examinations. HVOC uses two important aspects of the excavation and remodeling of the glaucomatous ONH: depth of the cup, which may represent LC displacement due to increased IOP in susceptible eyes; and length of the cup, which corresponds to the neuroretinal rim thinning due to axonal loss that is also evaluated clinically.
Posterior LC displacement is a parameter that has been demonstrated histologically in experimental studies of glaucoma and in studies using postmortem glaucomatous eyes.Citation33,Citation34 Furlanetto et alCitation28 showed that LC depth correlated functionally and was significantly greater in patients with glaucoma than in normal controls. Park et alCitation27 evaluated the depth of posterior LC displacement by dividing the sample into different stages of glaucoma and found that LC depth was greater in patients with preperimetric glaucoma than in normal controls, and in mild-to-moderate glaucoma than in mild glaucoma. However, it was the difference between severe and mild-to-moderate glaucoma that was statistically significant. Jung et alCitation35 showed that LC depth was associated with CDR in eyes with increased optic disc cupping and CDR asymmetry. In the present study, when the depth of the cup, as measured according to the method described here, was evaluated separately, significant differences were observed between normal eyes and glaucomatous eyes, but these differences were not significant between patients with milder glaucoma (MD ≥−7 dB) and more severe glaucoma (MD <−7 dB).
Prelaminar thinning is a component of plastic changes leading to the shallow form of excavation that results from the compression and/or loss of retinal ganglion cell axons. Prelaminar components may also be an important biomarker for the structural diagnosis of glaucoma.Citation36–Citation38 Chauhan and BurgoyneCitation26 demonstrated that a clinically and stereophotographically visible rim margin disagrees with actual anatomical measurements using SD-OCT and BMO as an anatomical parameter to determine rim margin. Gardiner et al,Citation25 in a study describing rim measurements using BMO as a reference for the minimum rim width and area, reported that this parameter correlated functionally with MD, but had a stronger correlation with RNFL thickness. In the present study HVOC also had a stronger correlation with RNFL thickness than with MD (r=−0.47; P<0.001) in ONHs with a vertical diameter between 1.5–2.0 mm. When eyes were divided according to percentile groups, based on HVOC values, these groups differed significantly from each other regarding RNFL thickness. As for MD, there were significant differences between percentile groups, except for group 1 versus 2 and a borderline correlation between groups 3 and 4.
The usefulness of ONH parameters obtained with the Heidelberg Retina Tomograph and with OCT for the diagnosis of glaucoma and its progression has already been extensively studied.Citation39–Citation41 Lisboa et alCitation42 reported that ONH parameters had receiver operating characteristic curves with smaller areas under the curve (AUC) than did RNFL thickness. However, among the ONH parameters, vertical CDR had the best AUC. Vertical CDR is a well-established clinical hallmark of glaucoma and a predictive factor for conversion from ocular hypertension to glaucoma.Citation43 In the present study, the cup was measured vertically and used as one of the parameters to calculate the hypotenuse, and the length of the vertical cup was significantly different between glaucoma groups and controls.
Automated ONH parameters obtained with different devices must be checked for proper segmentation. There are many potential artifacts that may mislead the interpretation. In our study, HVOC was measured manually using the infrared image to determine the correct placement of the EDI B-scan over the largest portion of the vertical cup using the ART mode and eye-tracking system. SS-OCT, a current iteration of the OCT technology, permits deeper image penetration, obviating the need for EDI mode, and has a faster scanning speed, which, in prototype models, can reach over 400,000 scans/second.Citation44 The principles for obtaining the HVOC and its components remain the same with SS-OCT.
The present study was conducted as a preliminary study to support the hypothesis that HVOC is a potential biomarker for the structural diagnosis of glaucoma. Further studies evaluating 360° B-scans of the ONH and using not only the middle third of the cup, as in our method, but also the peripheral portions of the cup to measure depth should be performed. Average RNFL thickness was used as a structural parameter in our study. However, studying RNFL thickness in different regions (quadrants and clock-hour positions) in comparison with HVOC obtained in the corresponding portion of the ONH might increase the usefulness of information.
This study has some limitations. Different optic disc diameters and shapes might influence HVOC measurement. However, when discs were divided into different diameter ranges, significant differences were also observed between these groups, except for discs with a vertical diameter <1.5 mm, which showed no significant difference between glaucomatous eyes with MD worse and better than −7 dB. Future studies using HVOC, as well as other ONH parameters, should also consider disc size and phenotype as covariates. Optic discs with high myopic changes, chorioretinal scars, and large areas of peripapillary atrophy may be unsuitable for HVOC measurement. In our sample, there were no eyes with these findings. MD =−7 dB as the cutoff value to divide the glaucoma groups was arbitrary; however, between-group differences in MD and RNFL thickness were significant. This cutoff value was also significant when each HVOC percentile group was analyzed separately. The highest HVOC percentile had no normal eyes, while the lowest percentile (percentile groups 1 and 2) had only a few eyes (20.4%) with an MD worse than −7 dB (P<0.01).
HVOC may provide an additional morphometric parameter to detect ONH damage and remodeling, as it incorporates two important hallmarks: vertical length of the cup and depth of displacement. Moreover, HVOC measurement is simple and reproducible with the current OCT technology. Additional cross-sectional studies, as mentioned earlier, are required to further evaluate this parameter and its incorporation into the multimodal diagnosis of glaucoma using novel OCT technologies. Longitudinal studies are also required to assess the success of HVOC in detecting glaucoma progression and to compare HVOC with other structural and functional parameters.
Author contributions
Conception and design, writing the article, and overall responsibility: Fabio Lavinsky and Paulo Augusto de Arruda Mello. Analysis and interpretation: Fabio Lavinsky. Data collection: Fabio Lavinsky, Nédio Castoldi, Camila Zanella Benfica, and Anne Elise Cruz do Carmo Chaves. All authors contributed toward data analysis, drafting and critically revising the paper, gave final approval of the version to be published, and agree to be accountable for all aspects of the work.
Acknowledgments
This study was presented in part at the Association for Research in Vision and Ophthalmology Annual Meeting, Orlando, FL, USA, 2014, and at the Association for Research in Vision and Ophthalmology Annual Meeting, Seattle, WA, USA, 2016.
Disclosure
The authors report no conflicts of interest in this work.
References
- HarwerthRSCarter-DawsonLSmithELBarnesGHoltWFCrawfordMLNeural losses correlated with visual losses in clinical perimetryInvest Ophthalmol Vis Sci20044593152316015326134
- GardinerSKJohnsonCACioffiGAEvaluation of the structure–function relationship in glaucomaInvest Ophthalmol Vis Sci200546103712371716186353
- AndersonRSThe psychophysics of glaucoma: improving the structure/function relationshipProg Retin Eye Res2006251799716081311
- SchumanJSHeeMRPuliafitoCAQuantification of nerve fiber layer thickness in normal and glaucomatous eyes using optical coherence tomographyArch Ophthalmol199511355865967748128
- BaumalCRClinical applications of optical coherence tomographyCurr Opin Ophthalmol199910318218810537777
- BudenzDLAndersonDRVarmaRDeterminants of normal retinal nerve fiber layer thickness measured by Stratus OCTOphthalmology200711461046105217210181
- LeungCKCheungCYWeinrebRNRetinal nerve fiber layer imaging with spectral-domain optical coherence tomography: a variability and diagnostic performance studyOphthalmology200911671257126319464061
- AsraniSRosdahlJAAllinghamRRNovel software strategy for glaucoma diagnosis: asymmetry analysis of retinal thicknessArch Ophthalmol201112991205121121911669
- SchumanJSSpectral domain optical coherence tomography for glaucoma (an AOS thesis)Trans Am Ophthalmol Soc200810642645819277249
- LeungCKCheungCYWeinrebRNEvaluation of retinal nerve fiber layer progression in glaucoma: a study on optical coherence tomography guided progression analysisInvest Ophthalmol Vis Sci201051121722219684001
- BusselIIWollsteinGSchumanJSOCT for glaucoma diagnosis, screening and detection of glaucoma progressionBr J Ophthalmol201498Suppl 21519
- WojtkowskiMSrinivasanVFujimotoJGThree-dimensional retinal imaging with high-speed ultrahigh-resolution optical coherence tomographyOphthalmology2005112101734174616140383
- WojtkowskiMSrinivasanVKoTFujimotoJKowalczykADukerJUltrahigh-resolution, high-speed, Fourier domain optical coherence tomography and methods for dispersion compensationOpt Express200412112404242219475077
- LeungCKYeCWeinrebRNRetinal nerve fiber layer imaging with spectral-domain optical coherence tomography: a study on diagnostic agreement with Heidelberg Retinal TomographOphthalmology2010117226727419969364
- SanderBLarsenMThraneLHougaardJLJorgensenTMEnhanced optical coherence tomography imaging by multiple scan averagingBr J Ophthalmol200589220721215665354
- SpaideRFKoizumiHPozzoniMCEnhanced depth imaging spectral-domain optical coherence tomographyAm J Ophthalmol2008146449650018639219
- ParkSCDe MoraesCGTengCCTelloCLiebmannJMRitchREnhanced depth imaging optical coherence tomography of deep optic nerve complex structures in glaucomaOphthalmology201211913921978593
- LeeEJKimTWWeinrebRNParkKHKimSHKimDMVisualization of the lamina cribrosa using enhanced depth imaging spectral-domain optical coherence tomographyAm J Ophthalmol20111521879521570046
- PotsaidBBaumannBHuangDUltrahigh speed 1050 nm swept source/Fourier domain OCT retinal and anterior segment imaging at 100,000 to 400,000 axial scans per secondOpt Express20101819200292004820940894
- StewartWCKolkerAESharpeEDFactors associated with long-term progression or stability in primary open-angle glaucomaAm J Ophthalmol2000130327427911020404
- JonasJBXuLOptic disk hemorrhages in glaucomaAm J Ophthalmol19941181188023857
- MartusPStrouxABuddeWMMardinCYKorthMJonasJBPredictive factors for progressive optic nerve damage in various types of chronic open-angle glaucomaAm J Ophthalmol20051396999100915953429
- HarizmanNOliveiraCChiangAThe ISNT rule and differentiation of normal from glaucomatous eyesArch Ophthalmol2006124111579158317102005
- SchumanJSWollsteinGFarraTComparison of optic nerve head measurements obtained by optical coherence tomography and confocal scanning laser ophthalmoscopyAm J Ophthalmol2003135450451212654368
- GardinerSKRenRYangHFortuneBBurgoyneCFDemirelSA method to estimate the amount of neuroretinal rim tissue in glaucoma: comparison with current methods for measuring rim areaAm J Ophthalmol2014157354054924239775
- ChauhanBCBurgoyneCFFrom clinical examination of the optic disc to clinical assessment of the optic nerve head: a paradigm changeAm J Ophthalmol2013156221822723768651
- ParkSCBrummJFurlanettoRLLamina cribrosa depth in different stages of glaucomaInvest Ophthalmol Vis Sci20155632059206425722212
- FurlanettoRLParkSCDamleUJPosterior displacement of the lamina cribrosa in glaucoma: in vivo interindividual and intereye comparisonsInvest Ophthalmol Vis Sci20135474836484223778876
- RenRYangHGardinerSKAnterior lamina cribrosa surface depth, age, and visual field sensitivity in the Portland Progression ProjectInvest Ophthalmol Vis Sci20145531531153924474264
- BellezzaAJRintalanCJThompsonHWDownsJCHartRTBurgoyneCFDeformation of the lamina cribrosa and anterior scleral canal wall in early experimental glaucomaInvest Ophthalmol Vis Sci200344262363712556392
- YangHThompsonHRobertsMDSigalIADownsJCBurgoyneCFDeformation of the early glaucomatous monkey optic nerve head connective tissue after acute IOP elevation in 3-D histomorphometric reconstructionsInvest Ophthalmol Vis Sci201152134536320702834
- QuigleyHAHohmanRMAddicksEMMassofRWGreenWRMorphologic changes in the lamina cribrosa correlated with neural loss in open-angle glaucomaAm J Ophthalmol19839556736916846459
- YangHDownsJCSigalIARobertsMDThompsonHBurgoyneCFDeformation of the normal monkey optic nerve head connective tissue after acute IOP elevation within 3-D histomorphometric reconstructionsInvest Ophthalmol Vis Sci200950125785579919628739
- YanDBColomaFMMetheetrairutATropeGEHeathcoteJGEthierCRDeformation of the lamina cribrosa by elevated intraocular pressureBr J Ophthalmol19947886436487918293
- JungKIJeonSParkCKLamina cribrosa depth is associated with the cup-to-disc ratio in eyes with large optic disc cupping and cup-to-disc ratio asymmetryJ Glaucoma2016255e536e54526859358
- YangHDownsJCBurgoyneCFPhysiologic intereye differences in monkey optic nerve head architecture and their relation to changes in early experimental glaucomaInvest Ophthalmol Vis Sci200950122423418775866
- BurgoyneCFDownsJCBellezzaAJSuhJKHartRTThe optic nerve head as a biomechanical structure: a new paradigm for understanding the role of IOP-related stress and strain in the pathophysiology of glaucomatous optic nerve head damageProg Retin Eye Res2005241397315555526
- BurgoyneCFDownsJCPremise and prediction – how optic nerve head biomechanics underlies the susceptibility and clinical behavior of the aged optic nerve headJ Glaucoma200817431832818552618
- WollsteinGGarway-HeathDFHitchingsRAIdentification of early glaucoma cases with the scanning laser ophthalmoscopeOphthalmology19981058155715639709774
- GordonMOBeiserJABrandtJDThe Ocular Hypertension Treatment Study: baseline factors that predict the onset of primary open-angle glaucomaArch Ophthalmol2002120671472012049575
- MedeirosFAVizzeriGZangwillLMAlencarLMSamplePAWeinrebRNComparison of retinal nerve fiber layer and optic disc imaging for diagnosing glaucoma in patients suspected of having the diseaseOphthalmology200811581340134618207246
- LisboaRParanhosAJrWeinrebRNZangwillLMLeiteMTMedeirosFAComparison of different spectral domain OCT scanning protocols for diagnosing preperimetric glaucomaInvest Ophthalmol Vis Sci20135453417342523532529
- Ocular Hypertension Treatment Study GroupEuropean Glaucoma Prevention Study GroupGordonMOValidated prediction model for the development of primary open-angle glaucoma in individuals with ocular hypertensionOphthalmology20071141101917095090
- YangZTathamAJZangwillLMWeinrebRNZhangCMedeirosFADiagnostic ability of retinal nerve fiber layer imaging by swept-source optical coherence tomography in glaucomaAm J Ophthalmol2015159119320125448991