
Abstract
Importance
The paper presents the range for measurements taken with a new spectral domain optical coherence tomography (OCT) device to establish a reference database for discrimination purposes.
Objective
To report the range of thickness values for the new Topcon Maestro 3D OCT device with 2 scan size settings: the 12×9 mm wide field and 6×6 mm scans.
Design
Prospective, multicenter cohort study conducted at 7 clinical sites across the USA.
Setting
Primary eyecare clinics within academic, hospital, and private practice locations.
Participants
Healthy volunteers; all enrolled participants underwent a complete ophthalmological examination to confirm healthy ocular status prior to being enrolled in the study.
Main outcome measure
Average and 1st, 5th, 95th, and 99th percentile ranges for OCT parameters Early Treatment Diabetic Retinopathy Study macula full retinal thickness, ganglion cell + inner plexiform layer thickness (GCL + IPL), ganglion cell complex (GCC) thickness, circumpapillary retinal nerve fiber layer (cpRNFL) thickness.
Results
Three hundred and ninety-nine eyes of 399 subjects were included in the analysis. Mean (SD) age was 46.3 (16.3) years (range 18–88 years). Forty-three percent of the subjects were male. Mean (SD) measurements (in μm) for the 12×9 mm wide scan were as follows: foveal thickness=237.079 (20.899), GCL + IPL=71.363 (5.924), GCC=105.949 (8.533), cpRNFL=104.720 (11.829); measurements for the 6×6 mm scans were as follows: foveal thickness=234.000 (20.657), GCL + IPL=71.726 (5.880), GCC=106.698 (9.094), cpRNFL=104.036 (11.341).
Conclusion
The overall normal thickness values reported with Topcon 3D OCT-1 Maestro were like those studies with OCT from different manufactures. The reference limits at the 1st, 5th, 95th, and 99th percentile points establish the thresholds for the quantitative comparison of the cpRNFL and the macula in the human retina to a database of known healthy subjects.
Introduction
Since its introduction in 1991,Citation1 optical coherence tomography (OCT) has become the reference standard imaging device for evaluating retinal and optic nerve disorders.Citation2–Citation4 It uses low-coherence interferometry to generate in vivo, cross-sectional images of ocular tissues. Over the last 2 decades, technology has evolved to produce the spectral domain OCT (SD-OCT) with rapid image acquisition rate and high-resolution axial images of the retina and optic nerve.Citation5 Thus, SD-OCT is commonly used in the monitoring of glaucoma and diabetic macula edema.Citation6–Citation10
Topcon 3D OCT-1 Maestro is a noncontact SD-OCT system introduced in 2013. The instrument operates a fully automated “alignment, focus and capture” procedure, and captures 50,000 axial scans per second. The device simultaneously captures the macula and optic nerve head areas, giving both a digital fundus image and a 12×9 mm automated segmentation OCT scan (“wide scan” setting). The device also has the option for separate 6×6 mm optic disc and macula scans. It produces a 20 μm lateral and 6 μm axial resolution (Topcon; http://www.top-conmedical.com/products/3doct1maestro-literature.htm).
One of the goals of ophthalmic imaging is to assist clinicians to discriminate between normality and pathology. In order to provide quantitative metrics for clinicians to determine retinal pathologies, we conducted a multicenter prospective study within the USA (ClincialTrial.gov Identifier: NCT02447120) to collect OCT data of healthy eyes for the estimations of normal variation limits for various retinal and optic disc measurements using the Topcon 3D OCT-1 Maestro. The reference limits were estimated using non-crossing quantile regressions and 1st, 5th, 50th, 95th, and 99th percentiles were reported.
Methods
The study was conducted at 7 investigational sites in the USA and was performed in accordance with Good Clinical Practices (as described by the International Conference on Harmonisation), the Code of Federal Regulations, the ethical principles in the Declaration of Helsinki, Health Insurance Portability and Accountability Act regulations, and other applicable local regulations. The study was registered at the US National Institutes of Health (ClinicalTrials.gov Identifier: NCT02447120). Between May and October 2015, 504 participants were enrolled. Institutional Review Board approval was provided by IntegReview IRB (Austin, TX, USA) for the following sites: Illinois College of Optometry, Marshall B. Ketchum University, State University of New York College of Optometry, Western University, and Valley Eye Care Center Medical Associates. Local IRB was used for the University of Alabama School of Optometry and New York Harbor Health Care System sites. All subjects, at all sites, provided written informed consent before the performance of any study procedure. Subjects were eligible for the study if both eyes were free of eye disease, with an intraocular pressure of ≤21 mmHg bilaterally and a best-corrected visual acuity of 20/40 or better in each eye. All subjects underwent Humphrey Field Analyzer (HFA; Carl Zeiss Meditech, Inc., Dublin, CA, USA) testing using the Swedish Interactive Threshold Algorithm (SITA) 24-2 test strategy. Subjects were excluded if they exhibited a field defect or if they had unreliable test result, (defined as fixation losses >20%, or false positives >33%, or false negatives >33%). Subjects were also excluded if they were unable to tolerate ophthalmic imaging; had media opacities that inhibited OCT imaging; showed the presence of any ocular pathology except for cataract; had narrow angles on gonioscopy; had a history of leukemia, dementia, or multiple sclerosis; or were concomitantly using hydroxychloroquine and chloroquine. All ocular examinations to determine participant eligibility were performed within 2 calendar months of the scan acquisitions, and where possible, all OCT scans were performed in a single session.
One eye of each study participant was randomly selected and scanned with the 3D OCT-1 Maestro (firmware version 1.27). A minimum of 9 scans were obtained under 3 different settings: 3 wide scans (12×9 mm), 3 disc scans (6×6 mm), and 3 macula scans (6×6 mm). Additional scans were taken at the operator’s discretion if image quality was unacceptable. All study scans that were deemed acceptable by the clinical site operator were saved.
Clinical sites were also allowed to make manual adjustments to correct automatic segmentation errors such as grid locations, boundary segmentations, and/or disc margin with Fastmap (version 8.27). Such modifications were performed only at the clinical sites by qualified investigators within the purview of typical clinical use. All manual adjustments were electronically documented. The fovea modification corresponded to relocation of the Early Treatment Diabetic Retinopathy Study (ETDRS) and Macula 6 grid center location, while the disc margin and disc center modifications corresponded to adjustments of the disc outline and location, respectively. The remaining modifications involved segmentation adjustments between boundaries. The scan adjustment rates were between 1% and 8%. The scan adjustment rates with respect to macula measurements ranged between 1% and 3%, and the adjustment rates with respect to optic disc and circumpapillary measurements fell within the 6%–8% range.
OCT data were then exported to Topcon Reading Center (Oakland, NJ, USA), where image quality was checked by individuals with experience in OCT imaging. Scan exclusion criteria included image quality score, presence of eye blinks, eye motion, clipping, local weak signal, and feature centration. All scan exclusions were documented. No manual adjustments were made in the Topcon Reading Center. Approximately 1,200 scans were captured per scan mode (all subjects combined). Scan exclusion rates were 3% for wide scans, 3% for disc scans, and 2% for macula scans. All scans deemed acceptable by Topcon Reading Center qualified for data analysis.
Measurement endpoints
Measurement endpoints by scan patterns are listed below:
Macular full retinal thickness (FRT, ): ETDRS grid was placed automatically at the foveal center and sectors measured as per ETDRS chart specifications:Citation11 central fovea, superior, nasal, inferior, and temporal inner quadrants (para-foveal); superior, nasal, inferior, and temporal outer quadrants (peri-foveal), measured with 12×9 wide and 6×6 macula modes; FRT consisted the distance between the inner limiting membrane (ILM) and the outer segments/retinal pigment epithelium junction boundary (), the 2 green boundaries. An average value over the entire sector was reported.
Figure 1 Measurement areas for macula Early Treatment Diabetic Retinopathy Study grid (A), macula 6 circle (B), and circumpapillary RNFL circle (C) overlaid with example projected images. Single-frame OCT B-scan images overlaid with boundaries (green and blue lines) demonstrated the retinal layers in various retinal thickness measurements, including full retinal thickness (D); ganglion cell + inner plexiform layers (distance between the 2 green boundaries), ganglion cell complex (distance between the blue and green boundaries, vitreal to inner nuclear layer) (E); and retinal neural fiber layer (F). All the images were set with right eye orientation.
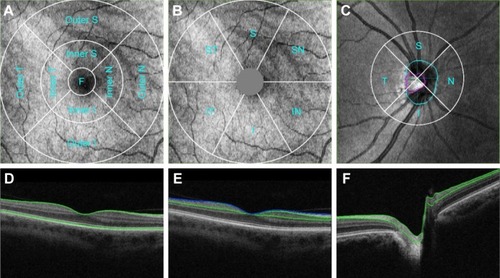
Macular ganglion cell + inner plexiform layer thickness (GCL + IPL, ): The Macula 6 sector circle was placed automatically at the foveal center (). The center 1 mm region was excluded from measurement. Superior, superior nasal, superior temporal, inferior, inferior nasal, inferior temporal, and average thickness were measured with 12×9 wide and 6×6 macula modes; GCL + IPL thickness included the distance labeled in (regions between 2 green boundaries). An average value of the entire sector was reported.
Macular ganglion cell complex (GCC, ): GCC measurement was performed with the same Macula 6 sector circle as GCL + IPL measurements. Superior, superior nasal, superior temporal, inferior, inferior nasal, inferior temporal, and average thickness were measured with 12×9 wide and 6×6 macula modes; GCC thickness consisted of the regions labeled in , which consisted of regions between the ILM (blue) and the green boundary vitreal to inner nuclear layer. An average value of the entire sector was reported.
Circumpapillary retinal nerve fiber layer (cpRNFL) thickness: 3.4 mm diameter temporal-superior-nasal-inferior-temporal (TSNIT) circle was placed automatically at the optic disc center (). Average RNFL thickness over TSNIT circle; 4 quadrants and 12 clock-hour sectors around TSNIT circle; measured with 12×9 wide and 6×6 disc modes; RNFL thickness consisted of regions labeled in (between 2 green boundaries). Average values of each sector (excluding the optic disc contour and cyan circle) were reported.
Optic disc measurements: Optic disc contour was automatically detected (, cyan circle). Disc area, cup area, rim area, cup/disc (C/D) vertical diameter, C/D area, cup volume and rim volume were measured with 12×9 wide and 6×6 disc modes. Optic disc measurements were based on optic disc contour; an example is shown in .
Data analysis
For each scan mode, the first acceptable scan by chronological order from each subject and scan mode was included in the analysis. The 99 percentiles (the 1st to the 99th) of each parameter were estimated by a simultaneous estimation of 99 non-crossing quantile regressions.Citation12 Age was the regression covariate used in reference limits estimation for macula FRT, GCL + IPL, and GCC, whereas age and disc area were used as the regression covariates for RNFL thickness and optic disc parameters.Citation13–Citation17 Estimation of the non-crossing quantile regressions was performed using an R program provided by Bondell (available at http://www4.stat.ncsu.edu/~bondell/Software/NoCross/NoCrossQuant.R). The 1st, 5th, 50th (median), 95th, and 99th percentile results were reported.
The sample size was based on the nonparametric 95% CI for the percentiles of the scan parameters without any covariate adjustments. The goal was to find a minimum sample size such that the nonparametric 95% CI for the 1st and the 5th percentiles did not overlap. For a sample size of 315 eyes, the nonparametric 95% CI values are (X(1), X(9)) and (X(10), X(27)) for the 1st and the 5th percentiles, respectively, where X(k) is the kth smallest value in a sample of 315 measurements without ties.Citation18 Therefore, at least 315 evaluable eyes were needed to achieve the sample size goal. A study eye was evaluable if the subject met all eligibility criteria and had at least 1 acceptable scan. The final sample size was increased by about 10% of the minimum number of evaluable eyes to 350 evaluable eyes to ensure that all scan parameters would have at least 315 eyes for analysis. Assuming 30% of the subjects would not meet eligibility criteria, the study planned to enroll 500 subjects.
Results
Five hundred and four subjects were screened for the study. One hundred and two did not meet the eligibility criteria and were excluded from imaging. Reasons for screen failure included visual fields with an apparent defect or artifact per study criteria (n=73), unreliable HFA visual field (n=26), and other ocular pathology/presence of eye disease (n=33). Some subjects failed multiple eligibility criteria. Two subjects who met the eligibility criteria did not have acceptable scans and 1 subject with unknown eligibility status did not have any scans. Therefore, 399 eyes of the 504 enrolled subjects were included in the analysis.
The mean (SD) age was 46.3 (16.3) years (ranged 18–88 years). The most prominent age group was 18–30 years (22%) followed by 51–60 years (20%). Fifty-seven percent (n=226) of the subjects were female and 18% (n=71) of the subjects were Hispanic or Latino. Fifty-nine percent of the subject were Caucasians, followed by Black/African American (20%), Asian (13%), Native American/Pacific Islander (2%), and American Indian/Alaskan Native (1%); 6% reported their race as “other”.
The study eyes had a mean sphere of −1.441 diopters (D)±2.537 (ranged −12.5D to 4.0D), a cylinder of 0.565D±0.691 (ranged 0–5.0D), and a manifest refractive spherical equivalent of −1.159D±2.418 (ranged −11.00 to 4.50D).
Subjects had at least 3 acceptable scans per scan mode. Images were reviewed for acceptability prior to calculating results. The first accepted scan of each scan parameter in each scan mode from each eligible subject was included in the analysis. Scan rejection rates ranged from 2% to 5%. Specifically, the scan rejection rates were 2%–4% with respect to macula measurements and 4%–5% with respect to optic disc and circumpapillary measurements.
Macular FRT
Summary statistic of foveal FRT measured with 2 scan modes are shown in . Four patients were excluded from this analysis, as all their macula scans were determined to be unacceptable; thus, 395 of 399 subjects were included. The 1st, 5th, 50th, 95th, and 99th percentiles of foveal FRT by age are shown in . The median intercepts and coefficients were highly similar between 12×9 wide and 6×6 macula scan modes. Overall, there was a reduction in FRT with age in the outer ETDRS quadrants.
Figure 2 Quantile regression fits of various macula measurements from 12×9 wide and 6×6 macula scans are shown.
Abbreviations: FRT, full retinal thickness; GCC, ganglion cell complex; GCL, ganglion cell; IPL, inner plexiform layer.
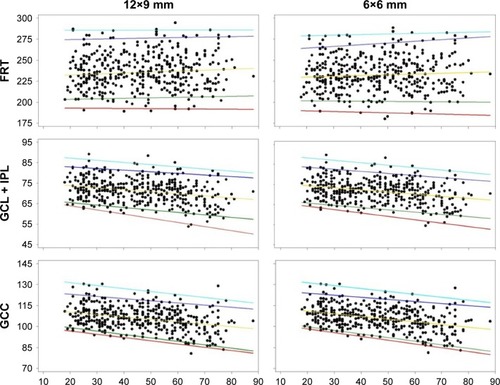
Table 1 Summary of selected scan parameters
GCL + IPL thickness
The 1st, 5th, 50th, 95th, and 99th percentiles of average macula GCL + IPL thickness are shown in . The median intercepts and coefficients were highly similar between 12×9 wide and 6×6 macula scan modes, and overall, there was a reduction in GCL + IPL thickness with age.
GCC thickness
Summary statistics of average GCC thickness with 2 scan modes are shown in . The 1st, 5th, 50th, 95th, and 99th percentiles of average macula GCC thickness are shown in , bottom panels. The median intercepts and slopes were highly similar between 12×9 wide and 6×6 macula scan modes, and overall, there was a reduction in GCC thickness with age.
cpRNFL thickness
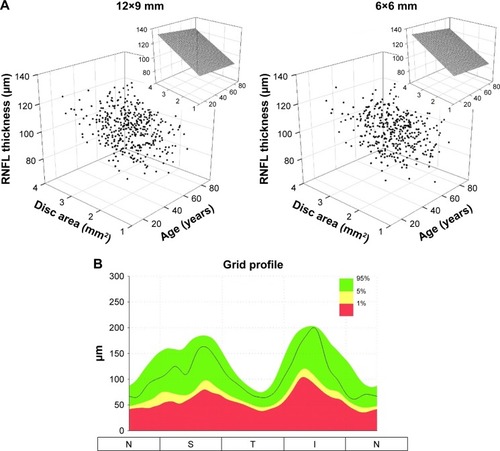
Summary statistics of average cpRNFL thickness with 2 scan modes are shown in . The disc areas ranged from 1.25 to 3.97 mm2 (2.26±0.41 mm2, mean ± SD) for 12×9 wide scan and 1.03–3.85 mm2 (2.10±0.41 mm2) for 6×6 disc scan. The median intercepts and slopes were highly similar between 12×9 wide and 6×6 disc scan modes. Age had little or no effect, whereas disc area showed large degree of influence on the cpRNFL thickness (). Reference limits of the circle profile around the perimeter of the 3.4 mm TNSIT circle is shown in .
Figure 3 The relationships of cpRNFL thickness with age and disc area displayed in the 3D scatter plots (A). The insets show the effect of age and disc area on cpRNFL thickness based on median fits (50th percentile). The cpRNFL circle profile reference limits are shown (B).
Abbreviation: cpRNFL, circumpapillary retinal nerve fiber layer.
Optic disc parameters
Summary statistics of disc area, cup area, rim area, cup volume, and rim volume with both 12×9 wide and 6×6 disc scan modes are reported in . Age and disc area were the covariates used in the quartile regression analyses. Overall, optic disc parameters increased with disc area, except rim volume, and the effect of aging was not significant.
Discussion
The purpose of this paper was to report the normal reference limits for macula, optic nerve, and nerve fiber layer thickness measurements from Topcon 3D OCT-1 Maestro. The measurements included various parameters of full retinal thickness, RNFL thickness, ganglion cell layer plus the IPL layer thickness, ganglion cell complex, and the optic disc for healthy eyes. Across all parameters, the measurements obtained by the 12×9 wide, the 6×6 macula, and 6×6 disc scan modes were generally similar.
FRT measurements were consistent with reported OCT measured thickness ranges for healthy eyes.Citation19–Citation23 We found a negative association between peri-foveal (outer retinal) thickness with age, but there were no significant age associations with central foveal or inner ETDRS quadrants. There are conflicting reports in the literature regarding whether retinal thickness, as measured with digital imaging techniques, decreases with age. Some authors found no association between overall macula thickness and age.Citation19–Citation21 However, like us, others have found a decreased FRT in both the inner and outer quadrants with age.Citation23–Citation26 Histological studies suggest that retinal thickness reduces with age, but that the changes in the foveal region are much less than those in the outer retinal areas.Citation27 As with others’ reports, we recommend that due to differences in image acquisition and processing methods, imaging devices should not be interchanged when evaluating retinal thickness measurements.Citation21–Citation28
Our reported reference values for ganglion cell and inner limiting plexiform layer thickness were thinner than those reported by others using the Cirrus SD-OCT, but similar to measurements found using swept source OCT.Citation29–Citation33 Furthermore, we found a thicker GCC average measurement than previous reports.Citation34–Citation36 Differences may be primarily due to size and location of grid sectors used by the different devices, and add further evidence that imaging devices should not be interchanged when monitoring ophthalmic disease in an individual.
We found that both the GCL + IPL thickness and GCC thickness decreased with advancing age, which is consistent with some published data,Citation37,Citation38 but not with other published data.Citation39,Citation40 An age-related reduction in the ganglion cell layer has been noted in histological studies;Citation27 thus, it might be expected that in vivo imaging of the area in a wide age range would show similar findings. In addition to age-related trends in loss of tissue, individual variation in the location of the major RNFL arcuates (since the GCC includes the nerve fiber layer, the ganglion cell layer, and the inner plexiform layer) is also likely factoring in our results.
cpRNFL thickness parameters included average, superior quadrant, nasal quadrant, inferior quadrant, temporal quadrant, and 12 clock-hour sections around the TSNIT circle. Overall, the measurements were consistent with those in the literature,Citation41–Citation43 although there is some variation in the values reported by different devices.Citation44 Some sectors showed the trend of cpRNFL thickness decreasing with age, which can be explained by 2 competing factors: a neuronal tissue loss and a non-neuronal tissue gain that typically occurs to a smaller extent.Citation43,Citation45–Citation47 However, our data showed that disc area had a more profound effect on cpRNFL thickness. This is mainly due to the following reasons:
The measurement region was a circle with a fixed diameter of 3.4 mm centering at the geographical center of the optic disc. As it has been proposed in previous studies, there could be greater amount of retinal neural fibers present with eyes having large optic disc, or it could be an artifact with fixed diameter scans.Citation2,Citation48,Citation49
Individual variation in the location of blood vessels and RNFL arcuates could contribute to variations in RNFL layer segmentations. To encompasses individual variations, the 3D OCT-1 Maestro’s cpRNFL reference variation limits were estimated based on the influence of both age and disc area.
In summary, the measurements and trends observed for the various parameters were largely consistent with those in the literature. Thus, the measurements presented in this report can be considered as a reference database for the measurements of healthy eyes. This study collected measurements of healthy eyes for full retinal thickness, RNFL thickness, ganglion cell layer plus the IPL layer thickness, GCC, and the optic disc in addition to small and large super pixel grid and TSNIT circle profile measurements. The reference limits at the 1st, 5th, 95th, and 99th percentile points establish thresholds to provide for the quantitative comparison of the RNFL, optic nerve head, and the macula in the human retina to a database of known healthy eyes. Consistent with the device’s proposed indications for use, this quantitative comparison can aid in the diagnosis, documentation, and management of ocular health and diseases in the adult population.
Acknowledgments
Additional investigators and data collection sites included: Jeffrey Chou, New York Harbor Health Care System, Brooklyn, NY; George Comer, Marshall B Ketchum University, Southern California College of Optometry Fullerton, CA; Mitchell Dul, State University of New York College of Optometry, New York, NY; Michael Gagnon, Valley EyeCare Center Medical Associates, Pleasanton, CA; Michael D Twa, University of Alabama School of Optometry, Birmingham, AL.
Disclosure
MC, MF, and PGD received financial support from Topcon Medical Systems. WCH, DL, and CAR are employees of Topcon Medical Systems. EN is a consultant of Topcon for this work. The authors report no other conflicts of interest in this work.
References
- HuangDSwansonEALinCPOptical coherence tomographyScience19912545035117811811957169
- KaiserPKBlodiBAShapiroHAcharyaNRMARINA Study GroupAngiographic and optical coherence tomographic results of the MARINA study of ranibizumab in neovascular age-related macular degenerationOphthalmology2007114101868187517628683
- MwanzaJCBudenzDLOptical coherence tomography platforms and parameters for glaucoma diagnosis and progressionCurr Opin Ophthalmol2015272102110
- WildeCPatelMLakshmananAThe diagnostic accuracy of spectral-domain optical coherence tomography for neovascular age-related macular degeneration: a comparison with fundus fluorescein angiographyEye (Lond)201529560261025907206
- WojtkowskiMSrinivasanVFujimotoJGThree-dimensional retinal imaging with high-speed ultrahigh-resolution optical coherence tomographyOphthalmology2005112101734174616140383
- HeeMRBaumalCRPuliafitoCAOptical coherence tomography of age-related macular degeneration and choroidal neovascularizationOphthalmology19961038126012708764797
- CoscasFCoscasGSouiedETickSSoubraneGOptical coherence tomography identification of occult choroidal neovascularization in age- related macular degenerationAm J Ophthalmol2007144459259917698019
- ElmanMJAielloLPBeckRWDiabetic Retinopathy Clinical Research NetworkRandomized trial evaluating ranibizumab plus prompt or deferred laser or triamcinolone plus prompt laser for diabetic macular edemaOphthalmology201011761064.e351077.e3520427088
- MichelessiMLucenteforteEOddoneFOptic nerve head and fibre layer imaging for diagnosing glaucomaCochrane Database Syst Rev201511CD008803
- WangYTTadaratiMWolfsonYBresslerSBBresslerNMComparison of prevalence of diabetic macular edema based on monocular fundus photography vs optical coherence tomographyJAMA Ophthalmol2016134222222826719967
- Photocoagulation for diabetic macular edemaEarly treatment diabetic retinopathy study report number 1. Early treatment diabetic retinopathy study research groupArch Ophthalmol198510312179618062866759
- BondellHDReichBJWangHNoncrossing quantile regression curve estimationBiometrika201097482583822822254
- AlamoutiBFunkJRetinal thickness decreases with age: an OCT studyBr J Ophthalmol200387789990112812895
- CelebiARMirzaGEAge-related change in retinal nerve fiber layer thickness measured with spectral domain optical coherence tomographyInvest Ophthalmol Vis Sci201354138095810324194190
- SongWKLeeSCLeeESKimCYKimSSMacula thickness variation with sex, age, and axial length in healthy subjects: a spectral domain-optical coherence tomography studyInvest Ophthalmol Vis Sci20105183913391820357206
- MansooriTBalakrishnaNViswanathKInfluence of disc area on retinal nerve fiber layer thickness measurement by spectral domain optical coherence tomographyIndian J Ophthalmol201462561561824881611
- TariqMYLiHBurlutskyGMitchellPRetinal nerve fiver layer and optic disc measurements by spectral domain OCT: normative values and associations in young adultsEye (Lond)201226121563157023079750
- HollanderMWoolfeDANonparametric Statistical Methods2nd edNew YorkWiley-Interscience1999
- GroverSMurthyRKBrarVSChalamKVNormative data for macular thickness by high-definition spectral-domain optical coherence tomography (spectralis)Am J Ophthalmol2009148226627119427616
- SullACVuongLNPriceLLComparison of spectral/Fourier domain optical coherence tomography instruments for assessment of normal macular thicknessRetina201030223524519952997
- Wolf-SchnurrbuschUECeklicLBrinkmannCKMacular thickness measurements in healthy eyes using six different optical coherence tomography instrumentsInvest Ophthalmol Vis Sci20095073432343719234346
- ChanADukerJSKoTHFujimotoJGSchumanJSNormal macular thickness measurements in healthy eyes using Stratus optical coherence tomographyArch Ophthalmol2006124219319816476888
- ManassakornAChaidaroonWAusayakhunSAupapongSWattananikornSNormative database of retinal nerve fiber layer and macular retinal thickness in a Thai populationJpn J Ophthalmol200852645045619089565
- SungKRWollsteinGBilonickRAEffects of age on optical coherence tomography measurements of healthy retinal nerve fiber layer, macula, and optic nerve headOphthalmology200911661119112419376593
- DuanXRLiangYBFriedmanDSNormal macular thickness measurements using optical coherence tomography in healthy eyes of adult Chinese persons: the Handan eye studyOphthalmology201011781585159420472290
- SongWKMacular thickness variations with sex, age, and axial length in healthy subjects: a spectral domain-optical coherence tomography studyInvest Ophthalmol Vis Sci20105183913391820357206
- GaoHHollyfieldJGAging of the human retina. Differential loss of neurons and retinal pigment epithelial cellsInvest Ophthalmol Vis Sci19923311171730530
- GianiACigadaMChoudhryNReproducibility of retinal thickness measurements on normal and pathologic eyes by different optical coherence tomography instrumentsAm J Ophthalmol2010150681582420965494
- MwanzaJCDurbinMKBudenzDLGlaucoma diagnostic accuracy of ganglion cell-inner plexiform layer thickness: comparison with nerve fiber layer and optic nerve headOphthalmology201211961151115822365056
- FrancozMFenollandJRGiraudJMReproducibility of macular ganglion cell-inner plexiform layer thickness measurement with cirrus HD-OCT in normal, hypertensive and glaucomatous eyesBr J Ophthalmol201498332232824307717
- LeeH-JKimMSJoYJKimJYGanglion cell–inner plexiform layer thickness in retinal diseases: repeatability study of spectral-domain optical coherence tomographyAm J Ophthalmol20151602283.e1289.e126004405
- MoonHYoonJYLimHTSungKRGanglion cell and inner plexiform layer thickness determined by spectral domain optical coherence tomography in patients with brain lesionsBr J Ophthalmol201599332933525208547
- YangZTathamAJWeinrebRNMedeirosFALiuTZangwillLMDiagnostic ability of macular ganglion cell inner plexiform layer measurements in glaucoma using swept source and spectral domain optical coherence tomographyPLoS One2015105e012595725978420
- TanOChopraVLuATDetection of macular ganglion cell loss in glaucoma by Fourier-domain optical coherence tomographyOphthalmology2009116122305.e22314.e219744726
- KimNRChopraVLuATStructure-function relationship and diagnostic value of macular ganglion cell complex measurement using Fourier-domain OCT in glaucomaInvest Ophthalmol Vis Sci20105194646465120435603
- LoewenNAZhangXTanOCombining measurements from three anatomical areas for glaucoma diagnosis using Fourier-domain optical coherence tomographyBr J Ophthalmol20159991224122925795917
- MwanzaJCDurbinMKBudenzDLCirrus OCT Normative Database Study GroupProfile and predictors of normal ganglion cell-inner plexiform layer thickness measured with frequency- domain optical coherence tomographyInvest Ophthalmol Vis Sci201152117872787921873658
- KohVTThamYCCheungCYDeterminants of ganglion cell-inner plexiform layer thickness measured by high-definition optical coherence tomographyInvest Ophthalmol Vis Sci20125395853585922836772
- KitaYKitaRTakeyamaAAnrakuATomitaGGoldbergIRelationship between macular ganglion cell complex thickness and macular outer retinal thickness: a spectral-domain optical coherence tomography studyClin Experiment Ophthalmol201341767468223433351
- WangJGaoXHuangWSwept-source optical coherence tomography imaging of macular retinal and choroidal structures in healthy eyesBMC Ophthalmology20151512226383096
- ParikhRSParikhSRSekharGCPrabakaranSBabuJGThomasRNormal age-related decay of retinal nerve fiber layer thicknessOphthalmology2007114592192617467529
- BudenzDLAndersonDRVarmaRDeterminants of normal retinal nerve fiber layer thickness measured by Stratus OCTOphthalmology200711461046105217210181
- BendschneiderDTornowRPHornFKRetinal nerve fiber layer thickness in normals measured by spectral domain OCTJ Glaucoma201019747548220051888
- SeiboldLKMandavaNKahookMYComparison of retinal nerve fiber layer thickness in normal eyes using time-domain and spectral-domain optical coherence tomographyAm J Ophthalmol20101506807.e1814.e120888550
- AlamoutiBFunkJRetinal thickness decreases with age: an OCT studyBr J Ophthalmol200387789990112812895
- ViannaJRDanthurebandaraVMSharpeGPImportance of normal aging in estimating the rate of glaucomatous neuroretinal rim and retinal nerve fiber layer lossOphthalmology2015122122392239826421707
- HarwerthRSWheatJLRangaswamyNVAge-related losses of retinal ganglion cells and axonsInvest Ophthalmol Vis Sci200849104437444318539947
- SaviniGZaniniMCarelliVSadunAARoss-CisnerosFNBarboniPCorrelation between retinal nerve fibre layer thickness and optic nerve head size: an optical coherence tomography studyBr J Ophthalmol20058948949215774930
- FunakiSShirakashiMAbeHRelation between size of optic disc and thickness of retinal nerve fibre layer in normal subjectsBr J Ophthalmol199882124212459924325