Abstract
Purpose:
To investigate the structural changes in the photoreceptors by adaptive optics (AO) fundus imaging and Fourier-domain optical coherence tomography (FD-OCT) in eyes with occult macular dystrophy (OMD).
Design:
Observational case reports.
Methods:
Eight eyes of four patients who were diagnosed with OMD were examined. All eyes had a complete ophthalmological examination. Multifocal electroretinograms (mfERGs) were recorded from all eyes. AO and FD-OCT images of foveal photoreceptors were obtained.
Results:
The best-corrected visual acuity (BCVA) of these eyes ranged from 20/20 to 20/200, and the ocular fundus was normal by conventional ocular examination in all eyes. The amplitudes of the mfERGs were decreased in the foveal area. The inner and outer segment (IS/OS) junction of the photoreceptors in the foveal area was disrupted. The IS/OS junction was intact in one eye with a BCVA of 20/20, and the outer segment layer between the IS/OS junction and retinal pigment epithelium of the FD-OCT images was identified only in the center of the fovea. The AO images showed patchy dark areas in all eyes, which indicated a disruption of the mosaic of bright spots in the fovea.
Conclusion:
Structural changes of photoreceptors in OMD patients were detected tangentially by FD-OCT and en face by AO.
Keywords:
Introduction
Occult macular dystrophy (OMD) is a progressive hereditary macular dystrophy which is characterized by reduced visual acuity with an essentially normal fundus and normal fluorescein angiography.Citation1 Full-field electroretinograms (ERGs) are normal in OMD patients, and only the focal macular ERGs and multifocal ERGs (mfERGs) recorded from the macular area are reduced.Citation2,Citation3
With advances in retinal imaging, it has become easier to detect anatomical changes of the retina in eyes with OMD. Thus, Kondo et al reported a reduction of the retinal foveal thickness measured by time domain optical coherence tomography (OCT) in OMD patients,Citation4 and Brockhurst et al reported a thinning of the outer nuclear layer that was measured by Stratus OCT in OMD patients.Citation5 Although the main site of the lesion appeared to be the photoreceptor layer, abnormalities of the photoreceptors have not been reported in imaging studies. This deficiency is probably because of the low axial and transverse resolution of the imaging instruments.
The axial resolution of the Fourier-domain OCT (FD-OCT) is approximately 6 μm, which is significantly better than the 10 μm of standard OCTs. The external limiting membrane (ELM) (first highly reflective line), photoreceptor inner and outer segment junction (IS/OS) (second line), and the retinal pigment epithelium (RPE) (fourth line) can all be detected with an FD-OCT.Citation6–Citation9 Disturbances of the IS/OS junction have been reported in some retinal diseases, eg, postoperative retinal detachment, central serous chorioretinopathy, and retinal dystrophy, which could not be detected ophthalmoscopically.Citation7,Citation10–Citation13 A disruption of the third highly reflective line of the FD-OCT images has been reported in cases of macular microhole.Citation13 Because the third line is considered to represent the outer segment of the photoreceptors because of its anatomical position, the disruption suggests an alteration of the photoreceptor outer segments. However, the origin of the third line has not been well investigated.
The adaptive optics (AO) fundus camera can obtain images with a transverse resolution of <2 μm, which makes it possible to resolve individual photoreceptors in living human eyes.Citation14–Citation20 An increase in the cone spacing in retinas with cone dystrophy can be detected by AO imaging,Citation20,Citation21 and the degree of the increased spacing is consistent with the decrease in visual function measured by mfERGs.Citation22 A disruption of the third bright line of the FD-OCT images is reported to cause a dark area in the AO fundus images.Citation14,Citation15
The purpose of this study was to determine whether the photoreceptor abnormalities in eyes with OMD can be detected tangentially in the FD-OCT images and en face in the AO fundus images.
Subjects and methods
Subjects
Eight eyes of four patients, who were diagnosed with OMD in the Department of Ophthalmology, Osaka University School of Medicine, were studied. The diagnosis of OMD was made by the following findings: normal fundus, normal fluorescein angiography, decreased visual acuity, normal full-field ERGs for both rod and cone components, and reduced amplitude of mfERGs in the central 5 degrees. All of the patients were classified as having sporadic OMD because none reported other family members with similar visual problems. Some of the characteristics of these OMD patients are summarized in .
Table 1 Clinical characteristics of examined patients
The research protocol was approved by the Institutional Review Board of the Osaka University Medical School, and the procedures used conformed to the tenets of the Declaration of Helsinki. After the nature and possible consequences of the study were explained, a written informed consent was obtained from all patients.
The mfERGs were recorded with the Veris Clinic system (Mayo Co., Aichi, Japan) under standardized conditions. The stimulus array consisted of 103 hexagons, and the luminance of each hexagon was alternated between 200 cd/m2 and 5 cd/m2. A cross sectional image of the retina was obtained by a FD-OCT (RTVue-100; Optovue Inc., Fremont, CA). Horizontal and vertical scans were made through the fovea with a scan length of 6 mm. To improve the signal-to-noise ratio, consecutive images were averaged with the built-in software.
AO fundus images
The AO fundus images were taken through pupils dilated with topical tropicamide (0.5%) and phenylephrine (0.5%) and the ciliary muscle paralyzed. A detailed description of the custom-built AO fundus camera has been published,Citation23,Citation24 and the principle of our flood illumination AO fundus camera is similar to that reported by Roorda and Williams.Citation15 Briefly, the main components of the camera were a nematic liquid crystal phase modulator (LCPM: X8267-12; Hamamatsu Photonics, Hamamatsu, Japan), a Hartmann-Shack wavefront sensor (HSWS: 28 × 28 lenslets; specially made by Topcon, Co., Tokyo, Japan), and a scientific CCD digital camera (C9100-02; Hamamatsu Photonics, Hamamatsu, Japan). The wavefront sensor measured the ocular wavefront up to the eighth Zernike order, and the phase modulator compensated for the measured wavefront aberrations. The system is also equipped with coaxial, 8-degree-wide viewing optics to identify the location and orientation of the highly magnified retinal images.
The retina was illuminated with a 2-ms flash (635-nm wavelength) from a laser diode, and a retinal image was obtained with a 6-mm diameter exit pupil. The patient was instructed to fixate a target in the center of the field. Frame-averaging was performed using custom software (Topcon) to improve the quality of the image. Overlapping images were merged using Photoshop (Adobe Systems Inc., San Jose, CA).
Results
The age of the patients ranged from 38 to 48 years. The best-corrected visual acuity (BCVA) at examination ranged from 20/200 to 20/20. None of the patients had an episode of sudden loss of visual acuity. The duration of decrease of vision ranged from 3 months to 3 years; six eyes out of eight had a central relative scotoma by Goldmann perimetry.
Multifocal ERGs
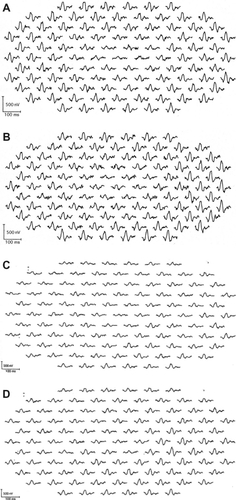
The amplitudes of the mfERGs in the central area were reduced in all eyes. The area of the decreased amplitude varied among eyes ().
Figure 1 Multifocal electroretinogram (ERGs) of right and left eye of patient 1 (A, B), patient 2 (C, D), patient 3 (E, F), and patient 4 (G, H). Foveal amplitudes are decreased in all eyes. Especially in patient 3, amplitudes are attenuated widely including ring 5 and 6, although full-field ERG showed normal amplitude.
FD-OCT
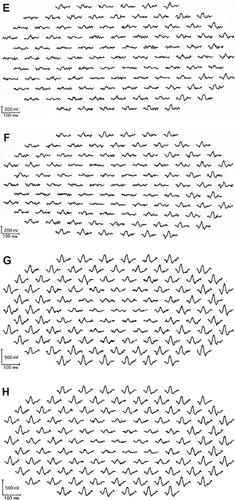
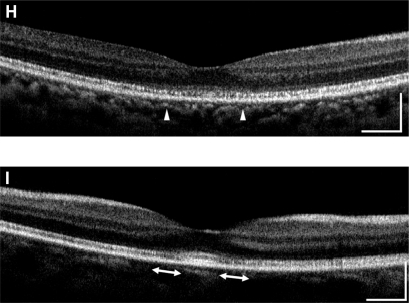
All eyes showed a disruption of the IS/OS line except the left eye of patient 3 who had a visual acuity of 20/20; meanwhile the IS/OS line and the third line are easily identifiable in normal control. Both eyes of patients 1 and 2 had a severe disruption of IS/OS line in the center of the fovea, and both had a low-intensity space between the elevated external limiting membrane (ELM) and the retinal pigment epithelium (RPE) (). In patient 3, the IS/OS line and the RPE line were disrupted, and the retina was thinner ( and ). The outer segment layer between the IS/OS line and RPE line of the FD-OCT images was visible only in the center of the fovea in the left eye of patient 4 ().
Figure 2 Fourier-domain optical coherence tomography (FD-OCT) images (horizontal scan) of normal eye (A), and right/left eyes of patient 1 (B, C), patient 2 (D, E), patient 3 (F, G), and patient 4 (H, I). Horizontal bars represent 500 μm, and vertical bars represent 200 μm. The eyes in patients 1–4 had a bilateral symmetric decline in visual acuity, whereas those in patient 5 had an assymmetric decline (20/200 right eye, 20/20 left eye). FD-OCT in normal eye provided clear images of the retinal layers. The external limiting membrane (ELM), photoreceptors inner and outer segment (IS/OS) junction, third line, and retinal pigment epithelium (RPE) are distinguishable. Meanwhile, the retinal photoreceptor layer is not clear in the eyes of the patients. Although ELM was visualized in all eyes, IS/OS is elevated and disrupted in fovea (B, C, D, E, H), widely disrupted and not clear (F, G), and clearly visualized in one eye (I). The third line was visualized only in one eye (I), just in the fovea.
AO fundus images
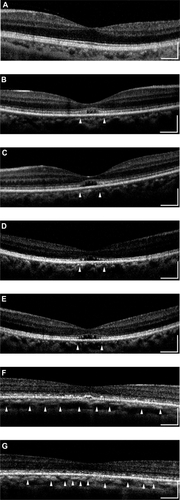
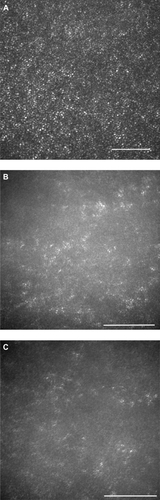
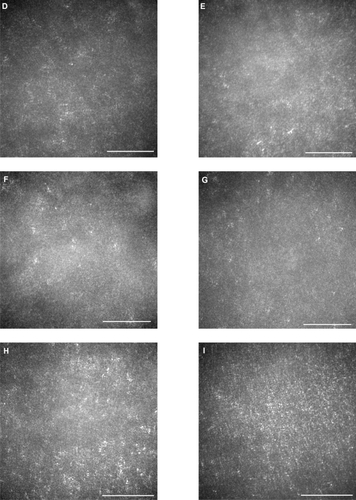
The AO images showed patchy dark areas in all eyes, which disrupted the mosaic of bright spots in the fovea (), compared with normal control (). This suggested a degeneration of some of the photoreceptors in this area. Nonuniform bright spots with irregular shapes and higher brightness appeared around the dark areas. In patient 3, the normal cone mosaic was replaced by dark areas, and nonuniform bright spots appeared to be all that remained ( and ). In the left eye of patient 4, the mosaic of blight spots were in relatively good order with fewer dark areas in the center of the image (), although the mosaic was disrupted in the peripheral area.
Figure 3 Adaptive optics (AO) images of the fovea of a normal eye (A), and right/left eyes of patient 1 (B, C), patient 2 (D, E), patient 3 (F, G), and patient 4 (H, I). Bars represent 100 μm. In the eyes of the patients, signals from the cone mosaic were attenuated, and the bright spots were distorted (B–H). One eye which had normal visual acuity had an almost normal appearance in the foveal center, with some dark areas around the fovea.
Discussion
We had hypothesized that the main structures affected in eyes with OMD were the photoreceptors as in other types of retinal dystrophy, and the morphological changes of the photoreceptor could be detected by high-resolution retinal imaging techniques. This is important in eyes with OMD because histopathological sections of eyes with OMD have not been published. In cone-rod dystrophy, a loss of cones in the perifoveal area has been reported, and the number of cones is reduced in the extrafoveal and peripheral areas.Citation25,Citation26 In addition, the length of photoreceptor outer segments has been reported to be shortened,Citation25,Citation26 and an accumulation of lipofuscin granules in the RPE has also been reported in these eyes.Citation26
The FD-OCT images showed a disruption of the IS/OS line and a loss of the third highly reflective line in the center of the fovea in all eyes except for the left eye of patient 4 whose BCVA was good. These findings are consistent with recent reports that there was a significant correlation between the disturbance of the IS/OS junction and the BCVA.Citation7,Citation10,Citation11
The origin of the third bright line in the FD-OCT images has not been determined. It cannot be detected in highly myopic eyes even if the patient has good visual acuity. This suggests that the third line cannot be resolved if the length of photoreceptor outer segments is not long enough. In our patient, the third line was not detected even though they were not highly myopic. We suggest that the shortening of the photoreceptor outer segments is the reason why the third bright line cannot be seen in the FD-OCT images. However, the third line was seen in the center of the foveal area of the left eye of patient 4. In this case, we suggest that the photoreceptor outer segments were long enough in this area, and the visual acuity had not yet decreased. The AO images showed the lateral extent of the photoreceptor changes with patchy dark areas and irregular bright spots around the foveal center. There are reports of the AO findings in patients with cone-rod dystrophy (CRD) with increased cone spacing.
Until now, ophthalmologists could detect photoreceptor degeneration only by conventional ophthalmoscopy and electroretinography. In OMD patients, the photoreceptor damage is mild, and it cannot be detected by conventional ophthalmoscopy. The mfERGs are useful for detecting reduced cone function, although the result of mfERGs may be unreliable in subjects with fixation problems, such as young children and patients with eccentric fixation.Citation27 FD-OCT and AO are noninvasive and effective methods to observe photoreceptor damage and confirm a diagnosis.
The future applications of AO fundus examinations include monitoring disease progression and measuring the effect of treatment. Further investigations are needed to interpret and quantify the features of these images.
In conclusion, the morphological changes of OMD patients can be seen tangentially by FD-OCT and en-face by AO.
This study was supported by Health Sciences Research Grants (H19-sensory-001) from the Ministry of Health, Labor and Welfare, and by Grants (19209053) from the Ministry of Education, Culture, Sports, Science and Technology, Japan.
Disclosure
The authors report no conflicts of interest in this work.
References
- MiyakeYHoriguchiMTomitaNOccult macular dystrophyAm J Ophthalmol199612256446538909203
- PiaoCHKondoMTanikawaAMultifocal electroretinogram in occult macular dystrophyInvest Ophthalmol Vis Sci200041251351710670483
- FujiiSEscañoMFIshibashiKMultifocal electroretinography in patients with occult macular dystrophyBr J Ophthalmol199983787988010636668
- KondoMItoYUenoSPiaoCHFoveal thickness in occult macular dystrophyAm J Ophthalmol2003135572572812719092
- BrockhurstRJSandbergMAOptical coherence tomography findings in occult macular dystrophyAm J Ophthalmol2007143351651817317401
- DrexlerWSattmannHHermannBEnhanced visualization of macular pathology with the use of ultrahigh-resolution optical coherence tomographyArch Ophthalmol2003121569570612742848
- SchocketLSWitkinAJFujimoroJGUltrahigh-resolution optical coherence tomography in patients with decreased visual acuity after retinal detachment repairOphthalmology2006113466667216581427
- AlamSZawadzkiRChoiSClinical application of rapid serial Fourier-domain optical coherence tomography for macular imagingOpthalmology2006113814251431
- ErgunEHermannBWirtitschMAssessment of central visual function in Stargardt disease/fundus flavimaculatus with ultrahigh-resolution optical coherence tomographyInvest Ophthalmol Vis Sci200546131031615623790
- OjimaYHangaiMSasaharaMThree-demensional imaging of the foveal photoreceptor layer in central serous chorioretinopathy using high-speed optical coherence tomographyOphthalmology2007114122197220717507096
- PiccolinoFCde la LongraisRRRaveraGThe foveal photoreceptor layer and visual acuity loss in central serous chorioretinopathyAm J Ophthalmol20051391879915652832
- IidaTHagimuraNSatoTEvaluation of central serous chorioretinopathy with optical coherence tomographyAm J Ophthalmol20001291162010653407
- KitaguchiYFujikadoTBesshoKAdaptive optics fundus camera to examine localized changes in the photoreceptor layer of the foveaOphthalmology2008115101771177718486223
- LiangJWilliamsDRMillerDTSupernormal vision and high resolution retinal imaging through adaptive opticsJ Opt Soc Am A Opt Image Sci Vis19971411288428929379246
- KitaguchiYFujikadoTKusakaSImaging of titanium:sapphire laser retinal injury by adaptive optics fundus imaging and Fourier-domain optical coherence tomographyAm J Ophthalmol2009148197104.e219327747
- RoordaAWilliamsDRThe arrangement of three cone classes in the living human eyeNature1999397671952052210028967
- RoordaAWilliamsDROptical fiber properties of individual human conesJ Vis20022540441212678654
- RoordaARomeroBFDonnellyWJAdaptive optics scanning laser ophthalmoscopyOpt Express200210940541219436374
- PallilkarisAWilliamsDRHoferHThe reflectance of single cones in the living human eyeInvest Ophthalmol Vis Sci200344104580459214507907
- WolfingJIChungMCarrollJHigh-resolution retinal imaging of cone-rod dystrophyOphthalmology200611361019.e116650474
- DuncanJLZhangYGandhiJHigh-resolution imaging with adaptive optics in patients with inherited retinal degenerationInvest Ophthalmol Vis Sci20074873283329117591900
- ChoiSSDoubleNHardyJLIn vivo imaging of the photoreceptor mosaic in retinal dystrophies and correlations with visual functionInvest Ophthalmol Vis Sci20064752080209216639019
- KitaguchiYBesshoKYamaguchiTIn vivo measurements of cone photoreceptor spacing in myopic eyes from images obtained by adaptive optics fundus cameraJpn J Ophthalmol200751645646118158598
- YamaguchiTNakazawaNBesshoKAdaptive optics fundus camera using a liquid crystal phase modulatorOptical Review2008153173180
- RabbMFTsoMOFishmanGACone-rod dystrophy. A clinical and histopathologic reportOphthalmology19869311144314513808606
- DemirciFYGuptaNRadakALHistopathologic study of X-linked cone-rod dystrophy (CORDX1) caused by a mutation in the RPGR exon ORF15Am J Ophthalmol2005139238638815734019
- KondoMMiyakeYHoriguchiMClinical evaluation of multifocal electroretinogramInvest Ophthalmol Vis Sci19953610214621507657552