Abstract
Purpose:
To investigate the effects of transcorneal electrical stimulation (TES) on eyes that have a branch retinal artery occlusion (BRAO).
Subjects and method:
We studied two eyes having a BRAO, with an interval between the onset of symptoms and the beginning of treatment of >16 weeks (longstanding cases), and in three eyes with an interval of <16 weeks (fresh cases). The visual functions of the eyes were assessed by the best-corrected visual acuity (BCVA), multifocal electroretinograms (mfERGs), and automated static perimetry with the Humphrey field analyzer (HFA). The mfERGs were recorded before and 1 month after the TES, and perimetry with the HFA was done before and at 1 and 3 months after the TES. The amplitudes and implicit times of the N1, P1, and N2 components of the mfERGs were analyzed.
Results:
TES did not alter the BCVA significantly in all eyes, but it led to a significant increase in the amplitude of the N2 wave of the mfERGs (P < 0.01). The amplitude of the N1–P1 was also increased but not significantly. The implicit times of N1 (P < 0.01) and P1 (P < 0.05) were significantly shorter than that before the TES. The mean deviation of the HFA was increased after the TES but only in the longstanding cases.
Conclusion:
Our results indicate that TES improves the visual function in eyes with BRAO, mainly in longstanding cases.
Introduction
Retinal artery occlusions (RAOs) usually lead to permanent retinal damage and a decrease of vision. There are two types of RAOs with very different clinical features: the central retinal artery occlusion (CRAO) and the branch retinal artery occlusion (BRAO). A CRAO results in a severe decrease of visual function due to the decrease or blockage of retinal blood flow to the macula. If anticoagulant or vasodilator therapy is not initiated rapidly, visual prognosis is poor. In contrast, a BRAO leads to visual field defects corresponding to the ischemic retinal areas, and if the BRAO does not involve the fovea, the patient has relatively good vision. Hayreh et al reported that even if a case had a visual acuity <20/40 at the initial examination, 79% of these cases can have an improvement of their visual acuity.Citation1 However, the decrease in the visual functions of both types is permanent unless the treatment starts soon after the occlusion.
Transcorneal electrical stimulation (TES) is a relatively noninvasive method of activating the retina electrically. Experiments on animal models have shown that TES protects the retinal ganglion cells (RGCs) and photoreceptors from degeneration, possibly by upregulating certain bioactive factors; for example, IGF-1 (insulin-like growth factor-1), BDNF (brain derived neurotrophic factor), CNTF (ciliary neurotrophic factor), and Bcl-2 (B-cell lymphoma 2).Citation2–Citation8 In addition, TES has been shown to improve the visual function in patients with traumatic optic neuropathy, anterior ischemic optic neuropathy,Citation9 and RAOsCitation10 with only minor complications. Thus, there is some evidence that TES improves visual function including visual field defects and multifocal electroretinograms (mfERGs) in longstanding cases of CRAO and BRAO, although the number of cases is still small. This suggested that TES may improve the retinal function even in cases of long duration (longstanding cases). But it has not been determined whether TES will be effective on fresh cases of RAOs which might be more effective than longstanding cases.
Thus, the purpose of this study was to determine whether TES improves the visual function of three fresh cases of BRAO and two cases of longstanding BRAO. Static perimetry and mfERG were used to assess visual function before and after the TES.
Patients and methods
TES was performed on five cases of BRAO, and all had best-corrected visual acuity (BCVA) of ≥1.0 decimal acuity. The clinical features of each case are summarized in . The protocol used was approved by Institutional Review Board of the Hyogo College of Medicine. The procedures conformed to the tenets of the Declaration of Helsinki, and an informed consent was obtained from all participants after an explanation of the procedures.
Table 1 Clinical features of five cases with BRAO
The cases were divided into two groups based on the interval between the onset of the symptoms and the beginning of TES. The cases with an interval <16 weeks were defined as fresh cases, because retinal infarcts are resolved by 6 weeks in 80% of the BRAO cases, and optic disc pallor does not appear before 13.6 weeks in 33% patients.Citation1 The cases with an interval of >16 weeks were defined as longstanding cases.
TES was performed as in previous reports.Citation9,Citation11–Citation13 The cornea was anesthetized with 0.4% oxybuprocaine hydrochloride and covered with 3% hyaluronic acid and 4% chondroitin sulfate (Viscot Alcon Japan Tokyo Japan). A bipolar Burian-Allen contact lens electrode (Hansen Ophthalmic Laboratories, Iowa, IA, USA) was placed on the cornea. Electric current pulses were delivered from an electronic pulse generator (Nihon Koden, Tokyo, Japan) through a stimulus isolation unit (WPI, Sarasota, FL, USA) to the two concentric electrodes embedded in the contact lens. The threshold current to elicit phosphenes was determined by increasing the current intensity from 0 to 1000 μA. The currents were biphasic pulses at 20 Hz, and the duration of each TES session was 30 minutes. The intensity to elicit a phosphene ranged between 500 and 900 μA, and the phosphene was perceived in both the peripheral and central visual fields.
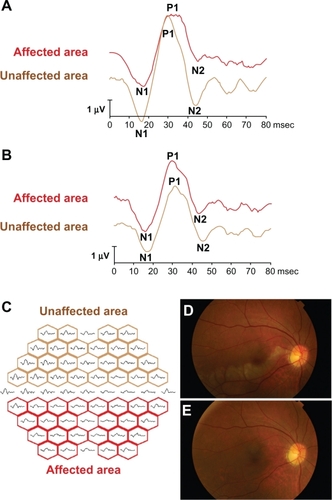
The mfERGs were recorded from the affected eye with the Visual Evoked Response Imaging system (VERIS)® before and 1 month after the TES following the International Society for Clinical Electrophysiology of Vision (ISCEV) guidelines.Citation14,Citation15 The central 50 degrees of the fundus was stimulated by an array of 61 hexagonal stimuli that were displayed on a monochromatic monitor. The luminance of each hexagon was alternated between black and white according to a pseudorandom binary m-sequence at a rate of 75 Hz. An X-shaped fixation target was displayed at the center of the monitor, and the fixation was carefully monitored during the recordings. The best refractive correction for the target distance was worn during the recordings. The recording sessions were divided into eight approximately equal segments. The signals were amplified 105 times, and the band pass filters were set at 10 and 300 Hz. The data were analyzed using the VERIS Science 4.1.1 analysis program (Electro Diagnostic Imaging, Redwood City, CA, USA). The initial negative wave was designated as N1, the following positive wave was designated as P1, and the following negative wave was designated as N2. The implicit time of N1, P1, and N2 was taken to be the time from stimulus onset to the peak of N1, P1, and N2, and the amplitude was assessed as the peak-to-peak amplitude of N1 and P1. The amplitude of N2 was assessed as the amplitude of the N2 peak measured from the baseline ( and ). The mfERGs were grouped into the unaffected and affected areas along the horizontal midline (). The sum of amplitudes of N1–P1 or N2 waves in each area was calculated, and the ratio of the affected area to the unaffected area was calculated. Similarly, the ratios of the implicit times of P1, N1 and N2, and N2 for the affected and unaffected areas were calculated.
Figure 1 The representative mfERGs before and after TES and mfERGs are divided into two response groups are shown. The representative changes of the mfERGs before (A) and after (B) three sessions of TES. After TES, the mfERGs in the affected area are improved (red line). The all trace arrays are divided into two groups (C); the affected areas (red boxes) and unaffected areas (brown boxes) by the horizontal line. The amplitudes of N1–P1 and N2 in the affected and unaffected areas were measured, and the ratio of the sum of the affected areas and of the unaffected areas were calculated. In the same way, we summed the implicit times of N1, P1, or N2 in each area and calculated the ratio of affected area and unaffected area. The fundus photographs before (D) and after (E) TES in the fresh case (No. 4 case in ). The retinal opacity was found in the lower macular area before TES (D). Twenty-four months after TES, the retinal degeneration appeared corresponding to the ischemic lesion, but any other retinal changes did not occur.
Automated static perimetry was performed under full correction of the refractive error using the Humphrey field analyzer (HFA) central 30–2 program. Visual fields were obtained before, and 1 and 3 months after TES, and only reliable data that had <20% fixation errors, <33% false positives, and <33% false negatives were used in the analyses.
The statistical analyses were performed by paired t-tests between the pre-TES and one of the three post-TES values. Differences in the two values were taken to be significant when P was < 0.05.
Results
There were three men and two women whose average age was 69 ± 3.6 (±standard deviation) years. The average interval between the onset of the visual symptoms and the beginning of the TES was 24 ± 33 weeks. Two of the eyes had an interval of >16 weeks, and the other three cases had an interval <16 weeks ().
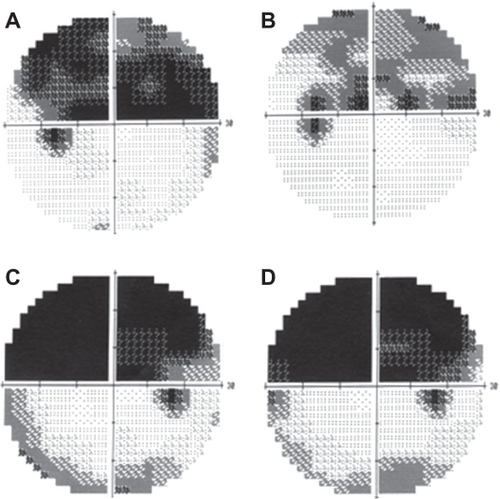
After the TES, the fundus in all cases was normal without signs of degeneration ( and ). The BCVA did not decrease significantly in any of the cases after the TES (data not shown). All longstanding cases had a >3 dB increase in the mean deviation of the visual fields after TES ( and ; ). On the other hand, the mean deviation did not increase in the three fresh cases ( and ; ).
Figure 2 Change of visual fields after TES. (A, B) Visual fields of Case 2. Change of visual fields in a longstanding case before (A) and one month after (B) TES. The superior visual field defect is decreased. (C, D) Visual fields of Case 3. The change of the visual field in a fresh case before (C) and one month after (D) TES. The visual field defect is unchanged after TES.
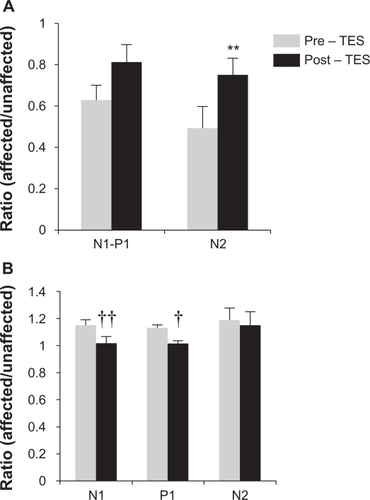
The results of earlier studies of TES on longstanding cases of BRAO and CRAO showed that TES improved the visual field defects determined by kinetic perimetry and mfERGs in cases that had an interval of >6 months before the beginning of TES.Citation10 We were able to record the mfERGs with good fixation, and our results showed that the amplitudes of all components were increased and the implicit times reduced (). Among these improvements, the relative N2 amplitude was significantly increased (pre-TES, 0.49 and post-TES, 0.75, P = 0.007, paired t-tests; and ). The ratio of the implicit times of N1 and P1 before TES were 1.15 and 1.13, respectively, and the ratios were 1.02 and 1.01, respectively, after the TES. These values were significant different from the pre-TES (P = 0.002, P = 0.01, paired t-tests). The ratio of implicit time of N2 was very slightly reduced, but the reduction was not significant (pre-TES 1.19 and post-TES 1.15, P = 0.15, paired t-test).
Figure 3 The ratio of an affected and unaffected area of each multifocal electroretinogram components. A) Ratio of N1–P1 and N2 amplitude before and 1 month after TES. N1–P1 and N2 amplitudes are increased after TES, N2 amplitude was significant (P < 0.05, paired t-test). B) Ratio of implicit times of N1, P1, and N2 before and 1 month after TES. N1 and P1 implicit times were decreased in comparison to the level of pre-TES. N1 and P1 had a significant decrease in the implicit times (P < 0.01 and P < 0.05, respectively).
Abbreviation: TES, transcorneal electrical stimulation.
Discussion
Our results showed that TES led to a significant increase in the amplitude of the N2 wave of the mfERGs (P < 0.01), and the amplitude of the N1–P1 was also increased but not significantly. The implicit times of N1 (P < 0.01) and P1 (P < 0.05) were significantly shorter than before the TES. The mean deviation of the HFA was increased after the TES in the longstanding cases but not fresh cases.
Hasegawa et al demonstrated that the amplitudes of the N1 and P1 components of the mfERGs in eyes with a BRAO were reduced.Citation16 Experimental studies on rhesus monkeys showed that more than 105 minutes of clamping of the central retinal artery induced irreversible retinal damage in the nerve fiber layer, retinal ganglion cell layer, inner plexiform layer, and the inner nuclear layer.Citation17 Pharmacological studies on rhesus monkeys showed that N1 is reduced after intravitreous injection of cis-2,3 piperidine dicarboxylic acid (PDA), a glutamate analog that blocks the transmission from photoreceptors to OFF-bipolar cells. P1 is suppressed by 2-amino-4 phosphonobutyric acid (APB), a selective blocker of the synaptic transmission from photoreceptors to the ON-bipolar cells of the ON response pathway.Citation18,Citation19
These findings suggest that neurons in both the inner and outer retina contribute to the amplitudes of N1 and P1. From this, it is reasonable to suggest that the alterations of the mfERGs in eyes with a BRAO reflect damage of the inner and outer retina.
Experimental studies on a chronic glaucoma model induced by laser irradiation of the anterior chamber angle showed that N2 was reduced more than P1 and N1 suggesting that the N2 component originated mainly from the RGC layer.Citation18 Our results showed that the amplitudes and implicit times of all components of the mfERGs, except the implicit time of N2, were improved after TES. Thus, our data suggest that TES had beneficial effects on both the inner and outer retina after BRAO, as was reported in animal experiments, although it still has not been determined whether TES will affect the retinal thickness.Citation17
Inomata et al demonstrated that monthly TES improved visual field defects and mfERGs in eyes with CRAO and BRAO that had >15 months interval between the onset of symptoms and the beginning of TES therapy.Citation10 Our results showed that the mean deviation of the HFA and the components of mfERGs of longstanding cases improved, although the visual field of fresh cases did not improve. These findings were not expected, as we expected that fresh cases would improve while the longstanding cases would not improve. One possibility for this difference is that our cases may include cases whose retinal vessels re-canalized soon or whose degree of occlusion was partial, so that retinal function could still recover after the resolution of the retinal edema. However, we studied only three fresh cases and two longstanding cases in the present study. Thus, more cases are needed to confirm the difference of TES effects between fresh and longstanding cases.
It has been reported that TES increases the chorioretinal blood flow in normal individuals, which may contribute to the improvement of visual function in cases with BRAO.Citation13 The exact mechanism of how TES improves retinal function still remains undetermined, and further investigations are needed to determine whether TES preserves the retinal thickness after arterial occlusion. It must also be determined whether TES affects fresh and longstanding cases with RAOs differently.
Acknowledgements
We thank Professor Duco Hamasaki, Bascom Palmer Eye Institute, University of Miami School of Medicine, for editing this manuscript.
Disclosure
The authors declare that they have no conflict of interest.
References
- HayrehSSPodhajskyPAZimmermanMBBranch retinal artery occlusion: natural history of visual outcomeOphthalmology200911661188119419376586
- MorimotoTMiyoshiTMatsudaSTranscorneal electrical stimulation rescues axotomized retinal ganglion cells by activating endogenous retinal IGF-1 systemInvest Ophthalmol Vis Sci20054662147215515914636
- MiyakeK-iYoshidaMInoueYNeuroprotective effect of transcorneal electrical stimulation on the acute phase of optic nerve injuryInvest Ophthalmol Vis Sci20074852356236117460302
- MorimotoTFujikadoTChoiJ-STranscorneal electrical stimulation promotes the survival of photoreceptors and preserves retinal function in royal college of surgeons ratsInvest Ophthalmol Vis Sci200748104725473217898297
- SatoTFujikadoTLeeT-SDirect effect of electrical stimulation on induction of brain-derived neurotrophic factor from cultured retinal Müller cellsInvest Ophthalmol Vis Sci200849104641464618539944
- SatoTFujikadoTMorimotoTEffect of electrical stimulation on IGF-1 transcription by L-type calcium channels in cultured retinal Müller cellsJpn J Ophthalmol200852321722318661273
- TagamiYKurimotoTMiyoshiTAxonal regeneration induced by repetitive electrical stimulation of crushed optic nerve in adult ratsJpn J Ophthalmol200953325726619484445
- NiYQGanDKXuHDXuGZDaCDNeuroprotective effect of transcorneal electrical stimulation on light-induced photoreceptor degenerationExp Neurol2009219243945219576889
- FujikadoTMorimotoTMatsushitaKEffect of transcorneal electrical stimulation in patients with nonarteritic ischemic optic neuropathy or traumatic optic neuropathyJpn J Ophthalmol200650326627316767383
- InomataKShinodaKOhdeHTranscorneal electrical stimulation of retina to treat longstanding retinal artery occlusionGraefes Arch Clin Exp Ophthalmol2007245121773178017593383
- MorimotoTFukuiTMatsushitaKEvaluation of residual retinal function by pupillary constrictions and phosphenes using transcorneal electrical stimulation in patients with retinal degenerationGraefes Arch Clin Exp Ophthalmol2006244101283129216550408
- FujikadoTMorimotoTKandaHEvaluation of phosphenes elicited by extraocular stimulation in normals and by suprachoroidal-transretinal stimulation in patients with retinitis pigmentosaGraefes Arch Clin Exp Ophthalmol2007245101411141917342502
- KurimotoTOonoSOkuHTranscorneal electrical stimulation increases chorioretinal blood flow in normal human subjectsClin Ophthalmol201044144141446
- HoodDCBachMBrigellMISCEV guidelines for clinical multifocal electroretinography (2007 edition)Doc Ophthalmol2008116111117972125
- MarmorMFHoodDCKeatingDGuidelines for basic multifocal electroretinography (mfERG)Doc Ophthalmol2003106210511512678274
- HasegawaSOhshimaAHayakawaYMultifocal electroretinograms in patients with branch retinal artery occlusionInvest Ophthalmol Vis Sci200142129830411133882
- HayrehSSZimmermanMBKimuraACentral retinal artery occlusion. Retinal survival timeExp Eye Res200478372373615106952
- HareWATonHEffects of APB, PDA, and TTX on ERG responses recorded using both multifocal and conventional methods in monkey. Effects of APB, PDA, and TTX on monkey ERG responsesDoc Ophthalmol2002105218922212462444
- HoodDCFrishmanLJSaszikSRetinal origins of the primate multifocal ERG: implications for the human responseInvest Ophthalmol Vis Sci20024351673168511980890