
 ?Mathematical formulae have been encoded as MathML and are displayed in this HTML version using MathJax in order to improve their display. Uncheck the box to turn MathJax off. This feature requires Javascript. Click on a formula to zoom.
Abstract
Purpose
To quantify peripapillary microvasculature within the retinal nerve fiber layer (RNFL) in primary open-angle glaucoma (POAG) and normal eyes, determine association of perfusion parameters with structural and functional measures, and report diagnostic accuracy of perfusion parameters.
Patients and methods
POAG and normal patients underwent 6×6 mm2 optic nerve head scans (Angioplex optical coherence tomography angiography [OCTA]; Cirrus HD-OCT 5000) and Humphrey Field Analyzer II-i 24-2 visual field (VF) testing. Prototype software performed semiautomatic segmentation to create RNFL en face images and quantified vessel area density (VAD), vessel skeleton density (VSD), and vessel complexity index (VCI) in the optic nerve head globally and focally. Generalized estimating equations models assessed association of OCTA parameters with VF mean deviation (MD) and RNFL thickness.
Results
Thirty-eight POAG and 17 normal eyes were studied. Global VAD, VSD, and VCI were reduced in mild POAG vs normal (P<0.02) and moderate-severe vs mild POAG (P<0.04). Stepwise focal reductions across disease stage were demonstrated for OCTA parameters in the inferior hemisphere (P<0.05); reduction in OCTA parameters in mild POAG vs normal was demonstrated in inferior and superior quadrants (P<0.05). Reduced global VF MD was associated with reduced VAD, VSD, and VCI (P=0.0007, 0.0013, <0.0001; R2=0.449, 0.312, 0.399, respectively), and global RNFL thickness was associated with VAD, VSD, and VCI (P<0.0001; R2=0.499, 0.524, 0.542), superior and inferior hemifield MD were associated with corresponding VAD, VSD, and VCI (P≤0.001; R2 from 0.208 to 0.513). RNFL thickness in all quadrants was associated with corresponding OCTA parameters (P<0.05; R2 from 0.213 to 0.394), except temporal VAD and VCI. Area under curves for VAD, VSD, and VCI demonstrated good diagnostic ability (0.868, 0.855, 0.868; P<0.0001).
Conclusion
Glaucomatous eyes showed stepwise reductions in RNFL microcirculation across severity; focal reductions in the inferior hemisphere and inferior and superior quadrants were most significant. OCTA parameters had stronger associations with structural rather than functional measures of glaucoma.
Introduction
Primary open angle glaucoma (POAG) is a progressive optic neuropathy, characterized by loss and remodeling of neural tissue, activation of glia, and altered blood flow.Citation1 Neural degeneration typically begins at the retinal ganglion cell axons, with resulting excavation of the neuroretinal rim and corresponding visual field (VF) deficits.Citation2 Traditionally, stereoscopic disc examination and VF testing have been used to detect glaucomatous disease and its progression. Stereoscopic disc examination is limited in its ability to detect subtle nerve changes,Citation3 and VF testing lacks in terms of reproducibility and patient cooperation. Thus, both are imperfect markers of glaucomatous damage.Citation4 The use of optical coherence tomography (OCT) to measure retinal nerve fiber layer (RNFL) thickness in the peripapillary region and superficial macular thickness is now widespread and has demonstrated good diagnostic utility.Citation5–Citation11 Nonetheless, structural OCT measurements are limited in their ability to identify early disease or detect progression in late disease, have moderate correlation with VF findings,Citation12–Citation16 and can have limited diagnostic utility in atypical optic nerves such as those in high myopesCitation17–Citation20 or uveitis.Citation21
While structural assessment of neural tissue loss, via OCT measures and optic nerve exam, and functional measures of glaucomatous damage, via VF testing, are currently the standard for detecting and monitoring glaucoma, several lines of evidence suggest that reduced ocular blood flow (OBF) is associated with and may even predict glaucoma.Citation22 This is consistent with the vascular pathogenic concept of glaucoma, which hypothesizes that vascular dysfunction can sometimes be a primary cause of glaucomatous nerve damage.Citation23,Citation24 While previous techniques, such as fluorescein angiography and Doppler OCT, have been able to detect overall reduced optic disc perfusion in glaucoma,Citation25–Citation27 optical coherence tomography angiography (OCTA) provides a more precise, non-invasive means for assessing the perfused retinal microvasculature quantitatively and at specific layers of the retina.Citation28–Citation36
In this study, we used an optical microangiography (OMAG)-based prototype software to precisely segment the RNFL. From the generated en face images, we aimed to quantify the radial peripapillary capillaries (RPCs), which are the perfused retinal microvasculature within the RNFL,Citation37 in glaucoma and normal patients using three OCTA measures (vessel area density [VAD], vessel skeleton density [VSD], and vessel complexity index [VCI]),Citation38 determine its sectoral correlation with traditional structural and functional measures of glaucoma, and report the diagnostic accuracy of these OCTA measures. Characterizing the diagnostic utility of OCTA measurement of RPCs in focal peripapillary regions and comparing their correlations with traditional structural and functional measures of glaucoma may provide insight into glaucoma pathogenesis and utility of OCTA in early disease detection.
Materials and methods
Subject recruitment
This study was performed with the participation of patients presenting to optometry and glaucoma services at the University of Southern California Roski Eye Institute. The research protocol was approved by the University of Southern California Health Sciences Campus Institutional Review Board and executed in accordance with the Declaration of Helsinki and Health Insurance Portability and Accountability Act regulations. Subjects were apprised of the nature and intent of the study, and their written informed consent was subsequently obtained.
Diagnosis of POAG was based on the assessment of a fellowship-trained glaucoma specialist, incorporating clinical exam demonstrating an optic nerve rim defect (notching or localized thinning) characteristic of glaucoma and the presence of an open angle on gonioscopy. RNFL thickness and deviation maps from OCT (Cirrus HD-OCT 5000; Carl Zeiss Meditec, Dublin, CA, USA) were retrospectively reviewed for all patients and also demonstrated focal RNFL thinning consistent with funduscopic disc findings. For perimetric glaucoma, Humphrey Swedish Interactive Threshold Algorithm 24-2 VFs had at least one of the following three: a glaucoma hemifield test outside normal limits, pattern standard deviation (PSD) outside normal limits (P>0.05), or a cluster of three or more adjacent points in characteristic glaucomatous locations, all of which were reduced on the pattern deviation plot at a P<5% level. POAG severity was determined based on VF testing, with “mild” POAG defined as demonstrating a global mean deviation (MD) better than −6 dB, and “moderate-severe” POAG having a global MD worse than −6 dB.Citation32,Citation39 Normal subjects in this study presented to USC clinics with non-glaucomatous optic discs, no family history of glaucoma, and intraocular pressure (IOP) ≤21 mmHg. Inclusion criteria for both glaucoma and normal groups included age ≥30 years and best corrected visual acuity of 20/40 or better. Exclusion criteria included known media opacities (significant corneal scar or cataract), macular or other retinal or optic nerve disease, history of ocular trauma or ocular surgeries other than uncomplicated cataract and glaucoma surgery, and unreliable VF tests (>33% fixation losses, false negative, and false-positive results). OCTA images with signal strength ≥6 (out of 10) and no qualitatively observable motion, media opacity (ie, vitreous opacities), or defocus artifacts were included in the study.
All subjects underwent slit lamp biomicroscopy, IOP measurement with Goldman applanation tonometry; VF testing (Humphrey Visual Field 24-2; Zeiss); OCT imaging of RNFL thickness (Cirrus 5000 spectral-domain OCT; Zeiss); and OCT angiography imaging (Angioplex OCTA; Zeiss), obtaining 6×6 mm2 scans centered on the optic nerve head. The OCTA imaging system incorporated the FastTrac™ algorithm (Zeiss) to correct for motion artifact. The OCT system calculated RNFL thickness along a 3.4 mm diameter circle centered on the optic disc using the Cirrus AutoCenter™ function (Zeiss).
Clinical charts were reviewed retrospectively to obtain demographic information for both glaucomatous and normal eyes, including age, sex, IOP, central corneal thickness, glaucoma medications, blood pressure medications, history of glaucoma surgery, diabetes, hypertension, vertical cup-to-disc ratio, and average RNFL thicknesses globally and sectorally.
VF and OCTA image analysis
Humphrey Visual Field 24-2 global MD and PSD were recorded from the VF output. The MDs for the individual superior and inferior hemifields in each eye were calculated by obtaining weighted averages of the total deviation values in each hemifield, using weightings provided by the manufacturer and based on the instrument’s normative database. This is the same procedure used for the instrument for calculation of total MD (Zeiss).
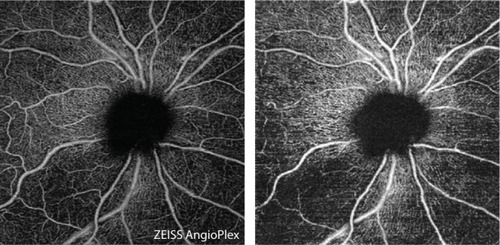
Prototype OMAG software was used to precisely segment the OCTA B-scans to create two-dimensional, 6×6 mm2 en face representations of the perfused RPCs of the RNFL ().Citation40 Custom quantification software with an interactive interface was used to quantify perfused retinal vascular density and morphology from three parameters for the segmented RPC en face image.Citation41 A binarized, black-and-white vessel map was extracted from the original grayscale image, using a three-way combined method consisting of a global threshold, Hessian filter, and adaptive threshold in MATLAB (R2016b, MathWorks, Inc., Natick, MA, USA). Avascular areas within the optic nerve head (ONH) were selected to serve as the threshold for background noise on an image-by-image basis to establish a baseline image-to-noise ratio. The ONH itself was then blacked out prior to quantification. Additionally, large vessels of more than 32 µm were subtracted from the blood flow en face image, allowing quantification to focus solely on the small and medium vessels. From the binarized image, a skeletonized vessel map was created by reducing the white vessel areas to a single-pixel diameter, allowing measurement of the statistical length of the moving blood column. Finally, a vessel perimeter map was created by outlining all vessels identified in the binarized image.
Figure 1 En face images (6×6 mm2) of the radial peripapillary capillaries of the optic nerve head, acquired by automatic (left) and semi-automatic (right) segmentation.
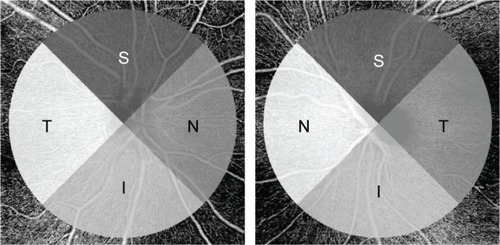
Each of these outputs, the binarized vessel area, skeletonized vessel length, and vessel perimeter maps were utilized in the calculation of perfusion parameters described in the following section. For all vessel parameters, quantification was limited to a circular area of radius 2.8 mm, centered in the middle of the ONH. This compensated for off-centering of the ONH and isolated the immediate peripapillary region for analysis. The area of analysis was further divided into quadrants for sectoral comparison with OCT RNFL thickness () and hemispheres for comparison with VF data.
Figure 2 Quadrants for focal analysis.
Using the binarized vessel map output, VAD was calculated as a unitless ratio of the total white image area (A(i,j)), representing vasculature, to the total image area (X(i,j)):
VAD provides comprehensive information about both perfused medium vessels and capillaries in each en face OCTA image.
Using the skeletonized vessel map output, VSD was calculated as the ratio of the combined length of the one-pixel-wide vasculature (S(i,j)) to the total image area (X(i,j), the unit of measurement being pixel/pixelCitation2:
Since vessel diameter was equalized in the skeletonized map, VSD emphasized perfused capillary-level vasculature and was thus a suitable marker for capillary density.
Using both the binarized vessel area map and the vessel perimeter map, the VCI was calculated by squaring the sum of the pixels on the perimeters of the vessels (P(i,j)) and dividing by 4π times the area of vasculature (A(i,j)):
This algorithm is widely applied in the digital image processing literatureCitation42 and potentially well-suited to detect tortuous, small vessels or capillary abnormalities. Theoretically, vessel tortuosity would lead to greater vessel complexity, which may have implications in the ischemic state of the retina.Citation43
Statistical analysis
SAS 9.4 software (SAS Institute Inc., Cary, NC, USA) and STATA 14.1 (StataCorp LP, College Station, TX, USA) were used for all data analyses. Wilcoxon rank sum tests were used to assess differences in subject-specific demographics between glaucoma and normal groups. Clustered Wilcoxon rank sum tests were performed to assess differences in eye-specific demographics between glaucoma and normal groups while controlling for inter-eye correlation, and to report differences between normal, mild POAG, and moderate-severe POAG (also controlling for inter-eye correlations). Area under receiver operating characteristic curve (AUC), controlling for age and inter-eye correlation, provided information about the diagnostic accuracy and utility of individual perfusion parameters. Intra-class correlation coefficients were calculated to test the agreement of OMAG results among three operators.
Generalized estimating equations (GEE) models were used to evaluate the strength of association between each of the perfusion parameters and RNFL thickness globally and by quadrant in POAG patients, controlling for age and inter-eye correlation. A GEE model was also used in comparing perfusion parameters with VF MD globally and across inferior and superior hemifields (inferior VF with superior perfusion, and vice versa). The beta obtained from the GEE models indicates the expected average unit increase in y per one unit increase in x.
Results
Of the 123 eyes from 80 POAG patients who underwent OCTA imaging of the ONH, 38 eyes from 30 POAG patients were studied. Of 23 normal eyes from 15 control subjects imaged over the same period, 17 eyes from 12 individuals were studied. The remaining 91 eyes were excluded due to poor image quality caused by motion artifact, media opacities, poor positioning or cooperation during imaging, and/or not meeting the exclusion or inclusion criteria. Nineteen eyes had mild POAG, two of which were preperimetric, and 19 eyes had moderate-severe POAG. Of the POAG eyes, 12 had both superior and inferior VF defects, 12 had superior defects alone, 12 had inferior defects alone, and two had neither. While the average age of POAG patients was 62 years (62 for mild and 64 for moderate-severe cases) and of control subjects was 55 years, this difference was not significant (P=0.087). Differences in sex, hypertension, diabetes, central corneal thickness, and IOP between POAG groups and controls were also insignificant (). Between groups of glaucoma severity, treatment with different numbers and types of medication and with surgery did not differ significantly, with the exception of timolol treatment (P=0.029), with greater timolol treatment in the more severe POAG group. However, higher magnitudes of VF MD and PSD, greater cup-disc ratio, and lower RNFL thickness were associated with more advanced POAG disease severity (). Further, global VAD, VSD, and VCI in the RNFL microvasculature were reduced in POAG compared to normal, while controlling for inter-eye correlation. Inter-grader reliability between three users for the segmentation software was determined, with intra-class correlation coefficients of 0.922 for VAD, 0.922 for VSD, and 0.906 for VCI. Intra-grader (test–retest) reliability was also determined, with intra-class correlation coefficients of 0.999 for VAD, VSD, and VCI.
Table 1 Demographic and clinical characteristics of normal and glaucomatous groups
Table 2 Mean OCTA parameter and OCT RNFL thickness values for normal subjects, mild, and moderate-severe POAG patients
Qualitative review of RNFL microcirculation en face images showed vascular attenuation globally and focally in POAG, with larger reductions in vessel density and complexity in more severe cases ( and ). Quantitatively, mean global VAD was 0.371±0.024 among normal but reduced to 0.336±0.036 in mild POAG (P=0.010) and further reduced to 0.308±0.037 (P=0.035 for mild vs moderate-severe) in moderate-severe glaucoma. Similar differences were seen for VSD (0.172±0.011 among normal, 0.156±0.017 in mild POAG, and 0.142±0.018 in moderate-severe glaucoma; P=0.020 for normal vs mild; P=0.036 for mild vs moderate-severe) and VCI (2.55±0.19 among normal, 2.26±0.23 in mild POAG, and 1.97±0.28 in moderate-severe glaucoma; P=0.0024 for normal vs mild; P=0.0047 for mild vs moderate-severe), as shown in . Similarly, global RNFL thickness was reduced in mild (P=0.014) and moderate-severe POAG (P=0.0042) compared to normal, and lower in moderate-severe POAG than in mild (P=0.022).
Figure 3 Moderate-severe glaucoma case (A) 6×6 mm2 en face image. (B) Skeletonized vessel image with large vessels removed. (C) Vessel density map with binary vessels, showing areas of higher vessel density in warmer colors. (D) Vessel complexity map with binary vessels, showing areas of greater vessel branching in warmer colors. (E) Cirrus OCT RNFL deviation map (top) and RNFL thickness by quadrant (bottom). (F) Probability total (left) and pattern (right) deviation maps.
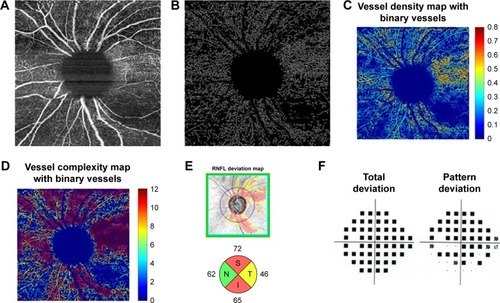
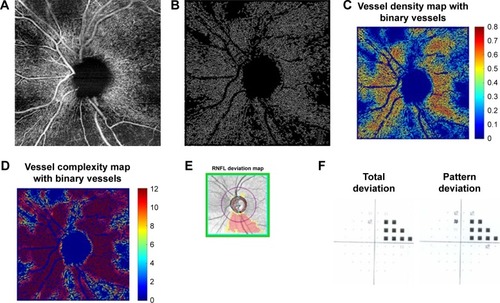
Figure 4 Mild glaucoma case (A) 6×6 mm2 en face image. (B) Skeletonized vessel image with large vessels removed. (C) Vessel density map with binary vessels, showing areas of higher vessel density in warmer colors. (D) Vessel complexity map with binary vessels, showing areas of greater vessel branching in warmer colors. (E) Cirrus OCT RNFL deviation map (top) and RNFL thickness by quadrant (bottom). (F) Probability total (left) and pattern (right) deviation maps.
Focal differences in perfusion parameters followed consistent patterns when analyzed by hemisphere and by quadrant. In the inferior hemisphere, VAD, VSD, and VCI were significantly lower in mild POAG than in normal subjects (Ps=0.0081, 0.0059, 0.00020, respectively), and lower in moderate-severe POAG than in mild POAG (Ps=0.021, 0.016, 0.042). In the superior hemisphere, however, while moderate-severe POAG patients demonstrated lower VAD, VSD, and VCI than in normal subjects (Ps=0.0076, 0.0076, 0.00020, respectively), no significant differences were detected between normal and mild POAG (except for VCI, P=0.00022) or between disease severities. Similarly, in the quadrant analysis, although VAD, VSD, and VCI were lower in all quadrants in moderate-severe POAG than in normal subjects (except VCI in the nasal quadrant, P=0.089), reductions in the same perfusion parameters in mild POAG compared to normal subjects were only evident in the superior (Ps=0.043, 0.018, 0.0046, respectively) and inferior (Ps=0.0024, 0.0011, 0.0019) quadrants. Focal reduction in perfusion parameters was not detected between mild and moderate-severe POAG in any quadrant (except VCI in the temporal quadrant, P=0.031). The same pattern of the inferior and superior quadrant showing significant focal reductions between normal and mild POAG (Ps=0.014, 0.0050, respectively) but not between mild and moderate-severe POAG was seen for RNFL thickness.
The strength of association of each perfusion parameter with functional (VF MD) and structural (RNFL thickness) measures was evaluated globally and focally. VAD, VSD, and VCI each demonstrated significant positive associations with VF MD globally (ßs=81.7, 167.4, 11.9; Ps=0.0007, 0.0013, <0.0001, respectively), with pseudo R2 values, which can be interpreted as the amount of variation in VF MD that can be determined by the GEE model, ranging from 0.312 to 0.449 (). These associations remained significant between superior VF MD and corresponding VAD, VSD, and VCI (ßs=198.3, 419.4, 19.5; Ps=0.0003, 0.0004, <0.0001, respectively), and between inferior VF MD and the same corresponding parameters (ßs=148.3, 347.9, 18.6; Ps=0.0005, 0.0005, <0.0001). However, superior VF MD had qualitatively higher correlations with inferior VAD, VSD, and VCI (R2s=0.396, 0.390, 0.513, respectively) than inferior VF MD with corresponding perfusion parameters (R2s=0.208, 0.237, 0.378, respectively). shows that global VAD, VSD, and VCI were significantly associated with global RNFL thickness as well (ßs=242.1, 516.7, 32.5, respectively; all Ps<0.0001), with pseudo R2 values ranging from 0.499 to 0.542. Associations between perfusion parameters and RNFL thickness in each quadrant were significant as well, with the excep tion of temporal VAD and VSD and corresponding RNFL thickness. The GEE models described in and controlled for inter-eye correlation.
Table 3 Linear regressionTable Footnotea of VF MD on OCTA parameters globally and by hemisphere in POAG
Table 4 Linear regressionTable Footnotea of RNFL thickness on OCTA parameters globally and by quadrant in glaucoma
demonstrates the diagnostic accuracy of each global perfusion parameter and RNFL thickness globally as measured by AUC, controlling for age and inter-eye correlation. Diagnostic accuracy was 0.868 for VAD (P<0.0001), 0.855 for VSD (P<0.0001), 0.868 for VCI (P<0.0001), and 0.973 for RNFL thickness (P<0.0001). There were no significant differences in diagnostic accuracy between any of the perfusion parameters and RNFL thickness (P=0.11 for VAD vs RNFL thickness; P=0.073 for VSD vs RNFL thickness; P=0.15 for VCI vs RNFL).
Table 5 Diagnostic accuracy of OCTA parameters
Discussion
In this study of OCTA in POAG, we used a prototype OMAG software that allowed for precise segmentation and analysis of the RPCs. We observed a significant global reduction in each of these perfusion parameters in POAG patients compared to control subjects with “good” diagnostic abilityCitation44 for each parameter in differentiating POAG from normal, comparable to RNFL thickness, as reported in previous studies.Citation29,Citation31,Citation38,Citation45–Citation49
All three global perfusion parameters, VAD, VSD, and VCI, in our study demonstrated significant stepwise differences between normal, mild POAG, and moderate-severe POAG. This stepwise difference was also evident for all three parameters for the inferior hemisphere, suggesting that the inferior region may have perfusion changes at an earlier stage of disease on average. In contrast, the superior hemisphere perfusion parameters mainly only had significant differences between normal and moderate-severe POAG. These data are consistent with the basic understanding that glaucomatous damage most often occurs first inferiorly, as has been demonstrated in structural OCT studies.Citation50–Citation52
In analyzing perfusion within particular quadrants, the inferior and superior quadrants were the best regions for distinguishing normal from mild disease for all perfusion parameters. In fact, this same result was also seen for quadrant RNFL thickness data. Interestingly, the quadrant data for both OCTA perfusion and OCT RNFL thickness were unable to detect differences between mild and moderate-severe disease. Though few studies have utilized orthogonal sector analysis, our findings corroborate those from previous studies that showed greater reductions in VAD and perfused capillary density in the inferior and superior quadrants.Citation38,Citation47,Citation49,Citation53 This supports the idea that early glaucomatous damage tends to be focal and most commonly in the inferior and superior locations, but later in disease, damage has a greater chance to become multifocal and thus a specific quadrant would be less likely to distinguish between the disease severities. There were significant differences for all four quadrants between normal and moderate-severe disease, suggesting that by the time there is more advanced disease, there is a more diffuse pattern of glaucomatous damage likely to affect all four quadrants. This trend was seen both for the three perfusion parameters, as well as for RNFL thickness, demonstrating that structural thickness and perfusion are affected similarly in glaucoma.
In terms of functional correlation, we found that VAD, VSD, and VCI were all associated with VF MD globally and for both hemispheres. Based on the GEE models, a global VF MD that is higher by approximately 0.8 dB is expected to occur with a VAD that is lower by 0.01. The correlation appeared qualitatively higher for the inferior perfusion parameters with superior VF MD than superior perfusion parameters with corresponding VF MD. This too may reflect the inferior nerve being more likely to have glaucomatous damage. While all were significant, the correlations of perfusion parameters with the structural measure of RNFL thickness globally were actually qualitatively higher than functional correlations. Although this observation has been made previously,Citation34,Citation48,Citation49,Citation54 others have found functional correlations to be stronger than structural ones,Citation29,Citation30,Citation32,Citation38,Citation45 and a longitudinal study of disease progression will be necessary to determine whether structural, functional, or vascular defects occur first. Nevertheless, given the limitations of OCT in diagnosing glaucoma in certain situations,Citation21,Citation55,Citation56 this suggests that OCTA has the potential to supplement OCT measures in diagnosis of glaucoma.
One of the key strengths of this study was the use of custom user-guided segmentation software, which allowed more precise analysis of the microcirculation at the RNFL. This is qualitatively evident in , which shows greater inferotemporal dropout in the custom segmented RNFL en face image on the right, while some of this contrast is lost in the automatically segmented image of the superficial retina on the left. Our study is one of few in the literature to implement this type of more manual segmentation, though other glaucoma studies have utilized the same prototype OMAG software with similar success,Citation35,Citation38 and Mammo et al used Amira software with speckle variance OCTA to correct automatically produced tracings.Citation36 The prototype OMAG software that we used also incorporated large vessel subtraction, another technique which allowed us to focus our analysis on the small-to-medium vessels. It is thought that large vessels change little with glaucoma progression, and in a recent 2-year prospective study, Holló demonstrated that while none of 44 glaucomatous eyes showed progression with peripapillary vessel density measurements, the removal of large retinal vessels in peripapillary capillary density measures resulted in the detection of progression in 17% of eyes.Citation57 We were able to target vessels even more selectively by using skeletonized vessel maps to reduce vessel width to one pixel, further emphasizing small capillary density in the VSD parameter. Using a similar method with AngioVue software, Geyman et al assessed whole-annulus perfused capillary density (AUC =0.907 for ability to distinguish mild POAG from control), a measure comparable to VSD, and found it to have somewhat higher diagnostic accuracy than the AngioAnalytics vessel density (AUC =0.851), comparable to VAD in this study, though the difference was not significant.Citation49 Although we did not find VSD (AUC =0.855) to be more diagnostically accurate than VAD (0.868), this could be because we used 6×6 mm2 scans, with possibly lower resolution (17 µm/pixel) than the 4.5×4.5 mm2 scans that the Geyman group used, potentially making it difficult to separate overlapping vessels. There is still no consensus as to the optimal image size for OCTA analysis, with peripapillary scan sizes as large as 6.72×6.72 mm2 having been used for glaucoma studies.Citation58 Future studies could compare scan sizes to determine the ideal balance between resolution and sufficient representation of damaged vascular regions.
Interestingly, while VCI demonstrated good diagnostic ability and significant associations with structural and functional measures, we observed that VCI decreased with glaucoma progression, contrary to our expectation that small vessel tortuosity, which VCI is designed to measure, may increase with disease severity. It is possible that VCI was simply detecting greater branching in healthy perfused vasculature, rather than tortuosity changes in diseased vessels; more study is needed to optimize our assessments of tortuous vessels.
This study was limited by a relatively small cohort, which prevented us from being able to further stratify POAG subjects into mild, moderate, and severe groups. In addition, although we found VAD, VSD, and VCI to be reliable correlates of existing functional and structural measures of glaucoma, the cross-sectional nature of this study precludes our ability to make any causal claims about the role of vascular dysfunction in the pathogenesis of POAG. The case–control design of this study also limits the generalizability of our findings to a true clinic population. In addition, multiple tests were performed in this study without multiple testing correction. While this may have led to some false positive results, it also reduces the risk of inflated false negative. Thus, results with borderline significance, such as the global and hemispheric differences in vessel parameters between disease severities and correlations with nasal RNFL thickness, should be interpreted with caution. The association of timolol treatment with moderate-severe glaucoma was significant and, because we still do not understand the effects of glaucoma treatment on peripapillary microcirculation, this cannot be ignored. The pre-OCTA literature suggests that while IOP decreases in glaucoma patients treated with topical timolol, OBF does not increaseCitation59,Citation60 and often declines.Citation61,Citation62 Many studies confirm, however, that treatment with timolol in combination with dorzolamideCitation63,Citation64 or, as was more recently demonstrated, brimonidineCitation64 elevates OBF in addition to lowering IOP. In our study, in all cases but one, timolol treatment was provided in combination with dorzolamide and/or brimonidine, so we do not expect medication use to have caused reduced OBF. While age did not differ significantly between any of the groups in this study, prospective studies would benefit from age matching. Finally, while we did use the FastTrac algorithm to reduce motion artifact, trace amounts of artifact remained in some images.
Conclusion
We demonstrated stepwise differences in global peripapillary perfusion parameters across POAG disease severities with good correlations to functional and structural disease measures. When looking at focal sectors, perfusion in the inferior hemisphere and inferior and superior quadrants were best at distinguishing normal from mild disease, but global parameters tended to be the better perfusion measure for distinguishing mild from moderate-severe POAG. Future studies should evaluate peripapillary perfusion longitudinally in glaucoma patients, study the effects of glaucoma treatments on perfusion measures, and should further explore which stages of disease severity demonstrate the greatest sequential changes in perfusion. This will move us toward a better understanding of the clinical utility of OCTA and its ability to supplement other clinical measures of disease.
Acknowledgments
We wish to thank Anoush Shahidzadeh, MPH for her image acquisition support (USC Roski), and Gary Lee, PhD, Carl Zeiss Meditec for HVF support. This work was supported by the National Institutes of Health (Grant 1K23EY027855-01, GMR; R01EY024158, RKW; K08EY027006, AHK), American Glaucoma Society Mentoring for Advancement of Physician Scientists Grant (GMR), an unrestricted grant to the USC Department of Ophthalmology from Research to Prevent Blindness, and Carl Zeiss Meditec (Dublin, CA; OCTA device).
Disclosure
The authors report no conflicts of interest in this work.
References
- FlammerJMozaffariehMWhat is the present pathogenetic concept of glaucomatous optic neuropathy?Surv Ophthalmol200752Suppl 2S162S17317998042
- WeinrebRNAungTMedeirosFAThe pathophysiology and treatment of glaucoma: a reviewJAMA2014311181901191124825645
- SriramPKlistornerAGrahamSGriggJArvindHOptimizing the detection of preperimetric glaucoma by combining structural and functional testsInvest Ophthalmol Vis Sci201556137794780026650898
- TannaAPBandiJRBudenzDLInterobserver agreement and intraobserver reproducibility of the subjective determination of glaucomatous visual field progressionOphthalmology20111181606520723992
- LeungCKDiagnosing glaucoma progression with optical coherence tomographyCurr Opin Ophthalmol201425210411124370973
- GrewalDSTannaAPDiagnosis of glaucoma and detection of glaucoma progression using spectral domain optical coherence tomographyCurr Opin Ophthalmol201324215016123328662
- AbadiaBFerrerasACalvoPRelationship between spectral-domain optical coherence tomography and standard automated perimetry in healthy and glaucoma patientsBiomed Res Int2014201451494825028657
- WuHde BoerJFChenTCDiagnostic capability of spectral-domain optical coherence tomography for glaucomaAm J Ophthalmol2012153581582622265147
- ChangRTKnightOJFeuerWJBudenzDLSensitivity and specificity of time-domain versus spectral-domain optical coherence tomography in diagnosing early to moderate glaucomaOphthalmology2009116122294229919800694
- MokKHLeeVWSoKFRetinal nerve fiber layer measurement by optical coherence tomography in glaucoma suspects with short-wavelength perimetry abnormalitiesJ Glaucoma2003121454912567111
- El BeltagiTABowdCBodenCRetinal nerve fiber layer thickness measured with optical coherence tomography is related to visual function in glaucomatous eyesOphthalmology2003110112185219114597528
- ScripsemaNKGarciaPMBavierRDOptical coherence tomography angiography analysis of perfused peripapillary capillaries in primary open-angle glaucoma and normal-tension glaucomaInvest Ophthalmol Vis Sci2016579OCT611OCT62027742922
- SuhMHZangwillLMManalastasPIDeep retinal layer microvasculature dropout detected by the optical coherence tomography angiography in glaucomaOphthalmology2016123122509251827769587
- KangEMHongSKimCYSeongGJRelationship between peripapillary retinal nerve fiber layer thickness measured by optical coherence tomography and visual field severity indicesKorean J Ophthalmol201529426326926240511
- NilforushanNNassiriNMoghimiSStructure-function relationships between spectral-domain OCT and standard achromatic perimetryInvest Ophthalmol Vis Sci20125362740274822447869
- WilliamsZYSchumanJSGamellLOptical coherence tomography measurement of nerve fiber layer thickness and the likelihood of a visual field defectAm J Ophthalmol2002134453854612383810
- MikiAIkunoYWeinrebRNMeasurements of the parapapillary atrophy zones in en face optical coherence tomography imagesPLoS One2017124e017534728414805
- SeoSLeeCEJeongJHParkKHKimDMJeoungJWGanglion cell-inner plexiform layer and retinal nerve fiber layer thickness according to myopia and optic disc area: a quantitative and three-dimensional analysisBMC Ophthalmol20171712228283025
- LeungCKMohamedSLeungKSRetinal nerve fiber layer measurements in myopia: An optical coherence tomography studyInvest Ophthalmol Vis Sci200647125171517617122099
- KimMJLeeEJKimTWPeripapillary retinal nerve fibre layer thickness profile in subjects with myopia measured using the Stratus optical coherence tomographyBr J Ophthalmol201094111512019692369
- DoJLSylvesterBShahidzadehAUtility of optical coherence tomography angiography in detecting glaucomatous damage in a uveitic patient with disc congestion: A case reportAm J Ophthalmol Case Rep20178788329260124
- SatilmisMOrgülSDoublerBFlammerJRate of progression of glaucoma correlates with retrobulbar circulation and intraocular pressureAm J Ophthalmol2003135566466912719074
- FlammerJThe vascular concept of glaucomaSurv Ophthalmol199438SupplS3S67940146
- FlammerJOrgülSCostaVPThe impact of ocular blood flow in glaucomaProg Retin Eye Res200221435939312150988
- StalmansIVandewalleEAndersonDRUse of colour Doppler imaging in ocular blood flow researchActa Ophthalmol2011898e609e63021989301
- LeitgebRAWerkmeisterRMBlatterCSchmettererLDoppler optical coherence tomographyProg Retin Eye Res201441264324704352
- PlangeNKaupMWeberAHarrisAArendKORemkyAPerformance of colour Doppler imaging discriminating normal tension glaucoma from healthy eyesEye200923116417017693998
- KoustenisAHarrisAGrossJJanulevicieneIShahASieskyBOptical coherence tomography angiography: an overview of the technology and an assessment of applications for clinical researchBr J Ophthalmol20171011162027707691
- LiuLJiaYTakusagawaHLOptical coherence tomography angiography of the peripapillary retina in glaucomaJAMA Ophthalmol201513391045105226203793
- JiaYWeiEWangXOptical coherence tomography angiography of optic disc perfusion in glaucomaOphthalmology201412171322133224629312
- YarmohammadiAZangwillLMDiniz-FilhoAOptical coherence tomography angiography vessel density in healthy, glaucoma suspect, and glaucoma eyesInvest Opthalmol Vis Sci2016579OCT451OCT459
- YarmohammadiAZangwillLMDiniz-FilhoARelationship between Optical Coherence Tomography Angiography Vessel Density and Severity of Visual Field Loss in GlaucomaOphthalmology2016123122498250827726964
- de CarloTERomanoAWaheedNKDukerJSA review of optical coherence tomography angiography (OCTA)Int J Retina Vitreous20151527847598
- KumarRSAnegondiNChandapuraRSDiscriminant Function of Optical Coherence Tomography Angiography to Determine Disease Severity in GlaucomaInvest Ophthalmol Vis Sci201657146079608827820876
- BojikianKDChenCLWenJCOptic Disc Perfusion in Primary Open Angle and Normal Tension Glaucoma Eyes Using Optical Coherence Tomography-Based MicroangiographyPLoS One2016115e015469127149261
- MammoZHeislerMBalaratnasingamCQuantitative Optical Coherence Tomography Angiography of Radial Peripapillary Capillaries in Glaucoma, Glaucoma Suspect, and Normal EyesAm J Ophthalmol2016170414927470061
- MichaelsonIRetinal Circulation in Man and AnimalsSpringfield, ILCharles C Thomas1954
- ChenCLZhangABojikianKDPeripapillary Retinal Nerve Fiber Layer Vascular Microcirculation in Glaucoma Using Optical Coherence Tomography-Based MicroangiographyInvest Ophthalmol Vis Sci2016579OCT475OCT48527442341
- HodappEParrishRKIIAndersonDRClinical decisions in glaucomaSt LouisThe CV Mosby Co1993
- YinXChaoJRWangRKUser-guided segmentation for volumetric retinal optical coherence tomography imagesJ Biomed Opt201419808602025147962
- ChuZLinJGaoCQuantitative assessment of the retinal microvasculature using optical coherence tomography angiographyJ Biomed Opt2016216066008
- WatsonABPerimetric complexity of binary digital images: notes on calculation and relation to visual complexityMath J2011141
- OngYTde SilvaDACheungCYMicrovascular structure and network in the retina of patients with ischemic strokeStroke20134482121212723715958
- YoungstromEAA primer on receiver operating characteristic analysis and diagnostic efficiency statistics for pediatric psychology: we are ready to ROCJ Pediatr Psychol201439220422123965298
- WangXJiangCKoTCorrelation between optic disc perfusion and glaucomatous severity in patients with open-angle glaucoma: an optical coherence tomography angiography studyGraefes Arch Clin Exp Ophthalmol201525391557156426255817
- RaoHLPradhanZSWeinrebRNRelationship of Optic Nerve Structure and Function to Peripapillary Vessel Density Measurements of Optical Coherence Tomography Angiography in GlaucomaJ Glaucoma201726654855428333896
- TrioloGRabioloAShemonskiNDOptical Coherence Tomography Angiography Macular and Peripapillary Vessel Perfusion Density in Healthy Subjects, Glaucoma Suspects, and Glaucoma PatientsInvest Ophthalmol Vis Sci201758135713572229114838
- ChungJKHwangYHWiJMKimMJungJJGlaucoma Diagnostic Ability of the Optical Coherence Tomography Angiography Vessel Density ParametersCurr Eye Res201742111458146728910159
- GeymanLSGargRASuwanYPeripapillary perfused capillary density in primary open-angle glaucoma across disease stage: an optical coherence tomography angiography studyBr J Ophthalmol201710191261126828148529
- KhoueirZJassimFPoonLYDiagnostic Capability of Peri-papillary Three-dimensional Retinal Nerve Fiber Layer Volume for Glaucoma Using Optical Coherence Tomography Volume ScansAm J Ophthalmol201718218019328807732
- LeungCKChoiNWeinrebRNRetinal nerve fiber layer imaging with spectral-domain optical coherence tomography: pattern of RNFL defects in glaucomaOphthalmology2010117122337234420678802
- ShinJWUhmKBLeeWJKimYJDiagnostic ability of retinal nerve fiber layer maps to detect localized retinal nerve fiber layer defectsEye20132791022103123743523
- FardMASuwanYMoghimiSPattern of peripapillary capillary density loss in ischemic optic neuropathy compared to that in primary open-angle glaucomaPLoS One2018131e018923729320503
- LévêquePMZéboulonPBrasnuEBaudouinCLabbéAOptic Disc Vascularization in Glaucoma: Value of Spectral-Domain Optical Coherence Tomography AngiographyJ Ophthalmol20162016695671726998352
- MeloGBLiberaRDBarbosaASPereiraLMDoiLMMeloLAComparison of optic disk and retinal nerve fiber layer thickness in nonglaucomatous and glaucomatous patients with high myopiaAm J Ophthalmol2006142585886017056370
- ChongGTLeeRKGlaucoma versus red disease: imaging and glaucoma diagnosisCurr Opin Ophthalmol2012232798822262083
- HollóGInfluence of Removing the Large Retinal Vessels-related Effect on Peripapillary Vessel Density Progression Analysis in GlaucomaJ Glaucoma2018278129189544
- Ghasemi FalavarjaniKTianJJAkilHGarciaGASaddaSRSadunAASwept-source optical coherence tomography angiography of the optic disk in optic neuropathyRetina201636Suppl 1S168S17728005675
- MorsmanCDBosemMELuskyMWeinrebRNThe effect of topical beta-adrenoceptor blocking agents on pulsatile ocular blood flowEye19959Pt 33443477556745
- Fuchsjäger-MayrlGWallyBRainerGEffect of dorzolamide and timolol on ocular blood flow in patients with primary open angle glaucoma and ocular hypertensionBr J Ophthalmol200589101293129716170119
- CareniniABSibourGBoles CareniniBCareniniBBDifferences in the longterm effect of timolol and betaxolol on the pulsatile ocular blood flowSurv Ophthalmol199438SupplS118S1247940133
- VetrugnoMCardasciaNCantatoreFSborgiaCComparison of the effects of bimatoprost and timolol on intraocular pressure and pulsa-tile ocular blood flow in patients with primary open-angle glaucoma: A prospective, open-label, randomized, two-arm, parallel-group studyCurr Ther Res Clin Exp200465644445424672097
- SieskyBHarrisABrizendineELiterature review and meta-analysis of topical carbonic anhydrase inhibitors and ocular blood flowSurv Ophthalmol2009541334619171209
- SieskyBHarrisAEhrlichRShort-term effects of brimonidine/timolol and dorzolamide/timolol on ocular perfusion pressure and blood flow in glaucomaAdv Ther2012291536322246943