
 ?Mathematical formulae have been encoded as MathML and are displayed in this HTML version using MathJax in order to improve their display. Uncheck the box to turn MathJax off. This feature requires Javascript. Click on a formula to zoom.
Abstract
Purpose
To compare dry eye (DE) diagnosis patterns by season in Miami vis-a-vis the US and examine differences in DE symptoms and signs by season in Miami.
Patients and methods
US veteran affairs (VA) patient visits with ICD-9 codes for DE (375.15) and routine medical examination (V70.0) from 2010 to 2013 were retrospectively analyzed to evaluate the seasonal pattern of DE diagnosis. A total of 365 patients with normal ocular anatomy were prospectively recruited from the Miami VA eye clinic from 2014 to 2016 for the assessment of symptoms and signs.
Results
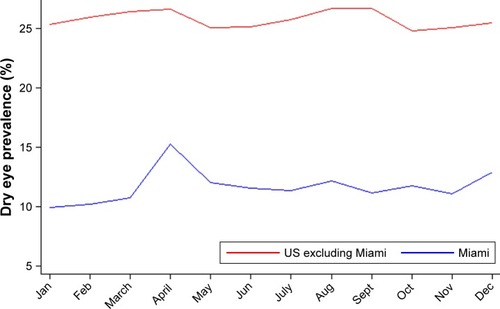
While DE visit prevalence in Miami was about 10% lower than that of the rest of the country (22.5% vs 33.7%), Miami had roughly four times higher variability in DE visit prevalence throughout the year than the US. Peak values for DE symptoms in the Miami cohort aligned with peak DE prevalence seen in the retrospective sample, occurring in spring and fall. A similar, but less dramatic, pattern was noted with DE signs. The seasonal pattern in DE symptoms remained even after controlling for confounders including demographics and medication use.
Conclusion
DE symptoms, and to a lesser degree signs, varied by month, with the highest severity of symptoms occurring in spring and fall, which corresponded with peak allergy season and weather fluctuations, respectively. These findings have important implications for season-specific diagnosis, treatment, and management of DE.
Introduction
Dry eye (DE) is a highly prevalent disease, with one in four patients reporting DE symptoms to their eye care provider.Citation1 Symptoms, including blurry vision and eye pain, negatively impact the patients’ quality of life and affect their ability to perform activities of daily living.Citation2–Citation4 Signs of DE are varied and include decreased tear production, increased tear evaporation, elevated tear osmolarity, and/or ocular surface disruption.Citation4 This situation is further complicated by the report that symptoms and signs of DE often do not correlate.Citation5
Many internal and external factors have been implicated in the onset and persistence of DE, including diet, hormone levels, lifestyle factors, and environmental exposures, particularly meteorological conditions.Citation6 While most of these variables are relatively constant throughout the year, meteorological conditions vary by season. In fact, studies support a seasonal pattern in the prevalence of DE in the USCitation7,Citation8 and other parts of the world.Citation9 Specifically, a nationwide retrospective analysis of US veterans found that the diagnosis of DE had a seasonal pattern, with the maximum prevalence in winter and spring.Citation7 Yet, we still do not fully understand the role of seasonality in specific DE symptoms and signs.
There is biological plausibility that changing meteorological conditions across seasons can both directly and indirectly impact the tear film and ocular surface. For example, high temperature and low humidity increased intracellular stress in an in vitro model,Citation10 and thus may impact corneal epithelial cells. These conditions also increase the rate of desiccating tear film evaporation and aqueous loss,Citation11,Citation33 ultimately negatively impacting the ocular surface. The changing meteorological conditions can indirectly modify the exposure of the eye to air pollutants and allergens. For example, heat, humidity, wind, and atmospheric pressure alter the concentration, type, and composition of air pollutants by atmospheric physical and chemical processes.Citation12,Citation13 High wind velocity facilitates the dispersion of outdoor particles and reduces their concentration, and high temperature and solar radiation enhance photochemical reactions, resulting in high concentration of surface ozone. Moreover, high relative precipitation and temperature facilitate the production of bioaerosols including pollens and mold spores that have been linked to ocular surface inflammation and DE.Citation7,Citation14
As the impact of meteorological conditions on DE has not been fully elucidated, in the present study we used seasonality as a proxy for meteorological conditions and examined its role in DE. We did so by first comparing DE prevalence in Miami versus that in the US and then focusing on sepcific DE symptoms and signs in a well-defined Miami-based population. The knowledge gained from this research can provide insight into the effect of changing meteorological conditions across seasons on DE and help to develop a better understanding of the differential role of environmental exposures across seasons in DE pathogenesis.
Materials and methods
This research relied on two different data sets: 1) national retrospective data from all US veteran affairs (VA) facilities and 2) Miami VA cohort.
US VA retrospective data
We used the national VA database to extract all visits to any VA facility within the continental US between 2010 and 2013. ICD-9 diagnosis codes were then examined, and individuals with a code for DE (375.15) were identified. This DE code encompasses various DE subtypes (evaporative, aqueous deficiency, symptoms only). As the total population at risk, ie, all veterans covered by a VA facility, was unknown, we used routine medical visit code (V70.0) to compute a standardized rate of DE prevalence, ie, the ratio of DE diagnosis to DE diagnosis plus routine medical visits (V70.0).
Miami DE cohort
South Florida residents with normal eyelid and corneal anatomy were recruited from the Miami VA Healthcare eye clinic between January 2014 and December 2016. Inclusion was limited to patients who did not plan to spend significant time away from home before or during the data collection period. Patients were excluded from participation if they had ocular or systemic conditions that could confound DE, including contact lens wear, a history of refractive surgery, use of ocular medications with the exception of artificial tears, an active external ocular process, cataract surgery in the last 6 months, or a history of glaucoma or retinal surgery.Citation15 Furthermore, individuals with a diagnosis of HIV, sarcoidosis, Sjögren’s syndrome, graft-versus-host disease, or collagen vascular disease were excluded. All patients examined in the eye clinic who met the inclusion and exclusion criteria were offered participation in the study. Interested patients were scheduled for a study visit in which written informed consent was obtained and DE parameters were measured. The study was approved by the Miami VA Institution Review Board (IRB approval #3011.02). The study was conducted in accordance with the principles of the Declaration of Helsinki and complied with the requirements of the United States Health Insurance Portability and Accountability Act.
Measures
Questionnaires: For each individual, demographic information (age, sex, race, and ethnicity), past ocular and medical history, and medication information was collected. Patients filled standardized questionnaires regarding DE symptoms, including the dry eye questionnaire 5 (DEQ5)Citation16 and the ocular surface disease index (OSDI).Citation17 The Neuropathic Pain Symptom Inventory (NPSI), modified for the eye (NPSI-E),Citation18 was used to quantify the severity of clinically relevant dimensions of neuropathic pain. To modify the NPSI so that it was relevant to neuropathic ocular pain (NOP), we replaced three of the original questions regarding the severity of allodynia or hyperalgesia with questions specific to ocular allodynia or hyperalgesia (eye pain caused or increased by [1] wind, [2] light, and [3] heat or cold), as previously described in the literature.Citation19
Ocular surface evaluation: All patients underwent a standardized ocular surface examination by an investigator masked to the questionnaire data, which included measurement of 1) tear osmolarity (TearLab Osmolarity System, TearLab, San Diego, CA, USA) (once in each eye); 2) tear evaporation measured as tear breakup time (TBUT) (5 µL fluorescein instilled in the superior conjunctiva, time measured in seconds until the first black spot appeared in the tear film, 3 measurements taken with 5-second blink interval between measurements and averaged); 3) corneal epithelial cell disruption measured by corneal staining (National Eye Institute [NEI] scale, 5 areas of the cornea assessed; score 0–3 in each area, total score: 15); and 4) Schrimer score with anesthesia measured as millimeter of wetting at 5 minutes. For each individual, data from the more severely affected eye (lower value for TBUT and Schirmer, higher value for staining and osmolarity) were used in the analyses.
Statistical analyses
For the retrospective analysis, DE visit prevalence (computed as the ratio of DE diagnosis to routine medical examination visit plus DE diagnosis) was estimated. Descriptive statistics of DE prevalence were then computed and plotted by months. A coefficient of variance was calculated (SD/mean DE visit prevalence) to examine relative variability across months in Miami and the rest of the US.
For the prospective analysis, seasonal distribution and descriptive statistics for patient’s demographics, comorbidities, medication use, and mental health were calculated and compared by ANOVA, chi-square test, or Fisher’s exact tests, as appropriate. Differences in DE symptoms and signs by month and season were examined using descriptive statistics. All DE symptoms and signs were modeled using multilevel mixed-effects linear regression (STATA function xtmixed).Citation20 Because some patients were examined twice, patient was used as a panel variable, and the error term was adjusted for patient-specific random effect. Because month number was coded as a linear distribution (coded as 1 = January, 2 = February, …, 12 = December), this could not be used to represent cyclic seasonal pattern of DE prevalence; therefore, the month number was cos transformed with the maximum values corresponding to spring and fall and minimal values corresponding to summer and winter, which coincided with cyclic distribution of DE prevalence in Miami. The model also included selected demographics and comorbidities that were significantly different across seasons (Supplementry material). All analyses were conducted in R (Version 3.3)Citation21 and Stata (Version 14).Citation20
Results
DE visit prevalence in Miami and US veteran populations
There were 6,198 visits with a DE diagnosis in Miami compared to 993,998 visits with a DE diagnosis in the US. Similarly, there were 21,405 wellness (or routine) visits in Miami compared to 1,952,141 visits in the US. The DE visit prevalence in Miami with respect to the routine examination visit was 22.5%, which was about 10% lower than that of the rest of the country (33.7%).
Monthly DE diagnosis prevalence in a Miami veteran population
shows the monthly distribution of DE visit prevalence in Miami and the rest of the US. While Miami exhibited a strong seasonal pattern with elevated DE visit prevalence in spring, the rest of the country exhibited less of a seasonal pattern, with less prominent bimodal peaks in spring and early fall. Table S1 lists DE visit prevalence by month for the US and Miami. April (25.9%), May (25.2%), and December (24.3%) showed the highest prevalence in Miami, and April was also high for the US as a whole (34.6%). The other monthly maxima for the US were March (34.5%), August (34.7%), and September (34.6%). Prevalence peaked in the spring for both locations, and secondary peaks occurred in early fall for the US, but not until winter in Miami. The lowest prevalence occurred in February in Miami and in October in the US. These minima occurred within two months of a peak for both the US and Miami. A comparison of the coefficient of variances between the two groups highlighted that Miami had roughly four times higher monthly variability in DE visit prevalence than the US (8.4/2.2=3.81).
Figure 1 Dry eye prevalence in US and Miami by months, 2010–2013.
Miami veteran study population
Between 2014 and 2016, 365 individuals were evaluated in the Miami VA eye clinic, of which 333 individuals were examined once and 32 individuals were examined twice (total number of visits =397). The mean age of the population was 61.8 years, 336 (92%) were male, and 182 (50%) self-identified as white and 100 (27.4%) as Hispanic (Table S2). For this table, demographics and comorbidity data for the 32 individuals with multiple visits were recorded only once, during their first visit. The frequency of a few variables differed by season, including race, use of anxiolytic, and antihistamine use.
DE symptoms in a Miami veteran population
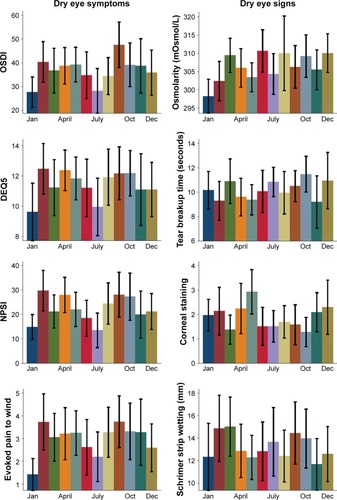
Peak DE symptom severity occurred in spring and fall (; ), corresponding to the peak DE prevalence measured in the retrospective national sample. Conversely, symptom questionnaire score means were lowest in January and July. Specifically, the mean OSDI scores were highest in September. The mean OSDI scores were in the severe range (>33)Citation17 in every month except January and July, with the most severe scores (>40)Citation22 occurring in spring and fall. DEQ5 scores peaked in February, followed by April and October. These were the only months where the aggregate mean DEQ5 score was in the severe range (>12).Citation16 NPSI-E scores also peaked in February, with the other maximum values again occurring in spring and fall. visually demonstrates the bimodal distribution of DE symptoms.
Table 1 DE symptom questionnaire scores by month from 2014 to 2016, including multiple visits
Figure 2 Monthly distribution of the selected DE symptoms and signs among Miami veterans, 2014–2016.
DE signs in a Miami veteran population
Summary statistics for DE signs were computed by month (; ). Corneal staining demonstrated the most variation by month, followed by Schirmer score and TBUT. Staining for corneal epithelial disruption was the most pronounced in spring, with peak values occurring in May. Interestingly, Schirmer scores were highest in March, corresponding with the time period of more severe symptoms. However, for Schirmer scores and TBUT, all mean levels were near or above the normal range (>10 mm wetting after 5 minutes and >10 seconds, respectively). By comparing coefficients of variances, we noted that DE symptoms exhibited stronger monthly variability than DE signs.
Table 2 DE tear film parameters by month from 2014 to 2016, including multiple visits
Monthly variation in DE symptoms and signs when adjusting for potential confounders
Regression analyses further substantiates these findings. When adjusting for demographics and co-morbidities that varied by season (Table S2), DE symptoms, but not signs, varied significantly by month (). This result was of marginal significance for OSDI, DEQ5, and NPSI-E (P<0.1) and significant for evoked pain to wind (P<0.05). For example, OSDI scores were 3.25 points higher in spring and fall (compared to those in winter and summer, respectively). Similarly, the intensity of evoked pain to wind was 0.49 higher in spring and fall (compared to those in winter and summer, respectively). The result of our multivariable analysis is also consistent with previously noted relationships in DE. For example, older age was associated with more abnormal DE signs (staining, production, evaporation) and the use of antidepressants and anxiolytics was associated with higher DE symptoms.
Table 3 Multivariable linear regression analysis considering the role of season on DE symptoms and signs while considering contribution of demographics and other comorbidities
Discussion
This research shows bimodal peaks for both DE diagnosis and DE symptoms in Miami and a weaker bimodal peak for a DE diagnosis in the US. The spring peak in Miami was stronger and lasted for a longer duration than that in the US. DE signs, on the other hand, when adjusted for comorbidities, did not exhibit a strong seasonal pattern. The main findings of this research are consistent with the results of previous epidemiological studiesCitation7–Citation9 and provide unique insights into varying DE symptoms and signs across seasons. Analysis of Google queries across multiple continents found that searches for “dry eye” were significantly more common during summer, while searches for “itchy eyes” and “conjunctivitis” also varied by season.Citation23 Tear film composition has also been reported to change with season by increased expression of hexanoyllysine, a biomarker of lipid peroxidation that indicates ocular surface oxidative damage, in springtime.Citation24
The noted bimodal distribution of DE found in our study and other studies may be explained by both direct and indirect contributions of changing weather across seasons. Seasonal variations in ambient temperature, humidity, pressure, and air current may directly aggravate DE by impeding lacrimal and meibomian gland function. For example, increased wind velocity directly enhances aqueous evaporation and eye irritation,Citation11 while rising temperature has been shown to alter tear film stability by influencing lipid secretion and lipid layer functionality.Citation25 The change in temperature between seasons probably has more influence on DE than the absolute temperature during the season. This notion is supported by the observation that the greatest decrease in DE intensity occurred in winter and summer when the weather change from the previous season was less abrupt, allowing more time for the lacrimal functional unit to acclimate.
Weather conditions during springtime indirectly facilitate the production of bioaerosols such as pollen.Citation7 Furthermore, wind speeds peak in spring,Citation26 which facilitates dispersion of pollen. Individuals with seasonal allergic conjunctivitis have been shown to have higher DE symptoms than age- and gender-matched controls without allergies.Citation27 Pollen can also affect the ocular surface as was shown with decreased conjunctival cell viability on exposure to pollen extract.Citation28 Pollutants can also impact the tear film, and their concentrations can also vary by season.Citation29,Citation30 For example, ozone concentrations typically peak in summer and have been associated with DE symptoms in a large population-based study.Citation31 The findings of this research must be considered in light of its limitations, which include a specific patient population, geographic location, and a cross-sectional design. The retrospective component relied on ICD diagnoses and a prevalence estimate based on a comparison to routine examination visits, whose frequency may have varied by location. Future studies are thus needed to replicate our findings in other populations and climates and to assess subclinical metrics of DE (inflammation) and specific environmental indicators (bioaerosols, air pollutants, and gases) by month and season.
Conclusion
Our findings have important implications for improving the understanding of DE pathophysiology and for developing prevention and management strategies. Identifying seasonal mechanisms allows for targeted environmental manipulations that are more cost effective and generate fewer adverse and/or side effects than current DE therapies. For example, wrap-around sunglasses may limit exposure to allergens or pollutants outdoors, particularly when needed in the spring. The use of high-quality air filters or humidifiers could improve DE manifestations when indoors, specifically during winter months. Elucidating the direct and indirect effects of seasonality on DE is especially relevant because we are likely to witness increased mean annual temperatures and weather extremes due to climate change that may intensify DE severity in patients worldwide.Citation32
Acknowledgments
The authors note that the contents of this study do not represent the views of the Department of Veterans Affairs or the United States Government. This work in part was supported by the Department of Veterans Affairs, Veterans Health Administration, Office of Research and Development, Clinical Sciences Research EPID-006–15S (Dr Galor), R01EY026174 (Drs Kumar and Galor), NIH Center Core Grant P30EY014801, and Research to Prevent Blindness Unrestricted Grant.
Supplementary materials
Table S1 Monthly DE visit prevalence (%) in the US and Miami, 2010–2013
Table S2 Descriptive statistics of Miami VA Cohort recruited from 2014 to 2016 by season
Disclosure
The authors report no conflicts of interest in this work. The authors have no financial relationships to disclose. The authors have no proprietary or commercial interest in any materials discussed in this article.
References
- O’BrienPDCollumLMDry eye: diagnosis and current treatment strategiesCurr Allergy Asthma Rep20044431431915175147
- FriedmanNJImpact of dry eye disease and treatment on quality of lifeCurr Opin Ophthalmol201021431031620467319
- PouyehBViteriEFeuerWImpact of ocular surface symptoms on quality of life in a United States veterans affairs populationAm J Ophthalmol2012153610611066.e322330309
- CraigJPNicholsKKAkpekEKTFOS DEWS II Definition and Classification ReportOcul Surf201715327628328736335
- GalorAFelixERFeuerWDry eye symptoms align more closely to non-ocular conditions than to tear film parametersBr J Ophthalmol20159981126112925710726
- StapletonFAlvesMBunyaVYTFOS DEWS II Epidemiology ReportOcul Surf201715333436528736337
- KumarNFeuerWLanzaNLGalorASeasonal Variation in Dry EyeOphthalmology201512281727172925912217
- MossSEKleinRKleinBEPrevalence of and risk factors for dry eye syndromeArch Ophthalmol200011891264126810980773
- van SettenGLabetoulleMBaudouinCRolandoMEvidence of seasonality and effects of psychrometry in dry eye diseaseActa Ophthalmol201694549950627105776
- MeloniMDe ServiBMarascoDDel PreteSMolecular mechanism of ocular surface damage: application to an in vitro dry eye model on human corneal epitheliumMol Vis20111711312621245952
- AbusharhaAAPearceEIThe effect of low humidity on the human tear filmCornea201332442943423023409
- VanosJKCakmakSBristowCSynoptic weather typing applied to air pollution mortality among the elderly in 10 Canadian citiesEnviron Res2013126667524012249
- KumarNA comparison of indoor and outdoor air quality and meteorological conditions in Iowa City, IABuild Environ2015
- AyakiMKawashimaMUchinoMTsubotaRNegishiKPossible association between subtypes of dry eye disease and seasonal variationClin Ophthalmol2017111769177529033539
- GomesJAPAzarDTBaudouinCTFOS DEWS II iatrogenic reportOcul Surf201715351153828736341
- ChalmersRLBegleyCGCafferyBValidation of the 5-Item Dry Eye Questionnaire (DEQ-5): Discrimination across self-assessed severity and aqueous tear deficient dry eye diagnosesCont Lens Anterior Eye2010332556020093066
- SchiffmanRMChristiansonMDJacobsenGHirschJDReisBLReliability and validity of the Ocular Surface Disease IndexArch Ophthalmol2000118561562110815152
- KalangaraJPGalorALevittRCCharacteristics of Ocular Pain Complaints in Patients With Idiopathic Dry Eye SymptomsEye Contact Lens201743319219826925537
- GalorAMoeinHRLeeCNeuropathic pain and dry eyeOcul Surf2018161314429031645
- STATA/MP – Data Analysis and Statistical Software [computer program]TX: College StationStata Corp LP2015
- R Development Core Team. RA language and environment for statistical computing2012 Available from: http://www.R-project.orgAccessed November 9, 2018
- MillerKLWaltJGMinkDRMinimal clinically important difference for the ocular surface disease indexArch Ophthalmol201012819410120065224
- LefflerCTDavenportBChanDFrequency and seasonal variation of ophthalmology-related internet searchesCan J Ophthalmol201045327427920436544
- HaworthKMChandlerHLOxidative Stress Measures of Lipid and DNA Damage in Human TearsInvest Ophthalmol Vis Sci2017586BIO151BIO15728662237
- LeiskeDLeiskeCLeiskeDTemperature-induced transitions in the structure and interfacial rheology of human meibumBiophys J2012102236937622339874
- Average Wind Speed – FloridaFlorida Climate Center, Office of the State Climatologist Available from: https://climatecenter.fsu.edu/products-services/data/other-normals/average-wind-speedAccessed November 28, 2017
- ChenLPiLFangJChenXKeNLiuQHigh incidence of dry eye in young children with allergic conjunctivitis in Southwest ChinaActa Ophthalmol2016948e727e73027226346
- RabensteinerDFSpreitzhoferETrummerGPollen enzymes degrade human tear fluid and conjunctival cells: an approach to understanding seasonal non-allergic conjunctivitisDev Ophthalmol201045839220502029
- NovaesPSaldivaPHMatsudaMThe effects of chronic exposure to traffic derived air pollution on the ocular surfaceEnviron Res2010110437237420338555
- WangFGuoZLinTRoseNLSeasonal variation of carbonaceous pollutants in PM2.5 at an urban ‘supersite’ in Shanghai, ChinaChemosphere201614623824426735723
- HwangSHChoiYHPaikHJWeeWRKimMKKimDHPotential Importance of Ozone in the Association Between Outdoor Air Pollution and Dry Eye Disease in South KoreaJAMA Ophthalmol2016503
- WattsNAdgerWNAgnolucciPHealth and climate change: policy responses to protect public healthLancet2015386100061861191426111439
- AbusharhaAAPearceEIFagehiREffect of ambient temperature on the human tear filmEye Contact Lens201642530831226595213