Abstract
Purpose:
Assessment of capillary abnormalities facilitates early diagnosis, treatment, and follow-up of common retinal pathologies. Injected contrast agents like fluorescein are widely used to image retinal capillaries, but this highly effective procedure has a few disadvantages, such as untoward side effects, inconvenience of injection, and brevity of the time window for clear visualization. The retinal function imager (RFI) is a tool for monitoring retinal functions, such as blood velocity and oximetry, based on intrinsic signals. Here we describe the clinical use of hemoglobin in red blood cells (RBCs) as an intrinsic motion-contrast agent in the generation of detailed noninvasive capillary-perfusion maps (nCPMs).
Patients and methods:
Multiple series of nCPM images were acquired from 130 patients with diabetic retinopathy, vein occlusion, central serous retinopathy, age-related macular degeneration, or metabolic syndrome, as well as from 37 healthy subjects. After registration, pixel value distribution parameters were analyzed to locate RBC motion.
Results:
The RFI yielded nCPMs demonstrating microvascular morphology including capillaries in exquisite detail. Maps from the same subject were highly reproducible in repeated measurements, in as much detail and often better than that revealed by the very best fluorescein angiography. In patients, neovascularization and capillary nonperfusion areas were clearly observed. Foveal avascular zones (FAZ) were sharply delineated and were larger in patients with diabetic retinopathy than in controls (FAZ diameter: 641.5 ± 82.3 versus 463.7 ± 105 μm; P < 0.001). Also visible were abnormal vascular patterns, such as shunts and vascular loops.
Conclusion:
Optical imaging of retinal capillaries in human patients based on motion contrast is noninvasive, comfortable, safe, and can be repeated as often as required for early diagnosis, treatment guidance, and follow up of retinal disease progression.
Introduction
Capillary network function and morphology are affected by many common pathological processes. Assessment of capillary abnormality is desirable for early diagnosis, but many of the widely utilized imaging methods require administration of contrast agents, while others have not been approved for clinical use.Citation1,Citation2 Brain studies have shown that it is possible to image the fluctuations in intrinsic reflectance that result from changes in hemoglobin volume and oxygenation state.Citation3 Other studies have successfully imaged the motion of red blood cells (RBCs) in cortical capillaries.Citation4 Our group previously described a method that employs hemoglobin-based intrinsic–motion contrast to trace the retinal microvasculature.Citation5,Citation6 Over the years, that methodology has been significantly improved so that capillaries can now be visualized in a clinical setting in exquisite detail.
Optical imaging techniques use visible, ultraviolet, and infrared wavelengths to probe an imaged tissue target for its optical properties, which include fluorescence, absorption, and scattering. Small changes in reflectance due to intrinsic optical properties of the blood have been used to explore hemodynamic activity.Citation3,Citation7 By capturing reflectance changes as a function of time under stroboscopic illumination, our group developed the retinal function imager (RFI) (Optical Imaging Ltd, Rehovot, Israel). This instrument incorporates a noninvasive method of imaging and mapping the capillaries using the intrinsic contrast chromophore, hemoglobin. Fast acquisition of images at a wavelength strongly absorbed by hemoglobin enables the motion of RBCs to be detected, and by tracing the paths of this perfusing motion, the capillaries can be visualized as previously described in detail.Citation5,Citation6 We chose to implement this approach using better realignment and analysis software for visualizing the retinal capillary network in more detail and accuracy than in the past.
Previous studies have employed different technologies to display the retinal functional vasculature using various methods. Scanning laser video-fluorescein angiography enhances the visualization of capillary network with contrast agent injection and provides superb images in normal subjects and in diabetic patients exploring macular microcirculation in cystoid maculopathy.Citation8–Citation10 The addition of adaptive optics to scanning laser ophthalmoscopy improves the image resolution and allows detection of small capillaries through tracking of leukocyte movement.Citation11,Citation12 Ferguson et al employed a tracking system to obtain stabilized Doppler flowmetry images that demonstrate vascular perfusion.Citation13 Fourier-domain optical coherence tomography (OCT) technology with phase variance–based motion contrast enables visualization of fine vasculature.Citation14,Citation15 Our aim here was to describe a simple method for imaging of retinal pathologies using xenon-lamp stroboscopic lighting. Imaging of the retinal vasculature is important for early diagnosis, targeted treatment, and follow-up of ocular diseases, while the unique optical properties of the eye make the ocular fundus eminently accessible to direct, noninvasive optical monitoring of the vascular flow.Citation16,Citation17
Ocular neovascularization is the major cause of blindness in a wide range of ocular diseases, such as diabetic retinopathy (DR), branch retinal vein occlusion (BRVO), and age-related macular degeneration (AMD).Citation18,Citation19 In DR, other patterns of vascular abnormalities like venous loops and shunts were found.Citation20–Citation22 Defining nonperfused retinal areas is important in assessing vascular retinal pathologies, as the absence of blood supply is responsible for vision loss and neovascularization formation.Citation18 Since its first use as a diagnostic aid in the 1960s,Citation16 fluorescein angiography (FA) has become an invaluable tool for studying, understanding, documenting, and treating ocular disease.Citation16,Citation23,Citation24 However, up to 20% of patients have an adverse response to injection of fluorescein, ranging from mild effects like nausea, pruritus, and sneezing,Citation16,Citation23,Citation25 to severe reactions including death (1 in 220,000). Therefore, a clinically applicable, noninvasive alternative for visualizing capillary abnormality or capillary dropout is potentially a valuable aid to diagnosis.Citation16,Citation23–Citation25 Detection of leaks is not possible with the technique as presented but is with the use of a contrast agent, as discussed later. Here we show that retinal vascular pathologies can be detected by the use of intrinsic motion contrast to create noninvasive capillary-perfusion maps (nCPMs).
Material and methods
Subjects
Participating in the study were 37 healthy subjects (42 eyes) and 130 patients (149 eyes) with a diverse array of common retinal pathologies including BRVO, DR, AMD, and central serous retinopathy (CSR). Subjects were enrolled in the healthy group if they had no signs of ophthalmic pathology and had a best corrected visual acuity of at least 20/40. Patients were recruited to the various pathology groups if they had signs of the specific disease and no signs of any other ophthalmic pathology. Insufficient light reaching the retina results in poor signal to noise ratio and inadequate focus. Thus, exclusion criteria for both groups were lack of clear visualization of the retina because of media opacity, a poorly dilating pupil or operator-dependent image-focusing insufficiency. Refractive error greater than ±6 diopters (spherical equivalent) may also interfere with focusing; therefore, such patients were excluded.
After excluding images of inadequate quality, we were able to produce 37 nCPMs of 37 healthy subjects (average age 34.8 ± 10.1 years) and 84 nCPMs of 68 patients (average age 60.7 ± 14.7 years). Images of inadequate quality were due to operator inexperience with fundus photography and irregular retinal face in case of severe macular edema, problems in patient focusing, and cooperation due to poor vision. Of the eyes with pathologies, 9 were of 9 patients with BRVO (average age 65.3 ± 8.9), 58 were of 47 patients with diabetes (average age 60.3 ± 11.5); 38 had nonproliferative DR (NPDR), 20 had proliferative DR (PDR), 13 were of 10 patients with AMD (average age 70.7 ± 14.5), and 4 were of 2 patients with CSR (average age 42.2 ± 7.2).
Patients were recruited from the ophthalmic clinic at Sourasky Medical Center, Tel-Aviv, Israel, and the Edith Wolfson Medical Center, Holon, Israel. The study was approved by the Institutional Review Board/Ethics Committee of both medical centers and adhered to the regulations of the Declaration of Helsinki and Health Insurance Portability and Accountability Act. Informed consent was obtained from all participants prior to study inclusion.
Visual acuity was recorded. Pupils were dilated with 1% tropicamide and 2.5% phenylephrine. Each participant was scanned for retinal function by the RFI, which yielded several sets of images with a diagonal field of view of 20 degrees centered on the fovea or the optic disc or the periphery. nCPM can be obtained also at 35 degrees (Supplementary Figure S1). At this magnification, small capillaries are not as sharp because of the present camera resolution, yet pathology can be seen.
Within 1 month of RFI scanning, each participant underwent FA imaging according to a standard FA protocol using a Heidelberg Retina Angiograph (HRA classic) (Heidelberg Engineering, Heidelberg, Germany) or a Zeiss Fundus Camera (FF450 Plus) (Carl Zeiss Meditec, Jena, Germany). When evaluating a new imaging method, it is beneficial to use more than one instrument for reference. Some of our nCPM images were also compared with OCT images acquired by Stratus OCT (Carl Zeiss Meditec, Jena, Germany) or by Spectralis OCT (Heidelberg Engineering, Heidelberg, Germany). OCT was performed to demonstrate characteristics (such as edema or scarring) of a specific pathology, not for direct comparison with the nCPM images; thus, the use of the two different models did not affect the study findings.
Acquisition of retinal images and image processing of noninvasive capillary-perfusion maps
Data acquisition
Retinal images were acquired by the RFI using fundus illumination at green (“red-free”; 548 band-pass, 8.5 nm) wavelengths, at which RBCs are strongly absorbing. Using fast stroboscopic lighting and a CCD (charge coupled device) camera with an exposure time of 700 μs, at a resolution of 1024 × 1024 pixels, we obtained 8 images in 122.5 milliseconds. The radiance level of the RFI, when operated at maximum intensity, is HVIR-R 2.920 mJ/cm2 per flash; the current protocol of repeating flashes complies with the international standard ISO 15004-2. For each retinal region of interest we acquired between four and ten such series.
Image processing
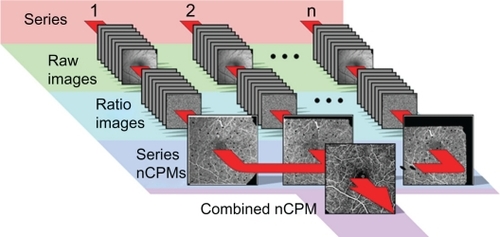
After image registration (), we created ratio images or “differential images” by dividing each single retinal image by the average of the entire series to extract the motion signal from the stationary retinal background. Division of images normalizes for differences in reflected light levels across the retinal images. These ratio images were used to search for the motion path of RBCs, or in other words, to visualize the microvasculature. Such single-series nCPM images disclosed intracapillary erythrocyte paths. Multiple single-series nCPM images were combined to produce an enhanced capillary-perfusion map of 2–10 inter-series nCPM images for the whole session (). Data acquisition took between 1 and 10 minutes.
Figure 1 Procedure for obtaining nCPMs. Using fast stroboscopic lighting and a CCD camera, eight images were obtained per series in 122.5 ms, at 17.5 ms intervals (exposure time, 700 μs). Usually, several series were acquired for each retinal region of interest. Top row shows 1–2 … n of subsequent series of raw images acquired under green illumination (548 nm with a band-pass of 8.5 nm), a strongly absorbing range for red blood cells. Images were corrected for illumination differences (normalized to the same average, and with low spatial frequencies removed) and aligned to one image to compensate for small eye movements, reaching a subpixel alignment resolution by interpolation. The second row shows differential (ratio) images created per image series to eliminate retina pattern. Image dust artifacts were detected and masked. These differential images were used to create one nCPM image for each series in an overlapping set of series, as shown in the third row. The small black spots are the masked dust artifacts that were emphasized here by black masks rather than gray. These were further combined into a single capillary-perfusion map.
Single-series nCPM processing starts automatically after eight images are grabbed, and takes about 15 seconds per series. Combining the single-series nCPMs, using an Intel quad-core 3.0GHz system, takes 15–20 seconds (for seven series).
To compensate for eye movements, we aligned images to a single image using an alignment algorithm derived from the Dual-Bootstrap Iterative Closest PointCitation26 (DualAlign™ LLC, Clifton Park, NY) that iteratively searches for matching intersection landmarks to create a one-to-one, 12-parameter quadratic function from each image to a single reference image. Subpixel alignment was provided by warping each pixel to the coordinate system of the reference image using an accurate interpolation kernel.
Artifacts due to specular reflection from the retina, the intensity of which is locally sensitive to motion, were reduced by extracting only the informative modes of change. In addition, an occasional small central fovea artifact due to the reflection of light scattered from the anterior segment was masked when it occurred.
Two-step sequential processing was required to adjust inhomogeneous illumination and eliminate retina pattern (the constant features of the image). First, low spatial frequencies were attenuated by using a high-pass filter with a Nyquist cutoff frequency of 0.2 (23.47 lines/mm). Next, the fixed retina pattern was eliminated by dividing each image by the average over the entire series. This set of differential images (“ratio images”) was created for each series.
Motion detection
A single-series nCPM signal was the estimated standard deviation (SD) per pixel above the estimated shot noise per pixel, during the time the eight ratio images were acquired. Since this signal is largely due to the motion of RBCs along blood vessels, it detects the capillaries and other elements of the microcirculation. In the best cases, such images provided a very good capillary-perfusion map (Supplementary Figure S2).
Next, we normalized each single-series nCPM by using an adaptive histogram equalization algorithm. This is applied by estimating contrast enhancement look-up tables at nine different square regions of the image and interpolating between them. This method yields a better local contrast than that obtained by global histogram equalization, while avoiding fine-scale signal attenuation.
Elimination of “dust artifacts”
Owing to the image alignment that corrects for eye movement, dust particles in image planes of the RFI optics seemed to be moving on the retinal images, and were particularly visible on the high-gain ratio-images which are used for calculating the final nCPM. The algorithm detected them and masked them out (small gray mask) by noting correlations in images taken of otherwise uncorrelated scenes (eg, displaced retina due to motion). After identifying where the dust particles were in a given series nCPM, it was possible to nearly eliminate them from the final, combined nCPM image, since in each series nCPM the small gray mask was on a different retinal region.
Obtaining the final nCPM
Multiple single-series nCPMs were combined into a single image (combined nCPM) by averaging over nondust pixels. The resulting image was stretched to the full dynamic range such that 1% of pixels were saturated. The nCPM images acquired at 20 degrees result in 4.27 micron/pixel resolution. Usually five well-focused series of the same region of interest are enough to create a detailed nCPM, depending on the operator-dependent focusing ability and on the anatomy and pathology of the retina. Supplementary Figure S3 is a movie that shows the steps from normalized registered raw images, through ratio images, to an nCPM map.
Foveal avascular zone measurement and statistical analysis
The area and diameter of the foveal avascular zone (FAZ) were measured using ImageJ 1.42q (National Institutes of Health, Bethesda, MD). FAZ diameter was measured along the maximum caliper, which is the longest distance between any two points along the FAZ boundaries. The results of FAZ measurements are expressed as means ± SD. For the purpose of FAZ calculation and comparison, we arbitrarily chose one eye of each subject. Differences were calculated using Student’s t-test. Correlation with visual acuity was performed using Pearson’s correlation. Significance was set at P < 0.05.
Results
Healthy control subjects
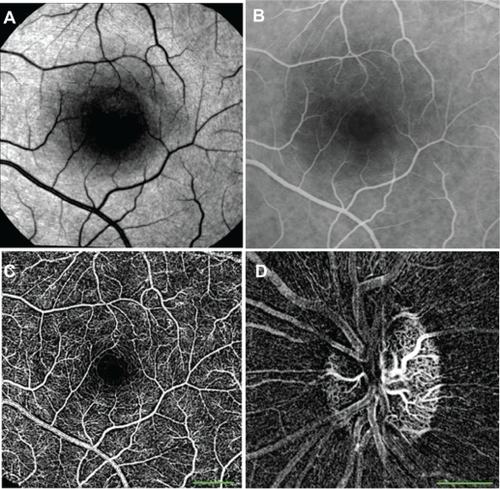
We assessed the ability of the RFI to image the retina in the healthy volunteers. For each volunteer, 4–10 series were acquired over a period of 2–10 minutes. The resulting combined nCPMs displayed a detailed capillary network map of the retina, as shown in , which was acquired from a 31-year-old healthy male (average of five series). The image clearly shows the details and high resolution achieved by the nCPM (). The nCPMs were found to be highly reproducible at the level of a single capillary (Supplementary Figure S4), as well as over different time points during a follow-up period of 180 days (Supplementary Figure S5). Whereas the example shown in depicts the average of five series, in the best cases even a single image series may be enough (Supplementary Figure S2). Capillaries were also clearly detectable in nCPMs obtained at the periphery (Supplementary Figure S6).
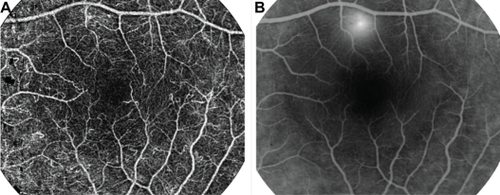
Figure 2 nCPMs provide detailed images of capillaries. (A) Red free image. (B) FA image from mid-phase obtained by fundus camera. (C) This nCPM was created by combining five series of aligned differential images (details in Materials and methods). Acquisition of this image took under 3 minutes. Borders of the foveal avascular zones are clearly delineated. Note that FA images from an earlier phase can show capillaries in greater detail than that shown here and in all other images. The ability to see details depends on acquisition timing, focus, and optical quality of a given eye. (D) Optic nerve head nCPM image from a 24-year-old healthy female. Specular reflections are strongly dependent on the angle of illumination. Especially in young subjects, this may produce “nerve fiber artifacts” due to small eye motions and an imperfect alignment. Such artifacts appear in this image but not in A.
Abbreviations: FA, fluorescein angiography; nCPM, noninvasive capillary-perfusion map.
Imaging capillaries in the optic nerve head
Using standard FA, capillaries in the optic nerve head can be visualized only at the very early stage because they originate from ciliary arteries, which allow leakage of fluorescein molecules. displays an nCPM image of the optic nerve head of a 24-year-old healthy female. Capillaries of the optic nerve head can be seen in clear detail.
Measurements of the foveal avascular zone
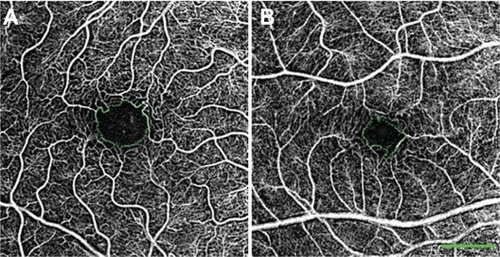
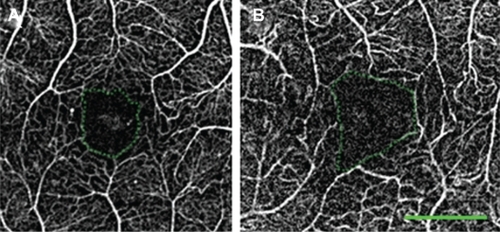
The fine details revealed in the nCPM images clearly distinguish the borders of the FAZ under physiological conditions ( and ). The average area of the FAZ measured in 37 eyes of 37 healthy subjects (average age, 34.8 ± 10.1 years) was 0.125 ± 0.07 mm2 (range, 0.047–0.358 mm2), with a mean diameter of 463.7 ± 105 μm (range, 285–708 μm) ().
Figure 3 Variability in size of the FAZ in healthy patients. In these nCPM images from 2 of the 37 eyes of healthy subjects, FAZ area and diameter, respectively, are: 0.156 mm2, 545 μm in a 33-year-old male (A); and 0.078 mm2, 394 μm in a 30-year-old male (B).
Abbreviations: FAZ, foveal avascular zone; nCPM, noninvasive capillary-perfusion map.
Clinical pathology imaging
Branch retinal vein occlusion
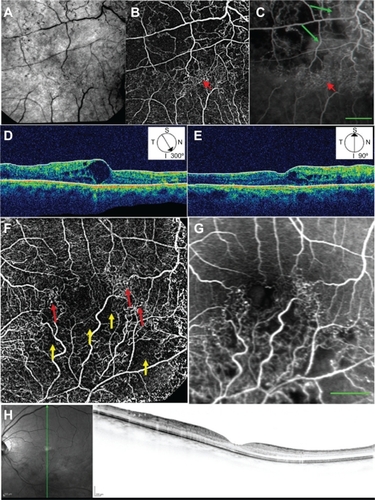
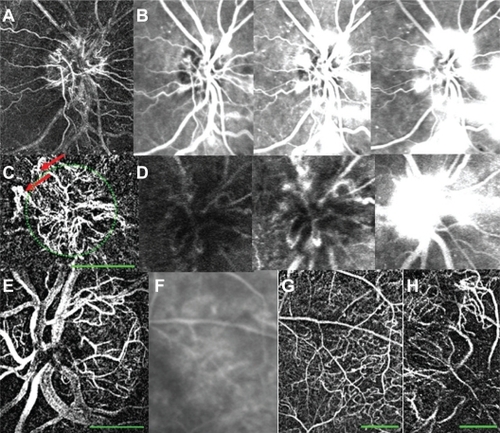
In all eyes with BRVO, nCPMs show a fine vascular pattern not visible on regular red-free imaging (). Also shown are large zones of pathological nonperfusion, which correspond to areas in the FA image that are not masked by dye leakage ( and ). The nCPM image does not show the leakage from abnormal vasculature. The vascular networks of pathological collaterals and connecting channels through and around the fovea can be seen in great detail in the nCPM (, , , and ), and correspond to the area of retinal edema demonstrated on OCT (, , and ).
Figure 4 Red-free, nCPM, FA, and OCT images from two patients with BRVO. (A) Red-free image from a 57-year-old male suffering from BRVO with macular edema in the right eye. (B) Corresponding nCPM image (nine series combined into one). (C) Corresponding FA image; green arrows show examples of leaks. The nCPM shows fine vascular detail not visible on the regular red-free image. Macular vascular networks of pathological collateral and connecting channels (red arrows) are shown in detail in the nCPM. (D, E) Corresponding OCT images displaying cystoid macular edema in the region of the abnormal vasculature. (F) nCPM image (nine series combined into one) from a 63-year-old female suffering from BRVO with macular edema in the left eye. (G) Corresponding FA image. The nCPM image demonstrates both nonperfusion (yellow arrows) and detailed neovascularization (red arrows), which correspond with the FA image. (H) Corresponding OCT images displaying edema in the region of the abnormal vasculature.
Abbreviations: BRVO, branch retinal vein occlusion; FA, fluorescein angiography; nCPM, noninvasive capillary-perfusion map; OCT, optical coherence tomography.
Diabetic patients
Vascular abnormalities seen in the nCPMs of patients with NPDR demonstrate details such as vascular loops and arteriovenous shunts ( and ). Images of patients with NPDR also demonstrate areas of capillary nonperfusion ( and ). The nCPM images obtained by RFI scanning from eyes with PDR display neovascularization at the optic disc and elsewhere (). These coarse, tortuous vessels can be seen protruding from the retina or optic disc surface.
Figure 5 nCPM and FA images from patients with NPDR. (A) nCPM image of the left eye of a 59-year-old male with NPDR (nine series combined into one). (B) Corresponding FA scanning laser ophthalmoscopic image. The nCPM demonstrates vascular loops (red ellipse) and vascular shunts (green arrow). FA images are capable of showing these patterns,Citation22,Citation46 the FA presented here do not show these patterns due to late timing and suboptimal focusing in that area. (C) nCPM image of the left eye of a 60-year-old male with NPDR (eleven series combined into one). (D) Corresponding FA scanning laser ophthalmoscopic image; yellow arrows demonstrate nonperfusion. Most likely better FA images than those obtained here can be accomplished.
Abbreviations: nCPM, noninvasive capillary-perfusion map; FA, fluorescein angiography; NPDR, nonproliferative diabetic retinopathy.
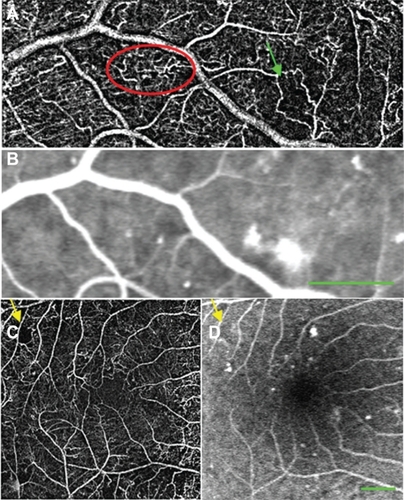
Figure 6 nCPM imaging of patients with PDR. (A) nCPM image of the right eye of a 59-year-old female with PDR demonstrating NVD. (B) Equivalent FA images at different stages after fluorescein injection. (C) nCPM of the right eye of a 50-year-old male with PDR, showing NVD. Note the coarse, tortuous vessels (red arrows) protruding from the optic nerve head surface (green outline), typical of this condition. (D) Corresponding FA images as a function of time, displaying leakage from these vessels. (E) Another example of an nCPM image demonstrating NVD in the left eye of a 68-year-old male with PDR. (F, G) FA (F) and corresponding nCPM (G) images showing abnormal vasculature in the right eye of an 87-year-old female. (H) nCPM image of neovascularization elsewhere in the left eye of a 50-year-old male with PDR.
Abbreviations: FA, fluorescein angiography; nCPM, noninvasive capillary-perfusion map; NVD, neovascularization of the optic disc; PDR, proliferative diabetic retinopathy.
Foveal avascular zone measurement in patients with diabetic retinopathy
In 14 eyes with DR, a clear image of the fovea was available (in 2 with PDR and in 12 with NPDR). The mean FAZ diameter and area in these patients were 641.5 ± 82.3 μm and 0.201 ± 0.07 mm2, respectively (). This was significantly larger than the corresponding values recorded above for healthy subjects (n = 37, , , and ) (P < 0.001 for both diameter and area). Patients with DR were older (average age 59.2 ± 10.6) than the healthy subjects (average age 34.8 ± 10.1; P < 0.001). However, the correlation between age and FAZ size was not significant. Good correlation was found between FAZ diameter and visual acuity in these patients (R2 = 0.34, P < 0.05); thus, poorer visual acuity was associated with larger FAZ diameter.
Figure 7 FAZ measurements in healthy subjects and in patients with retinal diseases. (A) A healthy 39-year-old female. Area and diameter, respectively, of FAZ: 0.114 mm2, 464 μm. (B) A 62-year-old female with DR. Area and diameter, respectively, of FAZ: 0.225 mm2, 672 μm. The green dotted line encircles the FAZ. Average over many healthy and DR subject showed similar results (see text).
Abbreviations: DR, diabetic retinopathy; FAZ, foveal avascular zone.
Age-related macular degeneration
RFI scanning of patients with AMD yielded a combined nCPM that showed evidence of a neovascular membrane in the same area as shown by FA ( and ). In the corresponding OCT image, the retinal vascular membrane can be seen in the same area ().
Figure 8 nCPM imaging of an AMD patient. (A) nCPM image (eight series combined into one) from a 73-year-old female suffering from AMD with a neovascular membrane in the right eye. White dots appear as a result of drusen. (B) Corresponding FA image. (C) Corresponding OCT images demonstrating mostly scarred neovascularization combined with some retinal fluid.
Abbreviations: AMD, age-related macular degeneration; FA, fluorescein angiography; nCPM, noninvasive capillary-perfusion map; OCT, optical coherence tomography.
Discussion
This study presents noninvasive, clinically applicable motion-contrast imaging of the fine retinal vasculature in 130 patients and 37 healthy subjects. The nCPM images demonstrate detailed capillary networks, often shown with comparable quality to that of images obtained by invasive angiography. These nCPM images clearly presented both normal avascularized areas such as the FAZ and pathological ischemic areas such as those seen in DR and BRVO. Furthermore, pathologies of the vasculature, such as shunts and neovascularization, were delineated by nCPMs in patients with DR or AMD. A clear advantage of nCPM over FA is that it is noninvasive and therefore can be used to follow the status of capillaries at any required time interval. Disadvantages relative to FA are discussed below.
Increase in foveal avascular zone in patients with diabetic retinopathy
The size of the FAZ reflects the condition of the capillary circulation surrounding the foveal area, and can be a valuable staging tool as it increases under pathological conditions.Citation27,Citation28 FAZ was measured noninvasively as long as 20 years ago by the entoptic method,Citation29 revealing an increase in FAZ size in DR patients.Citation30 That method, however, is subjective and depends on patient training and compliance. Our measurements revealed a significant increase in FAZ size in patients with DR relative to the healthy group. The FAZ measurement obtained by nCPMs in healthy subjects was within the documented range of the FAZ diameter (350–750 μm).Citation31 Loss of capillaries in the fovea is common in patients with ischemic retinopathies, and FAZ size has been shown to correlate with the visual prognosis in these cases.Citation31,Citation32 As previously reported,Citation30 we found a correlation between poorer visual acuity and larger FAZ diameter. Thus, the use of nCPM images should make it possible to measure FAZ easily, and provide a convenient and safe way to monitor this zone for an increase in size and other related changes during follow-up. Measurement of FAZ size can also help to assess suitability for treatment, given that different treatments are needed for a highly ischemic fovea and one that is well perfused.Citation33 FAZ measurements thus exemplify one of the ways in which nCPM images could be quantitatively analyzed.
Comparison with the gold standard FA
FA, currently the gold standard for the assessment of capillary maps in clinical practice, is widely used in the study, diagnosis, planning, and assessment of treatment response in a variety of ocular diseases, some of which require repeated imaging.Citation16,Citation25,Citation34,Citation35 FA-related adverse effects are common, and its frequently repeated use is accompanied by a higher risk of complications.Citation24,Citation25 A noninvasive imaging procedure such as nCPM might therefore be a desirable alternative for monitoring of chronic pathologies. The only discomfort associated with RFI use is related to bright light and is similar to that experienced with a conventional fundus camera. Moreover, because it can be safely and easily repeated, nCPM can potentially provide an intensive screening and follow-up tool once an optimal rate of successful imaging is reached.
It should be mentioned, however, that a prominent clinical benefit of FA and a major justification for its clinical use is the visualization of fluorescein leaks from microvessels, particularly in DR patients with microaneurysms and neovascularization.Citation16 Neovascularization and anti-angiogenic therapies influence vessel permeability, affecting measurements of lesion size by FA.Citation36 Whereas nCPM images do not reveal leaks, a critical diagnostic parameter, the technique can, as a consequence, provide an alternative means of assessing lesion size, which may be overestimated by FA in cases where the leakage of contrast agent is substantial. Similarly, when the optic nerve head is imaged, the high permeability of the ciliary capillary network to fluorescein may mask vascular detailsCitation37 that would be detectable on nCPM. Histological studies demonstrate that the foveal capillary network has multiple planes embedded in the different layers of the retinal tissue.Citation38,Citation39 FA images show the terminal capillaries around the FAZ in great precision and smaller and deeper capillaries are also visualized partially.Citation40 Since the same optics are used for obtaining nCPM images, the same depth of field resolution is expected. Thus, the nCPM images presented here showed also some contribution from nonsurface capillaries as seen by standard FA. In addition, nCPM provides vascular information, for example on arteriovenous shunts, collaterals, and dilated blood vessels ( and ) that was previously found with FA.Citation20–Citation22 Because of the risk of undesirable side effects of fluorescein, FA is usually not performed unless a definite clinical condition is known to exist. For this reason, the prevalence and importance of such vascular patterns in healthy and diseased retinas have not been extensively studied. The use of nCPM permits frequent and detailed assessment of such vascular patterns, which could then serve as a basis for wide-ranging investigations aimed at increasing knowledge and improving its clinical application. In addition, the frequency of capillary monitoring facilitated by nCPM will improve patient follow-up and demonstrate changes induced pathologically or therapeutically, while minimizing the need for FA imaging. A comparison between the FA and nCPM images performed by three different retina experts is described in Supplementary Table 1.
Comparison with other noninvasive techniques
Functional optical imaging based on retinal illumination with stroboscopic flashes was described some 5 years ago and clearly demonstrates the feasibility of using motion contrast for tracing capillaries in vivo.Citation5,Citation6 Most recently, some remarkable new noninvasive imaging technologies have been used to obtain retinal capillary maps without fluorescein injection.Citation11,Citation14,Citation15,Citation41–Citation43 Ultra high-speed OCT produces vascular maps demonstrating architectural/morphological details, but without differentiating between functional and nonfunctional vessels as shown by the nCPM images in the present study. Thus, vessel walls are visualized but information on perfusion is lacking.Citation41 Fourier-domain OCT produces maps by optical microangiography using blood motion contrastCitation14,Citation15 and has the advantage of three-dimensional imaging, thus displaying several vascular layers. Using this method, three separate layers of microvasculature were defined in the ganglion cell layer, the anterior and the posterior inner nuclear layers.Citation15 Relative to the present nCPM images, however, those images have a long acquisition time and a limited field of view. The elegant adaptive optics scanning laser ophthalmoscope produces capillary maps using leukocytes for motion contrast, but the resulting images have a limited field of view.Citation11,Citation12 Combining overlapping images to create montages enable visualization of a larger area by these techniques.Citation12,Citation15 Capillary maps have also been produced by several techniques using early noncommercialized setups. The feasibility of those methods for imaging of various pathologies in patients has yet to be proven. In the present study, using simple xenon-lamp stroboscopic lighting rather than laser, we were able to demonstrate detailed capillary maps with fields of view between 8.5 and 24.4 mm2, which are 200–800-fold larger than those obtained by scanning laser ophthalmoscopy or by OCT. Furthermore, processing timeCitation8,Citation9 makes the present approach more suitable for a clinical setting.
Current limitations and future improvements
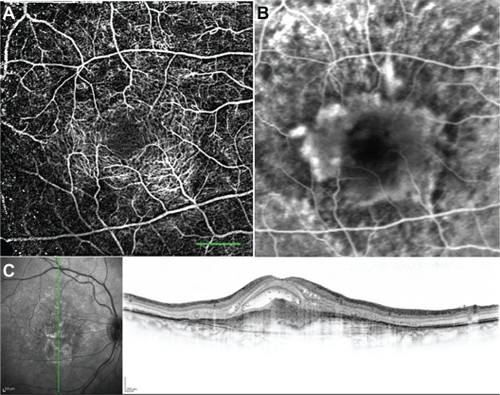
The nCPM data described in this study have certain limitations. Since the nCPM is limited by the optical quality of the eye, individuals with cataract or high myopia cannot be adequately imaged. Unlike methods based on the use of a contrast agent, nCPM does not show leakage of plasma from abnormal vasculature since it is based on the motion of RBCs. Use of oral FA in the clinic,Citation44 while having the disadvantage of providing no temporal information, could easily and with minimal invasiveness complement the nCPM images with leakage information. We used this approach with the RFI following a measurement of the nCPM, with good results (see ).
Figure 9 Oral FA for leakage imaging. An nCPM image (A) of a patient with CSR. The nCPM is complemented by oral FA imaging (B) (25 mg/kg)Citation44 that was acquired by the RFI 20 minutes after fluorescein administration, and demonstrates the fluid leakage.
The nCPM also does not highlight microaneurisms. However, these are easily picked out on the standard red-free image provided by the RFI. Future research is likely to lead to further improvement in nCPMs. The nCPM images are very sensitive to focusing, resulting in failure to produce highly informative capillary images in some patients. Therefore, one desirable improvement will be to increase the operator ability of acquiring perfectly focused images. This can be accomplished either by refocusing algorithms applied to out-of-focus images or by relying on objective digital criteria to obtain the best possible focus of the retinal image.
Summary
To summarize, this study shows that high-quality capillary-perfusion maps of large retinal areas can be obtained noninvasively and at high resolution from patients suffering from common retinal diseases. The approach used here to obtain retinal nCPMs can potentially enhance capillary visualization in any optically imaged organ. It may thus be possible to obtain detailed capillary maps of internal organs such as the gastrointestinal tract and liver by endoscopy or microendoscopy, thereby contributing significantly to the follow-up, research, and refinement of anti-angiogenic treatments.Citation45 As an added benefit, the xenon-lamp stroboscopic lighting utilized during nCPM imaging allows the detection of other functional parametersCitation6 during a single imaging system. Use of the RFI has the advantage that the same images can easily provide additional important information on the velocity of blood flow in the capillaries. They can also demonstrate the direction of flow (eg, backward flow in multiple vessels was observed in a patient with BRVO, highlighting the collaterals and shunts).Citation6 In addition, RFI spectral imaging provides information on tissue oxygen levels.Citation6 All of these parameters together can provide comprehensive information of the functional status of tissues in a clinical environment.
Conclusion
In the pilot clinical studies of patients with DR, AMD, and BRVO described here, the nCPM provided good capillary-perfusion maps that were comparable to the images acquired with an extrinsic contrast agent and often provide much more detail about the microvascular structure. This conclusion (Table S1) was recently confirmed and extended independently by a statistical analysis of IV fluorescein angiography and nCPM obtained from the same 33 eyes (Rezeq et alCitation47). Acquisition of nCPM images is noninvasive, comfortable, fast, safe, does not require precise timing of imaging, has no adverse effects, and can be repeated as often as clinically required. Merging modalities of oral FA images with nCPM images can be expected to lead to practical improvements in retinal imaging, avoiding the need for an IV fluorescein injection.
Acknowledgements
The authors thank Matan Ben Asher for his dedicated technical assistance with the RFI system, Oshrat Barzilai and Galit Yair-Pur from the Department of Ophthalmology at Tel Aviv Sourasky Medical Center, Tel Aviv, Israel, for their assistance with FA imaging, and Prof M Belkin for constructive comments. The authors also thank Shirley Smith for editing the manuscript.
Supplementary data
Figure S1 nCPM images of different magnifications. nCPM images produced from images acquired with a diagonal field of 20 degrees (A) and 35 degrees (B). The 20-degree images produce more capillary detail as a result of the limited resolution of the camera. This may change in future, and detailed images would be produced with a better field of view.
Abbreviation: nCPM, noninvasive capillary-perfusion map.
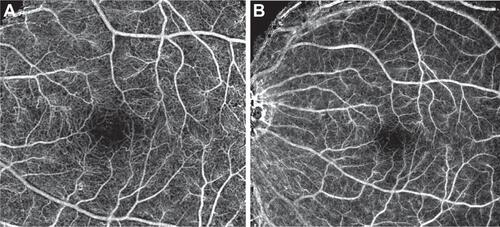
Figure S2 nCPM quality obtained in a single 125-ms session. Examples of three single-series nCPM images. Eight images were realigned to correct eye movements. Differential images were created for each image to eliminate retina pattern. The middle panel produced maps of the best quality, in which even the foveal avascular zone was detectable. These differential images were used to create each of the single-series nCPMs. By combining five overlapping sets of series, it was possible to create an inter-series nCPM image of this healthy subject, as seen in .
Note: Scale bar: 500 μm.
Abbreviation: nCPM, noninvasive capillary-perfusion map.
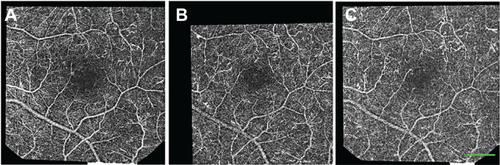
Figure S3 Frames from movies illustrating the procedure from retinal images to the noninvasive capillary-perfusion map (nCPM). (A) Frame of realigned frames of a raw movie; follow the web link to Movie S3A (http://www.youtube.com/watch?v=Fn-W95Yec8o) showing 40 registered raw images. (B) Frame of the corresponding ratio image; Movie S3B shows the ratio images (http://www.youtube.com/watch?v=buPTP4C7j5i); the flow in large vessels can already be detected visually. The nCPM illustrated in C and was calculated by the present algorithm (see Methods) from the motion of small black dots in all such ratio images acquired.
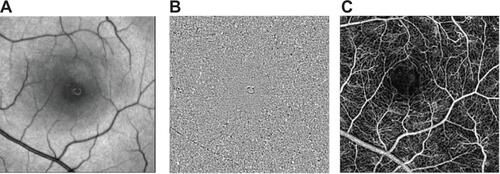
Figure S4 Reproducibility of the nCPMs. Two nCPMs, each produced by averaging five different series.
Note: Scale bar: 500 μm.
Abbreviation: nCPM, noninvasive capillary-perfusion map.
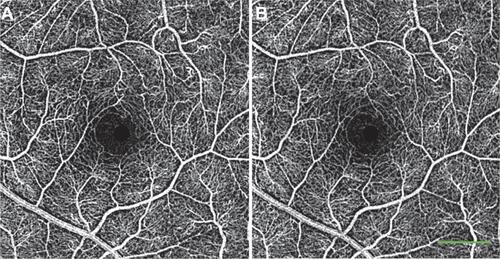
Figure S5 Reproducibility of noninvasive capillary-perfusion map over time. (A, B) Images from a healthy subject taken on two different occasions, 6 months apart.
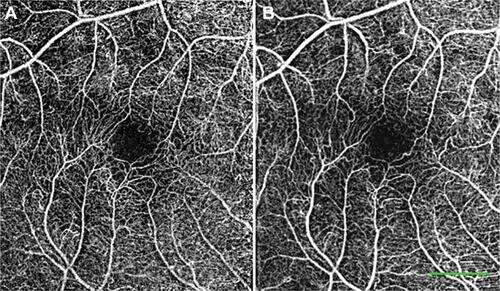
Figure S6 Peripheral noninvasive capillary-perfusion maps. Images from healthy subjects showing the peripheral retinal capillaries in great detail.
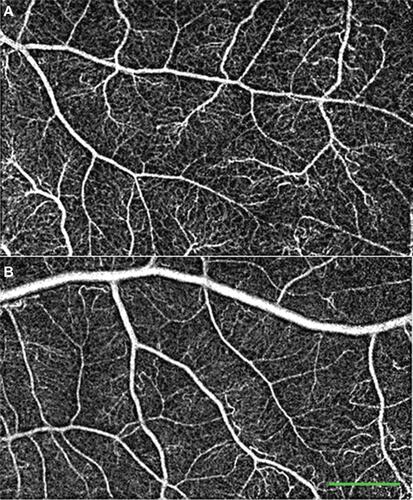
Table S1 A comparison of FA and nCPM images
Disclosure
Funding of clinical trials was provided by Optical Imaging Ltd (www.opt-imaging.com). Company members participated in study design, data collection and analysis, decision to publish, and preparation of the manuscript. DAN, ZBE, and HB are employees of Optical Imaging Ltd. AG is a consultant at and shareholder of Optical Imaging Ltd and is an author of several patents on related topics.
References
- SchmettererLGarhoferGHow can blood flow be measured?Surv Ophthalmol200752Suppl 2S134S13817998038
- RamanRNPivettiCDMatthewsDLTroppmannCDemosSGA non-contact method and instrumentation to monitor renal ischemia and reperfusion with optical spectroscopyOpt Express200917289490519158904
- GrinvaldALiekeEFrostigRDGilbertCDWieselTNFunctional architecture of cortex revealed by optical imaging of intrinsic signalsNature198632460953613643785405
- GrinvaldAShohamDShmuelAIn-Vivo optical imaging of cortical architecture and dynamicsWindhorstUJohanssonHModern Techniques in Neuroscience ResearchUmeåSpringer1999893969
- GrinvaldABonhoefferTVanzettaIHigh-resolution functional optical imaging: from the neocortex to the eyeOphthalmol Clin North Am2004171536715102513
- NelsonDAKrupskySPollackASpecial report: noninvasive multi-parameter functional optical imaging of the eyeOphthalmic Surg Lasers Imaging2005361576615688972
- SatoYChenJZoroofiRAHaradaNTamuraSShigaTAutomatic extraction and measurement of leukocyte motion in microvessels using spatiotemporal image analysisIEEE Trans Biomed Eng19974442252369125805
- ArendORemkyAHarrisABertramBReimMWolfSMacular microcirculation in cystoid maculopathy of diabetic patientsBr J Ophthalmol19957976286327662623
- ArendOWolfSJungFRetinal microcirculation in patients with diabetes mellitus: dynamic and morphological analysis of perifoveal capillary networkBr J Ophthalmol19917595145181911651
- WolfSArendOToonenHBertramBJungFReimMRetinal capillary blood flow measurement with a scanning laser ophthalmoscope. Preliminary resultsOphthalmology199198699610001866155
- MartinJARoordaADirect and noninvasive assessment of parafoveal capillary leukocyte velocityOphthalmology2005112122219222416257054
- TamJMartinJARoordaANoninvasive visualization and analysis of parafoveal capillaries in humansInvest Ophthalmol Vis Sci20105131691169819907024
- FergusonRHammerDElsnerAWebbRBurnsSWeiterJWide-field retinal hemodynamic imaging with the tracking scanning laser ophthalmoscopeOpt Express200412215198520819484077
- AnLWangRKIn vivo volumetric imaging of vascular perfusion within human retina and choroids with optical micro-angiographyOpt Express20081615114381145218648464
- FinglerJZawadzkiRJWernerJSSchwartzDFraserSEVolumetric microvascular imaging of human retina using optical coherence tomography with a novel motion contrast techniqueOpt. Express20091724221902220019997465
- HurleyBRRegilloCDFluorescein angiography: general principles and interpretationArevaloJFRetinal Angiography and Optical Coherence TomographyNew York, NYSpringer20092742
- RechtmanEHarrisAKumarRAn update on retinal circulation assessment technologiesCurr Eye Res200327632934314704917
- ZhangSXMaJXOcular neovascularization: Implication of endogenous angiogenic inhibitors and potential therapyProg Retin Eye Res200726113717074526
- WitmerANVrensenGFVan NoordenCJSchlingemannROVascular endothelial growth factors and angiogenesis in eye diseaseProg Retin Eye Res200322112912597922
- BekTVenous loops and reduplications in diabetic retinopathy. Prevalence, distribution, and pattern of developmentActa Ophthalmol Scand199977213013410321524
- BekTA clinicopathological study of venous loops and reduplications in diabetic retinopathyActa Ophthalmol Scand2002801697511906308
- KohnerEMDolleryCTFluorescein angiography of the fundus in diabetic retinopathyBr Med Bull19702621661704911770
- LiraRPOliveiraCLMarquesMVSilvaARPessoa CdeCAdverse reactions of fluorescein angiography: a prospective studyArq Bras Oftalmol200770461561817906757
- DzurinkoVLGurwoodASPriceJRIntravenous and indocyanine green angiographyOptometry2004751274375515624671
- KwanASBarryCMcAllisterILConstableIFluorescein angiography and adverse drug reactions revisited: the Lions Eye experienceClin Experiment Ophthalmol2006341333816451256
- StewartCVTsaiCLRoysamBThe dual-bootstrap iterative closest point algorithm with application to retinal image registrationIEEE Trans Med Imaging200322111379139414606672
- YapMGilchristJWeatherillJPsychophysical measurement of the foveal avascular zoneOphthalmic Physiol Opt1987744054103454917
- ConrathJGiorgiRRaccahDRidingsBFoveal avascular zone in diabetic retinopathy: quantitative vs qualitative assessmentEye200519332232615258601
- BradleyAApplegateRAZeffrenBSvan HeuvenWAPsychophysical measurement of the size and shape of the human foveal avascular zoneOphthalmic Physiol Opt199212118231584610
- ApplegateRABradleyAvan HeuvenWALeeBLGarciaCAEntoptic evaluation of diabetic retinopathyInvest Ophthalmol Vis Sci19973857837919112972
- TyrbergMPonjavicVLovestam-AdrianMMultifocal electroretinogram (mfERG) in patients with diabetes mellitus and an enlarged foveal avascular zone (FAZ)Doc Ophthalmol2008117318518918324430
- Mintz-HittnerHAKnight-NananDMSatrianoDRKretzerFLA small foveal avascular zone may be an historic mark of prematurityOphthalmology199910671409141310406630
- ChungEJRohMIKwonOWKohHJEffects of macular ischemia on the outcome of intravitreal bevacizumab therapy for diabetic macular edemaRetina200828795796318698297
- MeyerCHCurrent treatment approaches in diabetic macular edemaOphthalmologica2007221211813117380066
- ChakravarthyUSoubraneGBandelloFEvolving European guidance on the medical management of neovascular age related macular degenerationBr J Ophthalmol20069091188119616929063
- GragoudasESAdamisAPCunninghamETJrFeinsodMGuyerDRPegaptanib for neovascular age-related macular degenerationN Engl J Med2004351272805281615625332
- HayrehSSThe blood supply of the optic nerve head and the evaluation of it: myth and realityProg Retin Eye Res200120556359311470451
- SnodderlyDMWeinhausRSRetinal vasculature of the fovea of the squirrel monkey, Saimiri sciureus: three-dimensional architecture, visual screening, and relationships to the neuronal layersJ Comp Neurol199029711451632376631
- SnodderlyDMWeinhausRSChoiJCNeural-vascular relationships in central retina of macaque monkeys (Macaca fascicularis)J Neurosci1992124116911931556592
- WeinhausRSBurkeJMDeloriFCSnodderlyDMComparison of fluorescein angiography with microvascular anatomy of macaque retinasExp Eye Res19956111167556462
- SrinivasanVJAdlerDCChenYUltrahigh-speed optical coherence tomography for three-dimensional and en face imaging of the retina and optic nerve headInvest Ophthalmol Vis Sci200849115103511018658089
- PotsaidBGorczynskaISrinivasanVJUltrahigh speed spectral / Fourier domain OCT ophthalmic imaging at 70,000 to 312,500 axial scans per secondOpt Express20081619151491516918795054
- TaoYKKennedyKMIzattJAVelocity-resolved 3D retinal microvessel imaging using single-pass flow imaging spectral domain optical coherence tomographyOpt Express20091754177418819259254
- WatsonAPRosenESOral fluorescein angiography: reassessment of its relative safety and evaluation of optimum conditions with use of capsulesBr J Ophthalmol19907484584612390518
- DrevsJSchneiderVThe use of vascular biomarkers and imaging studies in the early clinical development of anti-tumour agents targeting angiogenesisJ Intern Med2006260651752917116002
- HershPSGreenWRThomasJVTractional venous loops in diabetic retinopathyAm J Ophthalmol19819256616717304693
- RezeqSSSampatKMChhablaniJComparative analysis of the macula in normal and pathologic eyes using the retinal function imager (RFI), a novel, non-invasive imaging techniqueInvest Ophthalmol Vis Sci201152 ARVO E-Abstract 2899.