Abstract
Aims
To evaluate the capability of Fourier-domain optical coherence tomography (FD-OCT) to detect structural damage in patients with preperimetric glaucoma.
Methods
A total of 178 Caucasian subjects were enrolled in this cohort study: 116 preperimetric glaucoma patients and 52 healthy subjects. Using three-dimensional FD-OCT, the participants underwent imaging of the ganglion cell complex (GCC) and the optic nerve head. Sensitivity, specificity, likelihood ratios, and predictive values were calculated for all parameters at the first and fifth percentiles. Areas under the curves (AUCs) were generated for all parameters and were compared (Delong test). For both the GCC and the optic nerve head protocols, the OR logical disjunction (Boolean logic operator) was calculated.
Results
The AUCs didn’t significantly differ. Macular global loss volume had the largest AUC (0.81). Specificities were high at both the fifth and first percentiles (up to 97%), but sensitivities were low, especially at the first percentile (55%–27%).
Conclusion
Macular and papillary diagnostic accuracies did not differ significantly based on the 95% confidence interval. The computation of the Boolean OR operator has been found to boost diagnostic accuracy. Using the software-provided classification, sensitivity and diagnostic accuracy were low for both the retinal nerve fiber layer and the GCC scans. FD-OCT does not seem to be decisive for early detection of structural damage in patients with no functional impairment. This suggests that there is a need for analysis software to be further refined to enhance glaucoma diagnostic capability.
Keywords:
Introduction
Glaucoma is a progressive, irreversible optic neuropathy causing a gradual loss of ganglion cell axons. Early detection is therefore essential for the institution of pressure-reducing treatment to stop or delay progressive loss of visual function. In clinical practice, glaucoma diagnosis is performed using ophthalmoscopic examination of the optic nerve head (ONH), retinal nerve fiber layer (RNFL), and visual field testing with standard automatic perimetry.Citation1,Citation2 In recent years, new technologies for the early detection of structural damage have been developed. Optical coherence tomography (OCT) provides real-time, objective, and reproducible measurements of the ONH and RNFL.Citation3 In 2006, the first high-speed, high-resolution OCTs, known as Fourier-domain (FD) or spectral-domain OCT, became commercially available. FD-OCT provides increased resolution and scanning speed and improves visualization of the tissues relevant to the detection and management of glaucoma.Citation4,Citation5
The FD-OCT RTVue-100 (Optovue Inc, Fremont, CA) offers comprehensive glaucoma evaluation by providing assessment of RNFL thickness, optic disc morphology, and ganglion cell complex (GCC) thickness, which is defined as the combination of nerve fiber, ganglion cell, and inner plexiform layers.
This study was designed to evaluate and compare the glaucoma detection ability of macular GCC thickness (measured by GCC scan) with papillary RNFL thickness (measured by ONH scan) with FD-OCT RTVue-100, using the software-provided classifications for detection of structural damage in eyes with preperimetric glaucoma and no functional visual loss.
Materials and methods
This was a prospective, nonrandomized, observational cohort study conducted between October 2009 and September 2010 at the Eye Clinic, Section of Ophthalmology, Department of Clinical Physiopathology, University of Turino, Italy. Patients with glaucoma were consecutively enrolled as they presented at our clinic; sex and age-matched normal control group was recruited from normal healthy population.
Study population
A total of 178 eyes of 178 Caucasian subjects were included in the study. One eye from each subject was randomly selected if both eyes were eligible.
All subjects underwent complete ophthalmic examination, including a review of medical history, slit-lamp biomicroscopy of anterior and posterior segment, gonioscopy, Goldmann applanation tonometry, ultrasound pachymetry, and papillary and macular imaging using FD-OCT (RTVue software version A4, 5, 0, 59). Visual field examination was obtained for each eye using standard automated perimetry performed with a Humphrey Field Analyzer (HFA) (Carl Zeiss Meditec, Jena, Germany) using the Swedish interactive threshold algorithm (SITA) standard strategy, program 24-2. All patients with glaucoma were given at least two HFA tests. To minimize any learning effects, only the most recent HFA was used for analysis. To be included in the study, the eyes of all participants required good quality (false positives, fixation losses, false negatives of 25% or less with no observable testing artifacts) standard automated perimetry (Humphrey SITA 24-2 standard) for each eye.
The eyes of participants were classified as “Normal” or “PPG” (preperimetric glaucoma). The eligibility criteria for the groups are briefly described in the following paragraphs.
The Normal group (52 eyes) had: intraocular pressure (IOP) of <21 mm Hg; a normal Humphrey SITA 24-2 standard visual field (mean deviation [MD] and pattern standard deviation [PSD] within 95% limits of the normal reference and a glaucoma hemifield test within 97% limits); a central corneal thickness >500 μm; normal ONH, defined as intact neuroretinal rim without peripapillary hemorrhages, notches, localized pallor, or RNFL defects; normal RNFL; an open anterior chamber angle; and no history of chronic ocular or systemic corticosteroid use.
The PPG group (126 eyes) had: ONH changes, such as an optic rim notch or diffuse/generalized loss of optic rim tissue; vertical cup/disc diameter ratio asymmetry, unexplained by side differences in optic disc size; disc hemorrhages in conjunction with the finding of ocular hypertension (defined as IOP > 21 mm Hg); and reliable and reproducible normal Humphrey SITA 24-2 standard visual field.
Exclusion criteria for all groups were: best corrected visual acuity <20/40; age <25 or >80 years; spherical equivalent refractive error >+3.00 or <−6.00 diopters; diabetic retinopathy or other diseases that could cause visual field loss or optic disc abnormalities; and previous intraocular surgery.
OCT scanning procedure
Both eyes of each participant were scanned three times with the RTVue-100, whose glaucoma protocol includes RNFL scan, ONH scan, three dimensional disc scan, and GCC scan. For all parameters, the instrument-provided classification is indicated in a color-coded manner which reflects the probability that the parameter falls within or outside the normal range determined by the normative database. All comparisons were adjusted for known effects of age, optic disc size, and ethnicity.
If the value falls within the normal range (probability value is within 5%–95%), it is colored green to indicate the classification “Within Normal Limits”. If the value falls below the normal range (probability value is less than 5% but greater than 1%), it is colored yellow to indicate the classification “Borderline”. If the value falls outside the normal range (probability value is less than 1%), it is colored red to reflect the classification “Outside Normal Limits”.
For our study, we investigated the macular and papillary thicknesses as obtained by GCC and ONH scans, respectively.
All scans were performed by the same operator, masked to other clinical information. Scans with motion artifacts, segmentation errors, and images with signal strength index < 45 were further excluded.
Statistical analysis
For the participants in whom both eyes met inclusion criteria, one eye was randomly selected for analysis. The critical α-level for statistical significance was set at 0.05.
To evaluate the difference between the Normal and PPG groups, we compared the means of all parameters using independent t-test.
Sensitivity, specificity, positive and negative likelihood ratios, and positive and negative predictive values of the software-provided classification results were determined (at first and fifth percentile thresholds).
For the analysis, we first grouped Borderline with Outside Normal Limits together as abnormal results (abnormality at fifth percentile); we then grouped Borderline and Within Normal Limits together, considering abnormal results only the values Outside Normal Limits (abnormality at first percentile).
To assess discriminating power for glaucoma, areas under the receiver operating characteristic curve (AUCs) were calculated. The AUC estimates and their covariance matrix were calculated using the methods of De-Long et al and Obuchowski.
For both macular and papillary scans (GCC and ONH scan, respectively), the OR Boolean index was calculated: the macular or papillary scan of the eye was considered Borderline/Outside Normal Limits on the whole, even if only one of the parameters was abnormal. This new index, computed for both macular and papillary scan, was named “GCC OR” and “RNFL OR”, respectively. Applying to the Boolean disjunction OR, the worst parameter of the scan prevailed, so that an eye’s scan was considered Borderline/Outside Normal Limits on the whole, even when just one parameter was outside the 95% confidence interval (CI) compared with the normative database.
Results
A total of 178 eyes from 178 subjects were enrolled; demographic characteristics are summarized in .
Table 1 Demographic characteristics of participants and eyes analyzed in the study
shows statistics distribution of macular and papillary parameters by group and P-value of each parameter compared with independent t-test. Papillary and macular parameters were significantly thinner in PPG eyes, and both GCC global loss volume (GLV) and GCC focal loss volume (FLV) were statistically higher.
Table 2 Mean ± SD and range of GCC and RNFL parameters in the normal group and the PPG group
shows the results obtained at first and fifth percentiles. When Borderline and Outside Normal Limits classifications were grouped together (both considered abnormal), specificities were high (79%–96%) but sensitivities were quite low (50%–75%). The specificities were similar at the first and fifth percentiles, but sensitivities were def initely lower at the first percentile (27%–55%).
Table 3 Sensitivities and specificities calculated at first and fifth percentiles for each parameter
Positive predictive value at the fifth percentile varied from 60% to 83%, and the negative predictive value from 81% to 87%. Positive likelihood ratio was in most cases higher than 5 (RNFL inferior and all GCC parameters) and negative likelihood ratio values varied from 0.3 and 0.53.
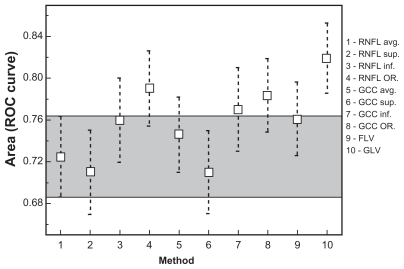
For each FD-OCT parameter, the AUCs were calculated (). The widest AUCs belong to GCC inferior (0.77, 95% CI 0.70–0.84), GCC OR (0.78, 95% CI 0.71–0.85), RNFL OR (0.79, 95% CI 0.72–0.86), and GLV (0.82, 95% CI 0.75–0.88).
Table 4 Diagnostic accuracy of GCC and RNFL parameters calculated by AROCs
Differences between AUCs were analyzed using the method of Hanley and McNeil. Comparing the AUCs, we found no significant differences in diagnostic accuracy ().
Table 5 Comparison between AUCs referring to the preperimetric group
We compared the AUCs of peripapillary parameters measured by ONH scan with AUCs of macular inner retinal layer parameters measured by GCC scan. The RNFL parameters with the widest AUCs were RNFL inferior (0.76, 95% CI 0.66–0.82) and RNFL OR (0.79, 95% CI 0.72–0.86); the best GCC parameters in terms of diagnostic accuracy were GCC inferior (0.77, 95% CI 0.70–0.84), GCC OR (0.79, 95% CI 0.71–0.85), and GLV (0.82, 95% CI 0.75–0.88).
The best GCC parameters had higher AUCs than the best RNFL parameters, but not in a statistically significant way (no differences were found applying the Bonferroni correction).
We calculated the Cohen’s Kappa coefficient, which expresses the diagnostic agreement between GCC and RNFL scans. According to Landis and Koch classification, our result demonstrated good agreement between the two scan protocols (K = 0.67).
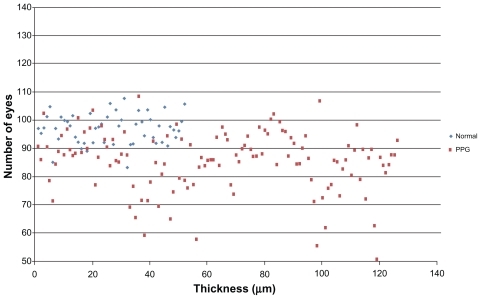
– show macular and papillary thickness of the groups: there is an evident overlapping of PPG eyes with healthy eyes.
Figure 1 Distribution of RNFL average thickness values for patients in normal group and PPG group.
Abbreviations: PPG, preperimetric glaucoma; RNFL, retinal nerve fiber layer.
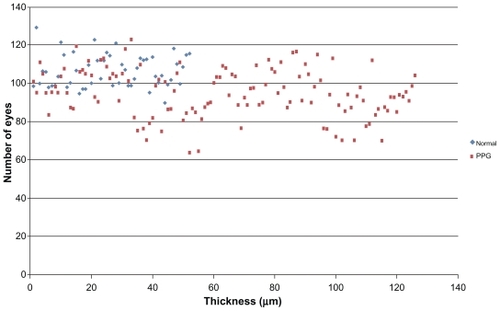
Figure 2 Distribution of RNFL superior thickness values for patients in normal group and PPG group.
Abbreviations: PPG, preperimetric glaucoma; RNFL, retinal nerve fiber layer.
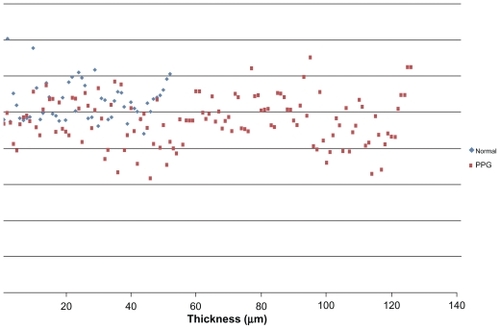
Figure 3 Distribution of RNFL inferior thickness values for patients in normal group and PPG group.
Abbreviations: PPG, preperimetric glaucoma; RNFL, retinal nerve fiber layer.
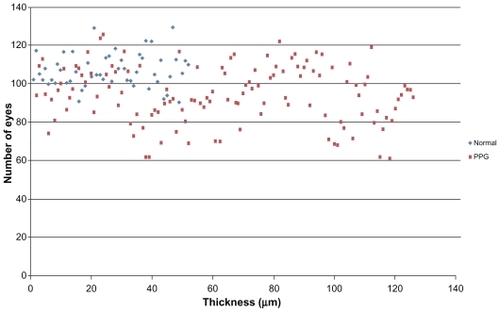
Figure 4 Distribution of GCC average thickness values for patients in normal group and PPG group.
Abbreviations: GCC, ganglion cell complex; PPG, preperimetric glaucoma.
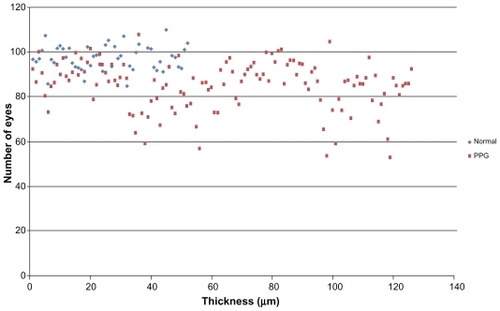
Figure 5 Distribution of GCC inferior thickness values for patients in normal group and PPG group.
Abbreviations: GCC, ganglion cell complex; PPG, preperimetric glaucoma.
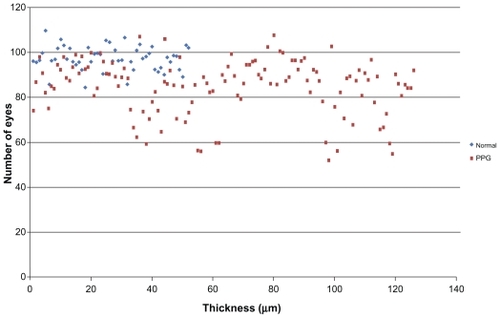
Figure 6 Distribution of GCC superior thickness values for patients in normal group and PPG group.
Abbreviations: GCC, ganglion cell complex; PPG, preperimetric glaucoma.
Discussion
Glaucoma management involves visual field testing and morphologic assessment of ONH and the RNFL. It is known that structural damage precedes detectable visual field loss measured with the standard automatic perimetry.Citation6 The quantitative morphometric analysis of ONH and RNFL contribute to a more reliable, reproducible, and early assessment in glaucoma: in this regard, it has been proved by Li et alCitation7 that RTVue-OCT may provide objective, quantitative, and reproducible images of the ONH and RNFL thickness in glaucoma.
The changes in the macular structures in the glaucomatous eyes are not visible during routine clinical examinations. The development of more sensitive measurement technology has increased interest in investigating this area for glaucoma diagnosis.Citation8–Citation11 Reduced macular thickness was initially described by Zeimer et alCitation12 using the slit-scanning Retinal Thickness Analyzer (Talia Technology Ltd, Neve-Ilan, Israel), hypothesizing that macular thickness could be a measure of glaucoma damage.
Ishikawa et alCitation9 developed a macular segmentation algorithm to measure sublayer thickness for glaucoma diagnosis: they showed that macular inner retinal complex (ganglion cell layer, inner plexiform layer, inner nuclear layer) was thinner in eyes with perimetric glaucoma.
Leung et alCitation10 used the Stratus TD-OCT (Carl Zeiss, Dublin, CA) to evaluate macular nerve fiber layer thinning in glaucoma. They reported a reduction in macular nerve fiber layer thickness in glaucomatous eyes compared with normal eyes.
Different previous studies have been done to determine which OCT analysis protocol yields the best discrimination performance in detecting glaucoma.Citation13,Citation14
Tan et alCitation15 showed that macular GCC thickness has a glaucoma discrimination ability comparable with papillary RNFL thickness. They also found that FLV and GLV have higher diagnostic accuracy than the GCC average: this may mean that, in some cases, pattern parameters are more sensitive or more specific.
Kim et alCitation16 observed that macular GCC thickness and RNFL thickness showed similar diagnostic performance for detecting early glaucoma.
In our study, to evaluate the diagnostic capability of the RTVue-100, we referred to the software-provided classification (color coded in green, yellow, and red), which is based on comparison between the measured values and the normative database. As shown in , all parameters in glaucomatous eyes showed significant damage compared with healthy eyes.
As shown in , specificity was high for all parameters, but sensitivity was poor for detection of structural damage in eyes with preperimetric glaucoma.
The areas under receiver operating curves observed in our study are smaller than those obtained in other studies.Citation7,Citation14,Citation15,Citation17 This depends on the stage of disease of the PPG eyes selected in our study, whose MD was −1.41 ± 0.7 dB and a PSD of 1.49 ± 0.5 dB: all our patients were at a very early stage of glaucoma. Glaucomatous structural damage is known to precede perimetrically assessed functional deficit. Thus, most of the glaucomatous patients enrolled in studies already had considerable structure damage. If we intended to see diagnostic sensitivity of newly introduced FD-OCT, we should evaluate patients with preperimetric stages of glaucoma. Considering our results, in routine clinical practice, the specificity of the instrument is high: it means that a value Outside Normal Limits or Borderline (red or yellow by instrument color-coded classification) strongly correlates to structural damage. On the contrary, the low sensitivity suggests that a value Within Normal Limits cannot exclude a structural undetectable damage.
Our results showed that at that stage of disease, RTVue- 100, with high specificity and positive predictive values, seemed to be very useful for screening purposes, but because of the low sensitivity, its usefulness for early detection in clinical practice is questionable. In routine clinical practice, it is extremely important to identify structural damage in patients with no defects in visual field HFA: the significance of our selection is that disease severity may have an influence on diagnostic accuracy of FD-OCT.
As demonstrated by Meideros et al,Citation18 the disease severity has a significant effect on the diagnostic performances of imaging instruments. Understanding the relationship between disease severity and test performance is important in evaluating the potential applications of a test in different clinical situations. From the results of our study, it can be expected that the performance of the FD-OCT in screening for patients with severe disease will be different from that for the identification of subjects with early glaucomatous damage in clinical practice. Considering the sensitivity/specificity analysis is heavily dependent on the severity of glaucomatous damage, the relatively low sensitivity may be related to the population evaluated, which only included early glaucoma patients. It is expected that the RTVue-100 may have higher sensitivities for the eyes with manifest visual field defects.
Based on AUC values obtained in our study, the top three FD-OCT parameters were GCC OR, RNFL OR, and GCC GLV. We could not find a statistically significant difference between the GCC and ONH diagnostic parameters (see ).
Figure 7 Comparison between AUCs.
Abbreviations: AUC, area under the curve; avg, average thickness; FLV, focal loss volume; GCC, ganglion cell complex; GLV, global loss volume; inf, inferior thickness; OR, the OR Boolean operator; RNFL, retinal nerve fiber layer; SE, standard error; sup, superior thickness.
At present, there is no consensus on which is the best structure parameter for early glaucoma diagnosis, and it is still unknown whether one or several of these diagnostic parameters should be used in the clinical diagnosis of early glaucoma. In conclusion, our study showed that the peripapillary and macular thickness and volume are lower in early glaucoma than in normal eyes; however, the poor sensitivity in the well defined study group showed that the ability to detect early structural damage in patients with no functional impairment is limited.
Further clinical evidence is needed to assess whether one of the two compared scans (GCC and ONH) is superior in detecting early glaucomatous damage.
Disclosure
The authors report no conflicts of interest in this work.
References
- Deleon-OrtegaJEArthurSNMcGwinGJrDiscrimination between glaucomatous and nonglaucomatous eyes using quantitative imaging devices and subjective optic nerve head assessmentInvest Ophthalmol Vis Sci2006473374338016877405
- ChenTCZengASunWSpectral domain optical coherence tomography and glaucomaInt Ophthalmol Clin200848294518936635
- SakataLMDeLeon-OrtegaJESakataVOptical coherence tomography of the retina and optic nerve – a reviewClin Experiment Ophthal2009379099
- FujimotoJGDukerJSSchumanJSImproved visualization of glaucomatous retinal damage using high speed, ultra high resolution optical coherence tomographyOphthalmology200811578278917884170
- VizzeriGBalasubramanianMBowdCSpectral domain-optical coherence tomography to detect localized retinal nerve fiber layer defects in glaucomatous eyesOpt Express20091754004401819259242
- WollsteinGSchumanJSPriceLLOptical coherence tomography evaluation of retinal nerve fiber layer thickness in glaucomaArch Ophthalmol200512346447015824218
- LiSWangXLiSEvaluation of optic nerve head and retinal nerve fiber layer in early and advanced glaucoma using frequency-domain optical coherence tomographyGraefes Arch Clin Exp Ophthalmol201024842943419937335
- GreenfieldDSBaggaHKnightonRWMacular thickness changes in glaucomatous optic neuropathy detected using optical coherence tomographyArch Ophthalmol2003121414612523883
- IshikawaHSteinDMWoolsteinGMacular segmentation with optical coherence tomographyInvest Ophthalmol Vis Sci2005462012201715914617
- LeungCKChanWMYungWHComparison of macular and peripapillary measurements for the detection of glaucoma: an optical coherence tomography studyOphthalmology200511239140015745764
- TanOLiGLuATMapping of macular substructures with optical coherence tomography for glaucoma diagnosisOphthalmology200811594995617981334
- ZeimerRAsraniSZouSQuantitative detection of glaucomatous damage at the posterior pole by retinal thickness mapping. A pilot studyOphthalmology19981052242319479279
- ShulzeALamparterJHoffmannEMNew options of high resolution optical coherence tomography in glaucoma diagnosticOphthalmologe2009106870270419652978
- SeongMSungKRChoiEHMacular and peripapillary retinal nerve fiber layer measurements by spectral domain optical coherence tomography in normal-tension glaucomaInvest Ophthalmol Vis Sci20105131446145219834029
- TanOChopraVLuADetection of macular ganglion cell loss in glaucoma by fourier domain optical coherence tomographyOphthalmology20091162305231419744726
- KimJSIshikawaHSungKRRetinal nerve fiber layer thickness measurement reproducibility improved with spectral domain optical coherence tomographyBr J Ophthalmol2009931057106319429591
- MoriSHangaiMSakamotoAYoshimuraNSpectral domain optical coherence tomography measurement of macular volume for diagnosing glaucomaJ Glaucoma201019852853420164794
- MeiderosFAZangwillLMBowdCInfluence of disease severity and optic disc size on the diagnostic performance of imaging instruments in glaucomaInvest Ophthalmol Vis Sci2006471008101516505035