
Abstract
Purpose
To compare choriocapillaris flow voids (FV) in patients with neovascular age-related macular degeneration (AMD) with age-matched normal controls using swept-source optical coherence tomography angiography (SS-OCTA).
Patients and methods
Eleven eyes of 11 subjects with neovascular AMD and 11 eyes of 11 age-similar normal subjects were imaged using SS-OCTA with a 6x6mm scanning pattern. Choriocapillaris FV, defined as a percentage of regions determined to have flow deficits divided by the total scanned region, was measured using a one standard deviation thresholding algorithm developed from a database of age-similar normal subjects.
Results
Choriocapillaris FV was more extensive in patients with choroidal neovascularization (CNV) compared to age-similar normal subjects (FV: 20.56±4.95, 95% CI: 17.64–23.49 vs FV: 10.95±2.08, 95% CI: 9.73–12.18, respectively; P=0.0001). FV within a two-degree margin surrounding CNV in wet AMD subjects (FV: 35.04±9.34; 95% CI: 29.52–40.56) was increased compared to normal subjects (P<0.001). FV of the region outside the two-degree margin surrounding CNV (FV: 19.61±6.08, 95% CI: 16.02–23.20) was increased compared to age-similar controls (P=0.0002). In neovascular AMD eyes, FV was greater within two degrees of the margin of CNV than in the remainder of the macula (margin: 35.04±9.34; outside: 19.61±6.08; P=0.002), and CNV lesion area was positively correlated with FV (correlation coefficient =0.84; 95% CI: 0.49–0.96; P=0.001).
Conclusion
Choriocapillaris flow deficits were significantly greater in wet AMD subjects than age-similar normal subjects, suggesting that choroidal hypo-perfusion likely plays a role in the pathogenesis of neovascular AMD. Recognition of choriocapillaris flow deficits in patients with AMD may facilitate earlier diagnosis and identify alternative therapeutic targets for this multifactorial disease.
Keywords:
Introduction
Blood to the outer retina and retinal pigmented epithelium (RPE) is supplied by choroidal vasculature. The highly vascular choroid is composed of outer layers of larger blood vessels, as well as a thin sheet-like meshwork of capillaries, the choriocapillaris, that lies subjacent to Bruch’s membrane. The choriocapillaris supports the metabolic needs of the RPE and outer retina; in return, the RPE produces various angiogenic factors, including vascular endothelial growth factor (VEGF), and antiangiogenic factors (eg, pigment epithelial growth factor and endostatin) that maintain and regulate the growth of choroidal vasculature.Citation1–Citation6
Because fine details of the choriocapillaris are difficult to visualize with dye-based angiographic methods, investigation of the choriocapillaris in AMD largely has relied on histological methods. Seddon et al studied 13 eyes collected postmortem with neovascular AMD using Ulex europaeus agglutin to label choroidal endothelial cells.Citation7 Their histopathological examination demonstrated choriocapillaris attenuation at the margins of CNV that extended well beyond the borders of the CNV: compared to control subjects, there was 38.2% loss of vascular area adjacent to CNV in AMD eyes.Citation7 In addition, choriocapillaris atrophy was identified in areas of intact RPE suggesting that choriocapillaris loss may precede RPE changes in neovascular AMD.
Optical coherence tomography angiography (OCTA) is a recently developed technology that provides non-invasive, high resolution, in vivo imaging of the choriocapillaris.Citation8–Citation16 Currently, spectral domain (SD) and swept-source (SS) OCTA can be used to image the retinal and choroidal vasculature.Citation17–Citation19 One challenge of using OCTA is the signal loss that can occur as light is partially scattered by overlying drusen and the pigmented RPE. SS-OCTA is advantageous over SD-OCTA because it utilizes a longer wavelength of light that can more readily penetrate the RPE to produce higher resolution images of the underlying choriocapillaris layer.Citation9,Citation20
Several studies have used OCTA to evaluate choriocapillaris perfusion in eyes with CNV secondary to AMD. Using SD-OCTA, Coscas et al qualitatively evaluated 80 eyes with CNV secondary to neovascular AMD and found that 65 eyes (81.2%) displayed a perilesional hypointense halo around CNV, interpreted as regions of choriocapillaris hypoperfusion or localized atrophy.Citation21 This finding is consistent with prior OCTA studies by Jia et al and Moult et al that also identified areas of choriocapillaris alteration adjacent to CNV in neovascular AMD.Citation22,Citation23 Other investigators have quantitatively evaluated choriocapillaris hypoperfusion, or “flow voids” (FV), in OCT angiograms of patients with advanced AMD.Citation24–Citation26 Treister et al utilized a thresholding method with OCTA to quantify choriocapillaris FV adjacent to CNV in subjects with exudative AMD.Citation27 Triester found choroidal hypoperfusion to be significantly higher within a 200 µm “halo” surrounding CNV compared to the entire 3×3 mm slab, and their results suggested a trend for greater FV in eyes with exudative AMD when compared to their fellow eyes with subclinical CNV. Zhang et al proposed a method for quantifying choriocapillaris FV using SS-OCTA that utilizes structural information to compensate signal loss caused by the RPE/BM complex.Citation24 Good repeatability of the method was shown in normal eyes and eyes with drusen.
Using the methods developed by Zhang et al and SS-OCTA (PLEX® Elite 9000, Carl Zeiss Meditec, Inc., Dublin, CA), we quantified choriocapillaris perfusion defects adjacent to CNV and throughout a 6×6 mm macular region in subjects with CNV secondary to AMD and compared the results to age-similar normal subjects.
Materials and methods
Subjects
Subjects were recruited at the University of California, San Francisco (UCSF) Retina Clinic. Institutional Review Board (IRB)/Ethics Committee approval was obtained. Written informed consent was obtained from all subjects prior to performing any study procedures. The study was performed in accordance with the tenets of the Declaration of Helsinki and compliant with the Health Insurance Portability and Accountability Act.
There were two groups of subjects: 1) subjects diagnosed with neovascular AMD in at least one eye; 2) age-similar controls without AMD or other retinal diseases. Inclusion criteria for both groups were subjects at least 18 years of age, must speak and understand English to give informed consent, sufficiently clear ocular media for OCTA imaging, and dilate to at least 6 mm. Exclusion criteria for both groups were any patients unwilling to participate or provide informed consent, presence of ocular media opacities that prevented clear evaluation of the fundus by OCTA, history of diabetic retinopathy or high myopia (greater than 6 diopters) in either eye.
OCTA image acquisition
This study utilized an SS-OCTA system (PLEX® Elite 9000, Carl Zeiss Meditec, Inc., Dublin, CA), running at a speed of 100 kHz, ie, 100,000 A-scans per second, and a central wavelength of 1060 nm. A scan protocol with a field of view (FoV) of 6x6-mm centered on the fovea was used for all subjects. The scan contained 500 A-scans x 500 locations with 2 repeated scans at each location, giving a spatial sampling resolution of 12 µm (ie, digital transverse resolution). Scanning depth was 3 mm over 1536 pixels. The FastTracTM motion correction software was used during the imaging of all subjects. The complex optical microangiography (OMAGc) algorithm was used to generate OCTA images. OMAGc identifies differences in intensity and phase information between B-scans repeated at the same location to produce the motion signal, an indication of blood flow.Citation20,Citation28
To identify relevant retinal layers, a validated semi-automated segmentation algorithm was applied to the OCTA images, and segmentation accuracy was ensured by manual corrections as needed.Citation29 The outer retina to choriocapillaris (ORCC) slab, defined by a layer extending from the outer boundary of the outer plexiform layer to 8 µm beneath Bruch’s membrane (BM), was used to visualize and quantify the CNV lesion. We also evaluated en face images of the choriocapillaris for FV segmentation ( and ). The choriocapillaris slab was defined by a layer beginning at the outer boundary of BM and extending to approximately 20 µm below BM. Images were excluded from this study if there were significant motion or shadowing artifacts, if signal strength was less than 7 as defined by the manufacturer or if scans revealed signs of geography atrophy or other macular pathologies. To reduce the variability of the signal strength among the subjects, all the images were normalized to the signal strength of nine before the OCTA maps were processed.Citation30
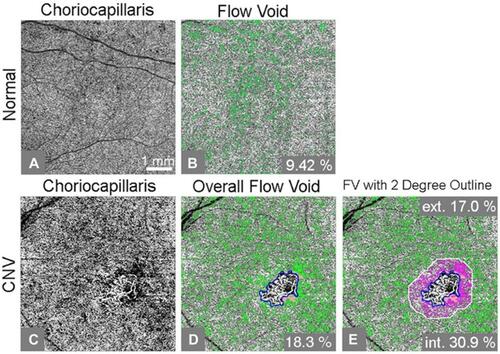
Figure 1 An example of flow void analysis of a swept-source optical coherence tomography (SS-OCT) angiogram from an age-similar normal control (A-B) and choroidal neovascularization (CNV) subject (C-E). (A) Compensated flow choriocapillaris image; (B) Choriocapillaris flow void, or flow lower than 1 standard deviation below the normal mean, is shown as green pixels, accounting for 9.42% of the scanned area; (C) Compensated flow choriocapillaris image; (D) Percent flow void excluding CNV (outlined in blue) and drusen regions (green color represents flow voids; orange color adjacent to CNV represents excluded drusen regions); (E) Percent flow void inside and outside the two-degree margin immediately bordering the CNV lesion. Corresponding flow void percentages for the two-degree margin and remaining scanned area are included (pink color represents flow voids inside the two-degree margin, orange represents drusen, and green color represents flow voids outside of the two-degree margin). Ext. and int. represent outside and inside of the two-degree bordering region, respectively.
Identification of CNV and drusen
An automated algorithm was used to outline and quantify the CNV lesion size from the ORCC en face OCTA images.Citation17 To improve visualization of the CNV, projection artifacts caused by the overlying retinal blood vessels were removed using an artifact removal algorithm.Citation31 The contrast of the artifact-free images was enhanced using an adaptive thresholding method, and noise was removed with a low-pass filter through a convolution operation. Otsu’s adaptive threshold method was applied to produce a binary image, and the CNV border was identified by morphological dilation followed by the Canny edge detection.Citation32,Citation33 Measurement of CNV lesions sizes was calculated by summing the areas of the pixels within the region bound by the border outline.Citation17 CNV area was expressed as squared millimeters. The CNV border outlines were superimposed onto the en face choriocapillaris images, and regions of choriocapillaris underlying CNV were excluded from FV analysis. A two-degree region bordering the CNV lesions was added for our assessment of FV distribution.
Drusen deposits may cause false-positive signals of flow impairment due to shadowing artifacts.Citation34 We applied the same strategy as Zhang et al to eliminate the shadowing effect on FV quantification.Citation24 An additional segmentation layer from the RPE to BM was isolated from the structural dataset to create a drusen map. The drusen maps were then applied to the en face choriocapillaris images, and choriocapillaris regions underlying drusen were excluded from further FV analysis.
Evaluation of choriocapillaris FVs
Choriocapillaris FVs were assessed using a thresholding method where pixel density less than 1 standard deviation (SD) below the mean obtained from a database of 20 normal controls aged from 20–30s was considered a flow deficit.Citation24 The percentage of FV was calculated as the area with FVs or absent flow divided by the total area scanned. In the present study, the total scanned region included the 6×6 mm image excluding regions of choriocapillaris underlying CNV or drusen deposits. A compensation method was used to account for signal attenuation caused by the structural changes in the RPE/BM complex. An FV image was created where green pixels identify locations with FV, defined as flow lower than 1 standard deviation below the normal mean ( and ).
An additional image was analyzed to compare FV at the margin of CNV lesions versus the remainder of the 6×6 mm macular image. A two-degree line bordering the CNV lesion was applied as described in the previous section. Percent FV was analyzed separately for the two-degree regions immediately inside and outside the CNV lesion (). Pink identifies regions of FV within the two-degree border. Green identifies FV in the region beyond the two-degree border.
Statistical analysis
A linear regression method with standard errors clustered by patient was used to compare choriocapillaris FV in CNV subjects and age-similar normal controls. The quantitative results were expressed as mean values±SD and included 95% confidence intervals. Student's t-tests and paired t-tests were performed. For all analyses, P-values <0.05 were considered statistically significant. Due to the small numbers, Wilcoxon rank-sum test was run for some analyses as a sensitivity analysis.
Results
Eleven CNV subjects (11 eyes) and 11 age-similar normal controls (11 eyes) were imaged and analyzed. The mean age of the CNV subjects was 82.8±7.6 years (range 74–88 years) and age-similar controls was 83.0±4.3 years (range 74–88 years). The mean number of anti-VEGF injections patients had received was 7 (range 4–14 injections). The mean area of the CNV lesion was 3.34±3.95 mm2.
demonstrates FV analysis of en face angiograms for three exemplary CNV cases. Our analysis measured more extensive choriocapillaris FV in the 6×6 mm imaged macular region of eyes with CNV compared to age-similar normal controls (FV: 20.56±4.95, 95% CI: 17.64–23.49 and FV: 10.95±2.08, 95% CI: 9.73–12.18, respectively; P=0.0001). There was a correlation between the overall FV percentage and CNV size (rho =0.84, 95% CI 0.49–0.96, P=0.001). There was no significant correlation between overall FV percentage and the number of anti-VEGF injections subjects had received (rho=−0.22, P=0.51).
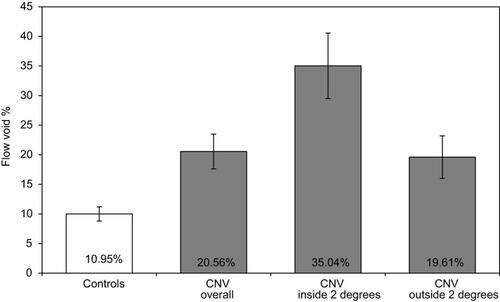
When comparing the mean FV of the regions inside versus outside the applied two-degree outline, our analysis revealed more extensive FV within the two-degree margin bordering CNV compared to the remainder of the macula outside this margin (FV: 35.04±9.34% CI: 29.52–40.56 and 19.61±6.08, 95% CI: 16.02–23.20, respectively; P=0.002) (). The average difference in FV percentage between the margin and the outer region was 15.42±11.93%. When compared to age-similar controls, both the margin and outer region had increased FV (P=0.0001 and P=0.0001).
Figure 2 Three example cases of flow void analysis on swept-source optical coherence tomography (SS-OCT) angiograms of eyes with choroidal neovascularization (CNV) secondary to neovascular age-related macular degeneration. (A-C) Compensated en face flow choriocapillaris image; (D-F) Segmented flow voids of the overall image (green color represents flow voids; light pink color represents excluded drusen regions). (G-I) The same segmented flow voids as in (D-F) but flow voids within a two-degree bordering region are colored as magenta color. The light pink color indicates the regions of drusen. Ext. and int. represent outside and inside of the two-degree bordering region, respectively. The flow void percentage numbers are displayed in individual images.
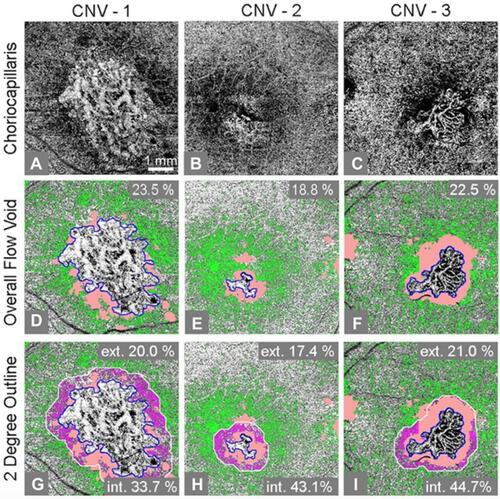
Figure 3 Mean flow void percentages for age-similar controls and choroidal neovascularization (CNV) subjects. Mean flow void percentages for age-similar controls and CNV subjects with 95% confidence interval error bars (P<0.001). Mean flow void percentages of CNV subjects are shown for three regions: overall posterior pole, inside a two-degree outline surrounding CNV, and outside the two-degree bordering region.
Discussion
Our analysis of SS-OCT angiograms reveals that subjects with neovascular AMD have more extensive choriocapillaris perfusion deficits throughout the 6×6 mm macular region than age-similar normal subjects. The density of perfusion deficits is greater in regions within two degrees of the margin of CNV compared to the remainder of the posterior pole beyond the two-degree margin; however, both the inner and outer regions have increased flow deficits compared to normal controls. We also measured a positive correlation between the extent of flow deficits and the area of the CNV lesions. There was no correlation between FV percentage and the number of anti-VEGF injections patients had received.
The use of OCTA has enabled in vivo imaging of the choriocapillaris and the development of novel methods to quantify choriocapillaris FVs in subjects with various underlying conditions.Citation24–Citation26 OCTA systems utilize the dynamic nature of blood flow within functioning choriocapillaris blood vessels to produce in vivo images of the capillary network.Citation24,Citation28,Citation35,Citation36 The presence of FV does not allow differentiation of atrophic choriocapillaris vessels from vessels with blood flow that is slower than the device’s sensitivity.Citation35 Despite this limitation, OCTA remains a promising new technology for non-invasive assessment of choriocapillaris flow deficits.
Using OCTA, several studies have evaluated the changes in choriocapillaris perfusion surrounding CNV in patients with exudative AMD.Citation37 Coscas et al qualitatively identified a perilesional hypointense ring around CNV in 65 out of 80 eyes evaluated with CNV secondary to neovascular AMD.Citation21 This finding agrees with other reports of an observed “dark halo” or hypoperfused ring surrounding CNV lesions in patients with exudative AMD imaged by OCTA.Citation22,Citation23,Citation38 Other studies have quantitatively assessed choriocapillaris perfusion in OCT angiograms of patients with advanced AMD.Citation24–Citation27,Citation39 Treister et al quantified choriocapillaris FV adjacent to CNV lesions using a thresholding method and found choroidal hypoperfusion to be significantly higher adjacent to CNV compared to the entire 3×3 mm image.Citation27 Borelli et al used 3×3 mm scans to quantify the percent nonperfused choriocapillaris area in patients with unilateral Type 3 CNV secondary to exudative AMD and identified an increased percent nonperfused choriocapillaris area compared to the fellow eyes with nonneovascular AMD. Moreover, the percent nonperfused choriocapillaris area and average FV size in the nonneovascular AMD fellow eyes of patients with type 3 CNV were increased compared to the fellow eyes of patients with Type 1 or Type 2 CNV.Citation39
Our finding of increased flow deficits within a two-degree margin surrounding CNV agrees with previous OCTA studies; however, our study differs in several aspects from previous attempts to quantify choriocapillaris hypoperfusion in patients with neovascular AMD. Using SS-OCTA, our study adds to previous investigations by quantifying choriocapillaris flow deficits in 6×6 mm scans that encompass the entire macular region; furthermore, in contrast to previous reports, we compare these values to FVs in a control group of age-similar normal subjects without AMD. The analysis is strengthened by an automated compensation algorithm that compensates signal attenuation caused by elevations in the RPE/BM complex and removes projection artifacts to improve the quality of the images. The exclusion of choriocapillaris underlying drusen additionally helps to eliminate false FV signals caused by shadowing. While previous reports used individual local thresholding for FV segmentation, our study applies a thresholding method set by a database of normal subjects.Citation25,Citation26 These methods comprise a novel strategy for quantifying choriocapillaris hypoperfusion that is proven to have high repeatability.Citation24 Moreover, we show that the extent of FV is proportional to CNV area.
Several histopathologic studies of neovascular AMD demonstrated choriocapillaris dropout in the absence of overlying RPE atrophy, suggesting that choriocapillaris degeneration may precede RPE loss in these patients.Citation2,Citation3,Citation7,Citation40 Since the RPE relies on choroidal vasculature for metabolic exchange, it is hypothesized that CNV lesions develop in regions of choriocapillaris impairment to compensate for the reduced blood flow.Citation22,Citation23,Citation41 In this regard, choriocapillaris hypoperfusion revealed by OCTA is intriguing because hypoxia is a driving mechanism for RPE cell secretion of hypoxia-inducible factor-1 (HIF-1), a key signaling protein for many angiogenic factors, which may contribute to the development of CNV in regions with reduced choriocapillaris perfusion.Citation42–Citation45
In summary, choroidal hypoperfusion may play a role in the development of neovascular AMD. Recognition of choriocapillaris perfusion defects by OCTA may provide valuable information on AMD pathogenesis and suggest novel therapeutic approaches to this multifactorial disease.
Acknowledgments
This work was supported by the National Institutes of Health (EY002162, EY024239, EY24158), Food and Drug Administration (R01-41001), L.L. Hillblom Foundation Research Network Grant, That Man May See, Inc., Foundation Fighting Blindness, Research to Prevent Blindness, Bernard A. Newcomb Macular Degeneration Fund, Hope for Vision, Beckman Initiative for Macular Research (1201), Claire Giannini Fund, Hedco Foundation, Pritzker Foundation, and Advanced Retina Imaging Network.
Disclosure
Qinqin Zang: University of Washington (Patent). Ruikang K Wang: University of Washington (Patent), Oregon Health & Science University (Patent). Ruikang K Wang reports grants, non-financial support from Carl Zeiss Meditec Inc., and National Eye Institute, during the conduct of the study. Ruikang K Wang also reports grants, non-financial support from Moptim Inc, outside the submitted work. Ruikang K Wang has a patent OCTA licensed to Moptim Inc, a patent OCTA licensed to Carl Zeiss Meditec and a patent OCTA with royalties paid to Kowa Inc. Jacque L Duncan reports personal fees from AGTC, Spark Therapeutics, SparingVision, Editas, Okustim, Ocucyte, Ionis, Novelion, jCyte and ProQR Therapeutics, outside the submitted work. Jacque L Duncan also reports grants from Second Sight Medical Products, Allergan, NightstaRx and non-financial support from Neurotech, Inc. Daniel M Schwartz is a stockholder in Varocto, Inc. Daniel M Schwartz has a patent US 7,995,814 issued and a patent US 8,369,594 issued. The authors report no other conflicts of interest in this work.
References
- Wybar KC. A study of the choroidal circulation of the eye in man. J Anat. 1954;88(1):94–98.
- Bhutto I, Lutty G. Understanding age-related macular degeneration (AMD): relationships between the photoreceptor/retinal pigment epithelium/Bruch’s membrane/choriocapillaris complex. Mol Aspects Med. 2012;33(4):295–317. doi:10.1016/j.mam.2012.04.005
- McLeod DS, Grebe R, Bhutto I, Merges C, Baba T, Lutty GA. Relationship between RPE and choriocapillaris in age-related macular degeneration. Invest Ophthalmol Vis Sci. 2009;50(10):4982–4991. doi:10.1167/iovs.09-3639
- Marneros AG, Fan J, Yokoyama Y, et al. Vascular endothelial growth factor expression in the retinal pigment epithelium is essential for choriocapillaris development and visual function. Am J Pathol. 2005;167(5):1451–1459. doi:10.1016/S0002-9440(10)61231-X
- Schlingemann RO. Role of growth factors and the wound healing response in age-related macular degeneration. Graefe’s Arch Clin Exp Ophthalmol. 2004;242:91–101. doi:10.1007/s00417-003-0828-0
- Simó R, Villarroel M, Corraliza L, Hernández C, Garcia-Ramírez M. The retinal pigment epithelium: something more than a constituent of the blood-retinal barrier–implications for the pathogenesis of diabetic retinopathy. J Biomed Biotechnol. 2010;2010:190724. doi:10.1155/2010/190724
- Seddon JM, McLeod DS, Bhutto IA, et al. Histopathological insights into choroidal vascular loss in clinically documented cases of age-related macular degeneration. JAMA Ophthalmol. 2016;134(11):1272–1280. doi:10.1001/jamaophthalmol.2016.3519
- Schwartz DM, Fingler J, Kim DY, et al. Phase-contrast optical coherence tomography: a new technique for non-invasive angiography. Ophthalmology. 2014;121(1):180–187. doi:10.1016/j.ophtha.2013.09.002
- Kim DY, Fingler J, Zawadzki RJ, et al. Optical imaging of the chorioretinal vasculature in the living human eye. Proc Natl Acad Sci U S A. 2013;110(35):14354–14359. doi:10.1073/pnas.1307315110
- Choi W, Mohler KJ, Potsaid B, et al. Choriocapillaris and choroidal microvasculature imaging with ultrahigh speed OCT angiography. PLoS One. 2013;8(12):e81499. doi:10.1371/journal.pone.0081499
- Miere A, Oubraham H, Amoroso F, et al. Optical coherence tomography angiography to distinguish changes of choroidal neovascularization after anti-VEGF therapy: monthly loading dose versus pro re nata regimen. J Ophthalmol. 2018;2018:3751702. doi:10.1155/2018/3751702
- Uji A, Balasubramanian S, Lei J, Baghdasaryan E, Al-Sheikh M, Sadda SR. Choriocapillaris imaging using multiple en face optical coherence tomography angiography image averaging. JAMA Ophthalmol. 2017;135(11):1197–1204. doi:10.1001/jamaophthalmol.2017.3904
- Montesano G, Allegrini D, Colombo L, Rossetti LM, Pece A. Features of the normal choriocapillaris with OCT-angiography: density estimation and textural properties. PLoS One. 2017;12(10):e0185256. doi:10.1371/journal.pone.0185256
- Rezaei KA, Zhang Q, Chen C-L, et al. Retinal and choroidal vascular features in patients with retinitis pigmentosa imaged by OCT based microangiography. Graefes Arch Clin Exp Ophthalmol. 2017;255:1287–1295. doi:10.1007/s00417-017-3633-x
- Sweeney AR, Zhang Q, Wang RK, Rezaei KA. Optical coherence tomography microangiography imaging of circumscribed choroidal hemangioma. Ophthalmic Surg Lasers Imaging Retina. 2018;49(2):134–137. doi:10.3928/23258160-20180129-09
- Novais EA, Adhi M, Moult EM, et al. Choroidal neovascularization analyzed on ultra-high speed swept source optical coherence tomography angiography compared to spectral domain optical coherence tomography angiography. Am J Ophthalmol. 2016;164:80–88. doi:10.1016/j.ajo.2016.01.011
- Zhang Q, Chen CL, Chu Z, et al. Automated quantitation of choroidal neovascularization: a comparison study between spectral domain and swept-source OCT angiograms. Invest Ophthalmol Vis Sci. 2017;58(3):1506–1513. doi:10.1167/iovs.16-20977
- Miller AR, Roisman L, Zhang Q, et al. Comparison between spectral-domain and swept-source optical coherence tomography angiographic imaging of choroidal neovascularization. Invest Ophth Vis Sci. 2017;58(3):1499–1505. doi:10.1167/iovs.16-20969
- Copete S, Flores-Moreno I, Montero JA, Duker JS, Ruiz-Moreno JM. Direct comparison of spectral-domain and swept-source OCT in the measurement of choroidal thickness in normal eyes. Br J Ophthalmol. 2014;98:334–338. doi:10.1136/bjophthalmol-2013-303904
- An L, Subhush HM, Wilson DJ, Wang RK. High-resolution wide-field imaging of retinal and choroidal blood perfusion with optical microangiography. J Biomed Opt. 2010;15:026011. doi:10.1117/1.3369811
- Coscas GJ, Lupidi M, Coscas F, Cagini C, Souied EH. Optical coherence tomography angiography versus traditional multimodal imaging in assessing the activity of neovascular age-related macular degeneration: A new diagnostic challenge. Retina. 2015;35:2219–2228. doi:10.1097/IAE.0000000000000766
- Moult E, Choi W, Waheed NK, et al. Ultrahigh-speed swept-source OCT angiography in neovascular AMD. Ophthalmic Surg Lasers Imaging Retina. 2014;45(6):496–505. doi:10.3928/23258160-20141118-03
- Jia Y, Bailey ST, Wilson DJ, et al. Quantitative optical coherence tomography angiography of choroidal neovascularization in age-related macular degeneration. Ophthalmology. 2014;121(7):1435–1444. doi:10.1016/j.ophtha.2014.01.034
- Zhang Q, Zheng F, Motulsky EH, et al. A novel strategy for quantifying choriocapillaris flow voids using swept-source OCT angiography. Invest Ophthalmol Vis Sci. 2018;59(1):203–211. doi:10.1167/iovs.17-22953
- Spaide RF. Choriocapillaris flow features follow a power law distribution: implications for characterization and mechanisms of disease progression. Am J Ophthalmol. 2016;170:58–67. doi:10.1016/j.ajo.2016.07.023
- Nesper PL, Soetikno BT, Fawzi AA. Choriocapillaris nonperfusion is associated with poor visual acuity in eyes with reticular pseudodrusen. Am J Ophthalmol. 2017;174:42–55. doi:10.1016/j.ajo.2016.10.005
- Treister AD, Nesper PL, Fayed AE, Gill MK, Mirza RG, Fawzi AA. Prevalence of subclinical CNV and choriocapillaris nonperfusion in fellow eyes of unilateral exudative AMD on OCT angiography. Transl Vis Sci Technol. 2018;7(5):19. doi:10.1167/tvst.7.5.19
- Wang RK, An L, Francis P, Wilson DJ. Depth-resolved imaging of capillary networks in retina and choroid using ultrahigh sensitive optical microangiography. Opt Lett. 2010;35:1467–1469. doi:10.1364/OL.35.001467
- Yin X, Chao JR, Wang RK. User-guided segmentation for volumetric retinal optical coherence tomography images. J Biomed Opt. 2014;19:086020. doi:10.1117/1.JBO.19.1.015008
- Zhang Q, Zhang A, Lee CS, et al. Projection artifact removal improves visualization and quantitation of macular neovascularization imaged by optical coherence tomography angiography. Ophthalmol Retina. 2017;1(2):124–136. doi:10.1016/j.oret.2016.08.005
- Zhang AQ, Zhang QQ, Wang RK. Minimizing projection artifacts for accurate presentation of choroidal neovascularization in OCT micro-angiography. Biomed Opt Express. 2015;6:4130–4143. doi:10.1364/BOE.6.004130
- Otsu N. A threshold selection method from gray-level histograms. IEEE Trans Syst Man Cybern Syst. 1979;9:62–66. doi:10.1109/TSMC.1979.4310076
- Canny J. A computational approach to edge detection. IEEE Trans Pattern Anal Mach Intell. 1986;8:679–698. doi:10.1109/TPAMI.1986.4767851
- Lane M, Moult EM, Novais EA, et al. Visualizing the choriocapillaris under drusen: comparing 1050-nm swept-source versus 840-nm spectral-domain optical coherence tomography angiography. Invest Ophthalmol Vis Sci. 2016;57:OCT585–OCT590. doi:10.1167/iovs.16-19420
- Choi W, Moult EM, Waheed NK, et al. Ultrahigh speed swept source oct angiography in non-neovascular age-related macular degeneration with geographic atrophy. Ophthalmology. 2015;122(12):2532–2544. doi:10.1016/j.ophtha.2015.08.029
- Told R, Ginner L, Hecht A, et al. Comparative study between a spectral domain and a high-speed single-beam swept source OCTA system for identifying choroidal neovascularization in AMD. Sci Rep. 2016;6:38132. doi:10.1038/srep38132
- Borrelli E, Sarraf D, Freund KB, Sadda SR. OCT angiography and evaluation of the choroid and choroidal vascular disorders. Prog Retin Eye Res. 2018;67:30–55. doi:10.1016/j.preteyeres.2018.07.002
- El Ameen A, Cohen SY, Semoun O, et al. Type 2 neovascularization secondary to age-related macular degeneration imaged by optical coherence tomography angiography. Retina. 2015;35:2212–2218. doi:10.1097/IAE.0000000000000773
- Borrelli E, Souied EH, Freund KB, et al. Reduced choriocapillaris flow in eyes with type 3 neovascularization and age-related macular degeneration. Retina. 2018;38(10):1968–1976. doi:10.1097/IAE.0000000000002198
- McLeod DS, Taomoto M, Otsuji T, Green WR, Sunness JS, Lutty GA. Quantifying changes in RPE and choroidal vasculature in eyes with age-related macular degeneration. Invest Ophthalmol Vis Sci. 2002;43(6):1986–1993.
- Spaide RF, Armstrong D, Browne R. Choroidal neovascularization in age-related macular degeneration—what is the cause? Retina. 2003;23(5):595–614.
- Minchenko A, Salceda S, Bauer T, Caro J. Hypoxia regulatory elements of the human vascular endothelial growth factor gene. Cell Mol Biol Res. 1994;40:35–39.
- Stone J, Itin A, Alon T, et al. Development of retinal vasculature is mediated by hypoxia-induced vascular endothelial growth factor (VEGF) expression by neuroglia. J Neurosci. 1995;15(7):4738–4747.
- Shweiki D, Itin A, Soffer D, Keshet E. Vascular endothelial growth factor induced by hypoxia may mediate hypoxia-initiated angiogenesis. Nature. 1992;359:843–845. doi:10.1038/359843a0
- Forsythe JA, Jiang BH, Iyer NV, et al. Activation of vascular endothelial growth factor gene transcription by hypoxia-inducible factor 1. Mol Cell Biol. 1996;16:4604. doi:10.1128/MCB.16.9.4604