Abstract
Purpose
To evaluate a new method of measuring ocular exposure in the context of a natural blink pattern through analysis of the variables tear film breakup time (TFBUT), interblink interval (IBI), and tear film breakup area (BUA).
Methods
The traditional methodology (Forced-Stare [FS]) measures TFBUT and IBI separately. TFBUT is measured under forced-stare conditions by an examiner using a stopwatch, while IBI is measured as the subject watches television. The new methodology (video capture manual analysis [VCMA]) involves retrospective analysis of video data of fluorescein-stained eyes taken through a slit lamp while the subject watches television, and provides TFBUT and BUA for each IBI during the 1-minute video under natural blink conditions. The FS and VCMA methods were directly compared in the same set of dry-eye subjects. The VCMA method was evaluated for the ability to discriminate between dry-eye subjects and normal subjects. The VCMA method was further evaluated in the dry eye subjects for the ability to detect a treatment effect before, and 10 minutes after, bilateral instillation of an artificial tear solution.
Results
Ten normal subjects and 17 dry-eye subjects were studied. In the dry-eye subjects, the two methods differed with respect to mean TFBUTs (5.82 seconds, FS; 3.98 seconds, VCMA; P = 0.002). The FS variables alone (TFBUT, IBI) were not able to successfully distinguish between the dry-eye and normal subjects, whereas the additional VCMA variables, both derived and observed (BUA, BUA/IBI, breakup rate), were able to successfully distinguish between the dry-eye and normal subjects in a statistically significant fashion. TFBUT (P = 0.034) and BUA/IBI (P = 0.001) were able to distinguish the treatment effect of artificial tears in dry-eye subjects.
Conclusion
The VCMA methodology provides a clinically relevant analysis of tear film stability measured in the context of a natural blink pattern.
Introduction
The ocular surface and its individual components make up the protective barrier between the eye and the outside world. It is regularly challenged by the environment (eg, low humidity, wind exposure, pollutants) as well as disease (eg, autoimmune disease, neurologic disease).Citation1 In response to these challenges, the ocular surface and its components are in a highly dynamic state, constantly adjusting to different environmental and biologic conditions.Citation2 Secretions from the main and accessory lacrimal glands, meibomian glands, and conjunctival goblet cells provide the aqueous, lipid, and mucin components, respectively, of the human tear film.Citation2–Citation7 The tear film serves three main functions: protection of ocular surface epithelial cells from desiccation, nourishment of the epithelium, and optical refraction. Interruption of the fragile homeostasis of the tear film via insufficiencies in either the quality or quantity of its constituents can result in tear-film instability and may lead to surface damage. Such surface damage is often characteristic of the many pathophysiologies of dry-eye disease.
The relationship between the interblink interval (IBI), time between successive blinks, and tear film breakup time (TFBUT), time from the completion of a blink to the appearance of the first dry spot or micelle on the cornea, defines the integrity of the ocular surface.Citation9–Citation13 Accordingly, both IBI and TFBUT are meaningful variables to characterize in efforts to better understand dry eye. As a standard diagnostic test for over 40 years, TFBUT has been traditionally measured during a forced-stare following two directed, complete blinks by an observer with a stopwatch observing the fluorescein-stained ocular surface through a slit lamp.Citation8,Citation9
The ocular protection index (OPI) was developed to capture the nature of the interaction between blinking and TFBUT, and the OPI methodology has been used in numerous observational studies and clinical trials.Citation14–Citation18 The OPI is calculated by dividing the TFBUT by the IBI.Citation8 In a protected state, tear film breakup does not occur prior to the next blink (ie, TFBUT > IBI). Based on this assumption, if the OPI is <1, a patient’s cornea is considered at risk for exposure, resulting in the development or exacerbation of dry-eye signs and symptoms, and if the OPI is ≥1, a patient’s cornea is considered to be protected, presumably resulting in fewer dry-eye signs and symptoms.Citation8
While the use of OPI provides context for determining the clinical relevance of TFBUT, our increased understanding of the complexities of blink physiology and tear film breakup suggests that the traditional (FS) methodology has a number of shortcomings:
Data collected at different times: The TFBUT measurement and the IBI measurement are performed at different times. Blink rate is captured under normal blink conditions as the subject watches video, while TFBUT is measured separately.
Data collected under unnatural physiological conditions: TFBUT is evaluated using the forced-stare technique, which is not representative of the physiological action of an unaltered blink pattern.
Potential confounding factors: The forced-stare may introduce complications such as reflex tearing and increased ocular discomfort. The manual measurement of TFBUT with a stopwatch introduces imprecision and variability. The use of a stopwatch innately introduces human error into the manual measurement of TFBUT as there is an inherent delay between the time the doctor can detect a break and the time the stopwatch is stopped. The blink rate method used (ie, video capture headset and associated software) counts only complete blinks. The inclusion of other types of blinks in the evaluation should yield a more accurate depiction of the degree of protection at the corneal surface. In addition, the use of a single time-measurement provides no information on what occurs after TFBUT, which is the period of corneal affliction.
To address the shortcomings of the traditional (FS) methodology, this paper evaluates an alternative method for the evaluation of ocular surface protection under normal visual conditions. Briefly, the method involves retrospective analysis of video data of fluorescein-stained eyes taken through a slit lamp while the subject watches television. The retrospective analysis provides the area of tear film breakup for each IBI during the 1-minute video. This technique is called video capture manual analysis (VCMA) and is described in more detail below. A study was performed and data are presented that compare the traditional (FS) and new (VCMA) methodologies. We demonstrate the ability of the new (VCMA) method to distinguish between normal and dry-eye subjects and to identify post-treatment changes in dry-eye subjects following the instillation of an artificial tear solution.
Methods
Measurement techniques
provides a list of definitions of variables analyzed.
Table 1 Definitions of variables analyzed
Traditional (FS) method
Primary-gaze blink rate
Blink rate was measured using the IScan™ system (Burlington, MA) which consists of a headset (including a digital micro-camera and an infrared illuminator to track the diameter of the pupil) worn by the patient to noninvasively record blinks. Only complete blinks were counted, defined as >95% of pupil coverage. During the blink-rate evaluation, subjects were isolated and were asked to watch a video. The IBI was calculated by dividing the total number of complete blinks by the total time.
Forced-stare TFBUT
Sodium fluorescein solution (5 μL, 2% preservative-free) was instilled into the inferior conjunctival cul-de-sac of each eye, and the subject was asked to blink several times to mix the fluorescein with their tear film. The subject was then asked to blink twice and then stare without blinking for as long as possible. The examiner monitored the integrity of the tear film through a slit lamp biomicroscope with an 8 mm scanning beam (using an excitation blue filter and a barrier Wratten #12 yellow filter), and measured the time from eye opening to the first appearance of micelles with a stopwatch. The eyes were evaluated sequentially (right [OD], left [OS]). Two measurements were taken and averaged unless the two measurements were both less than 10 seconds and differed by more than 2 seconds, in which case a third measurement was taken and the two closest of the three were averaged.
New (VCMA) method
Video of fluorescein-stained eyes
Sodium fluorescein was instilled as described above. While the subject performed a standard visual task (watching a documentary on television from a 5-foot viewing distance), the eye was recorded using a digital video camera (EYE-CAP IM 900 camera system) at 10× magnification through a slit lamp biomicroscope using an excitation blue filter and a barrier Wratten #12 yellow filter. A minimum of 1 minute of continuous data were recorded for each eye with roughly a 30-second pause between recordings of the two eyes. The eyes were recorded from OD to OS.
Retrospective manual analysis
A retrospective analysis of the data from each eye was performed to generate TFBUT, IBI, and breakup area (BUA) over the 1-minute period. A panel of examiners evaluated the integrity of the tear film and determined IBI and TFBUT by manually stopping the video to note and confirm the time stamp, and record the time of each blink and the first appearance of a micelle within each IBI.
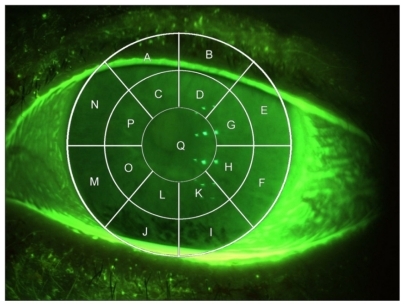
Videos were analyzed for BUA using a corneal transect comprising 17 sections overlaying the cornea (regions A–Q in ). The presence or absence of breakup was graded for each applicable region (transect regions were deemed “not applicable” if they enclosed noncorneal anatomy alone). For example, in , regions M, J, and I show areas of breakup. The BUA (% cornea exposed) in would be calculated as the areas of regions M, J, and I, divided by the total of areas A through Q. If a portion of the region had breakup, the whole area was deemed to have breakup and was included in the calculation of BUA. The total number of regions ranged from 15 to 17 depending on the position of the lids (eg, if the upper lid covered the top two regions, only 15 areas were included).
Figure 1 Corneal transect grid used to score corneal regions.
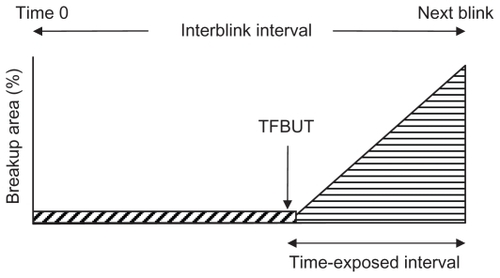
shows an example schematic diagram of the percentage of corneal exposure versus time during a single IBI used to calculate BUA. In this example, the IBI is assumed to follow a partial blink, potentially leaving tear film defects, with the consequence that the initial percentage of area exposed is nonzero as depicted by the diagonal cross hatch area in . At some point during the IBI, the BUA begins to increase, and this defines the TFBUT. The rate of increase between TFBUT and end of the IBI is represented by the slope of the triangular area at the right of . The manual analysis of the video data provided measurements of the percentage cornea exposed at time 0 (immediately following a blink), at the point of increasing BUA (TFBUT), and of the maximum level of tear film breakup at the end of the IBI. Sequences of these three measurements form sequences of schematic diagrams such as that shown in . From each diagram, BUA was calculated, and these were averaged to give mean values for the 1-minute observation period. The units of BUA are (% cornea exposed). The IBI minus the TFBUT represents the “time-exposed interval”, which can be expressed as a fraction of the IBI. The steepness of the increase in BUA after the TFBUT allows analysis of tear film breakup rates.
Figure 2 Schematic diagram of % corneal area exposed versus time during a single interblink interval.
Study design
This single-center, single visit, proof-of-concept pilot study was conducted according to a protocol approved by an external independent review board. Written informed consent was obtained prior to study procedures. Patient-reported and investigator-observed adverse events were captured and monitored for the duration of the study.
This study evaluated both eyes of 10 normal and 17 dry-eye subjects. Enrolled subjects were at least 18 years of age, demonstrated a corrected visual acuity of +0.6 logMAR (logarithm of the minimum angle of resolution) or better in each eye (Early Treatment of Diabetic Retinopathy Study), and were able and willing to avoid ophthalmic medications for 2 hours prior to each study visit. Dry eye subjects were selected based on reported use of artificial tears (no minimum use required). Subjects were excluded from the study if they: wore contact lenses; had any ocular inflammation, ocular infections, active ocular inflammation, or preauricular lymphadenopathy; had any significant illness that could be expected to interfere with the trial parameters; had any known allergy or sensitivity to the test article or its components; had a condition that may have put the subject at significant risk, may have confounded the study results, or may interfere significantly with the subjects participation in the study; or had taken any systemic medications known to cause ocular drying on an unstable dose within 14 days prior to the visit. Smokers were not excluded from the study.
Dry-eye subjects were measured by both the new (VCMA) and traditional (FS) methods, while normal subjects were measured by the new (VCMA) method only. Subjects underwent medical and medication history collection, subject-graded ocular symptom grading, visual acuity, and slit lamp biomicroscopy. After a 5-minute resting period, conjunctival redness based on the Ora scale (0 [none] to 4 [severe]), and corneal sensitivity were measured. After a second 5-minute resting period, primary-gaze blink rate was measured (traditional method IBI). After a third 5-minute resting period, evaluations for the new (VCMA) method comprised TFBUT, IBI, and BUA based on the 1-minute video capture. Additionally, forced-stare TFBUT was evaluated. Evaluations for the traditional (FS) method comprised the previously obtained primary-gaze blink rate and forced-stare TFBUT.
Following these evaluations, dry-eye subjects were treated bilaterally with Refresh Liquigel® (Allergan Inc, Irvine, CA). One to two drops per eye (OD, OS) were instilled by a technician and confirmed by a second technician. Subjects then repeated the aforementioned evaluations 10 (± 1) minutes after artificial tear instillation. For the purpose of this paper, the treatment effect was assessed by the VCMA method only.
In summary, the three paradigms relevant to this paper were as follows. First, traditional and new methods were used to measure the same set of 34 dry eyes prior to treatment. Second, the new method was used to measure 20 normal eyes and 34 dry eyes prior to treatment. Third, the new method was used to measure for the same set of 34 dry eyes before, and 10 minutes after, treatment with artificial tears.
Statistical analysis
For each eye, derived variables were obtained as averages over the 1-minute video period. These outcomes were used to compare groups using a gamma multiplicative model estimated by generalized estimating equation methods. These models provided estimates for group means, ratios of means, 95% confidence intervals, and P-values for a test of the equality of means. All models were fit using the genmod procedure of SAS version 9.2 (SAS Institute, Cary, NC).Citation19
The comparison between dry eye (34 eyes) and normals (20 eyes) was based on 54 eyes in two independent groups. The age-adjusted version of this model was based on a two-factor analysis of covariance structure with interaction, with groups compared at 47 years, the mean age of the sample. A comparison of mean ages for dry-eye and normal subjects was based on a t-test.
Comparisons between traditional (FS) and new (VCMA) methodologies (prior to treatment), as well as between pre-treatment and post-treatment means, were based on the same sample of 34 dry eyes. The correlation between groups was accommodated for via a sandwich variance estimator based on a working independence correlation structure.
Results
The mean ages for the normal (N = 10) and dry-eye (N = 17) subjects were 60.8 and 24.0 years, respectively. Five normal subjects and 14 dry-eye subjects were female.
Comparison of traditional (FS) and new (VCMA) methods
IBI
shows the IBI data from the traditional (FS) and the new (VCMA) methods for the 17 dry-eye subjects. The mean IBIs for the traditional (FS) and new (VCMA) methods were 4.04 and 5.51 seconds, respectively, for a ratio of 1.36 (P = 0.043). shows histograms for both methods and a scatter plot for individual data points.
Figure 3 Interblink interval observations for new (VCMA) and traditional (FS) methods for 17 dry-eye subjects (34 eyes). (A) Observed (yellow) and modeled (blue, lognormal) histogram. (B) Scatter plot of the new versus traditional observations relative to a 45° reference line. Sample means were 5.5 for VCMA and 4.0 for FS.
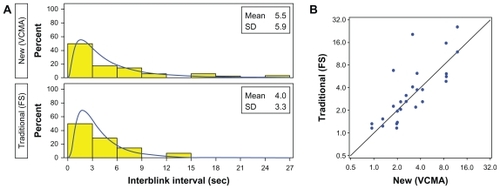
Table 2 Comparison of new (VCMA) and traditional (FS) methods in dry-eye subjects
TFBUT
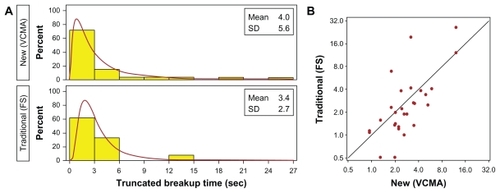
The mean TFBUTs for the traditional (FS) and the new (VCMA) methods were 5.82 and 3.98 seconds, respectively, for a ratio of 0.68 (P = 0.002), reflecting the very different methods used to measure these values. To provide a more meaningful comparison, TFBUTs for the traditional (FS) method were truncated to the corresponding IBI when no TFBUT was observed. This approach gave similar means, with a ratio of 1.18 (P = 0.348). shows histograms of both methods and scatter plots for individual data points. shows the corresponding plots using the truncated TFBUT values for the traditional (FS) method.
Figure 4 Tear film breakup time observations for new (VCMA) and traditional (FS) methods for 17 dry-eye subjects (34 eyes). (A) Observed (yellow) and modeled (green, lognormal) histogram. (B) Scatter plot of the new versus traditional observations relative to a 45° reference line. Sample means were 4.0 for VCMA and 5.8 for FS.
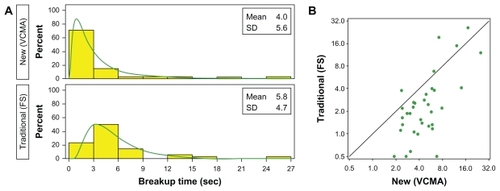
Figure 5 Truncated tear film breakup time observations for new (VCMA) and traditional (FS) methods for 17 dry-eye subjects (34 eyes). (A) Observed (yellow) and modeled (brown, lognormal) histogram. (B) Scatter plot of the new versus traditional observations relative to a 45° reference line. Sample means were 4.0 for VCMA and 3.4 for FS.
Comparison of dry-eye and normal subjects
summarizes group comparisons for dry-eye and normal subjects for all observed variables (IBI, TFBUT, BUA) and derived variables (BUA/IBI, rate). Mean IBIs for the dry-eye and normal groups were 5.51 and 6.82, respectively, for a ratio of 0.81 (P = 0.315). Mean TFBUTs were 3.98 and 5.39, respectively, for a ratio of 0.74 (P = 0.200). Mean BUAs were 10.61 and 3.42, respectively, for a ratio of 3.10 (P = 0.004).
Table 3 Comparison of dry-eye and normal subjects
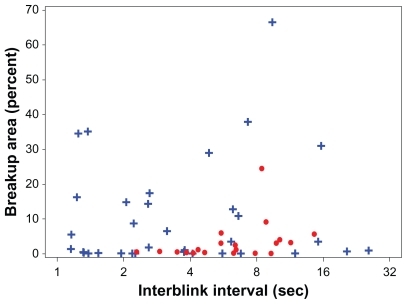
Groups were compared with respect to two new derived outcomes: BUA/IBI and rate of increase in BUA. BUA/IBI (in units of % cornea exposed/second) represents the fraction of corneal surface at risk or exposed. For the dry-eye and normal groups, BUA/IBI means were 3.70 and 0.45, respectively, for a ratio of 8.22 (P < 0.001). shows the relationship between BUA and IBI. Values for normal subjects clustered in the center of the IBI axis, while dry eye subjects were distributed across a wider range of IBI values and displayed elevated BUA values. For the dry-eye and normal groups, the mean rate of increase in BUA was 7.67 and 2.37, respectively, for a ratio of 3.24 (P = 0.001).
Figure 6 The parameter BUA/IBI represents the fraction of the corneal surface that is at risk (exposed); the units are % corneal surface exposed/second. The BUA/IBI data are represented for normal subjects (circles) and dry-eye subjects (crosses).
The above comparisons were based on unadjusted comparisons and thus may be influenced by other differences between the two groups. Indeed, groups did differ with respect to mean age (normal = 24 and dry eye = 60.8, P < 0.001), and for this reason the data were fit using an age- adjusted model. The age-adjusted results were qualitatively similar ().
Table 4 Comparison of dry-eye and normal subjects adjusted for age
Detection of treatment effect
summarizes group comparisons for dry-eye subjects pre- and post-treatment with artificial tears for all observed variables (IBI, TFBUT, BUA) and derived variables (BUA/IBI, rate). Mean IBIs post- and pre-treatment were 7.70 and 5.51, respectively, for a ratio of 1.40 (P = 0.118). Corresponding means for TFBUT were 6.50 and 3.98 (ratio = 1.64, P = 0.034), and for BUAs were 6.75 and 10.61 (ratio = 0.64, P = 0.091). In the case of the derived variables, for the post- and pre-treatment groups, BUA/IBI means were 2.16 and 3.70 (ratio = 0.59, P = 0.001), and for BUAs were 6.75 and 10.61 (ratio = 0.64, P = 0.091). Corresponding mean rates of increase in BUA were 6.89 and 7.67 (ratio = 0.90, P = 0.638). shows BUA versus IBI for the dry-eye subjects pre- and post-instillation of artificial tears. Even though the mean values for BUA and IBI were different, there is no obvious separation of the groups.
Figure 7 Breakup area (% cornea exposed) versus interblink interval (seconds) for 34 dry eyes before (blue crosses) and after (green stars) instillation of artificial tears.
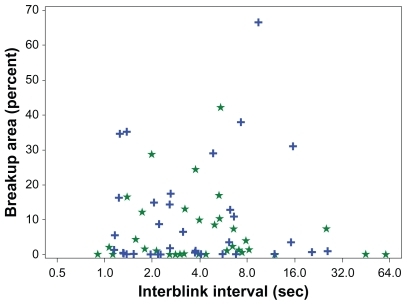
Table 5 Comparison of treatment effect in dry-eye subjects
Discussion
This paper introduces a new method for evaluating ocular surface protection under normal visual conditions and, as such, is more clinically relevant than the traditional (FS) method. A key feature of the new (VCMA) method is that it allows for the simultaneous capture of TFBUT, IBI, and BUA while the subject is blinking normally. While forced-stare TFBUT certainly identifies abnormalities in the tear film of dry-eye subjects relative to normal subjects (as evidenced by over 30 years of reportsCitation9–Citation13), the new VCMA method allows for the simultaneous capture of TFBUT and IBI in the natural setting.
One objective of this study was to compare the traditional (FS) and the new (VCMA) methods. To best understand the advantages of the VCMA method, it is of interest to compare the methods in terms of the traditional (FS) variables: IBI and TFBUT. In the VCMA method, IBI and TFBUT were recorded under natural conditions. In contrast, in the traditional (FS) method, TFBUT is recorded under forced-stare conditions and IBI under natural blink conditions. Despite the fact that IBI was recorded under natural conditions for both methods, the significant difference observed in this study between the IBI values generated by the two methods could reflect the fact that the blink counter equipment used in the FS method only counted complete blinks, whereas the VCMA method counted all blinks. The two methodologies are fundamentally different in the measurement of TFBUT. In the VCMA method, TFBUT is captured in a natural state, while in the FS method, it is not. As a consequence, comparisons of TFBUT between the two methods require that the TFBUT from the traditional (FS) method be truncated at a value equal to the IBI (because in the new VCMA method, TFBUT cannot exceed the IBI). Analysis using the truncated data allows for both methods to be compared in a meaningful way.
A second objective of this study was to compare dry eye and normal subjects. In this study, as expected, dry eye subjects had lower IBIs and TFBUTs than normal subjects, although neither difference was statistically significant. However, BUA, BUA/IBI, and the rate of increase of BUA were significantly different between the dry-eye and normal subjects, indicating the diagnostic utility of these new variables. It appears that some dry-eye subjects compensate for tear film instability and ocular surface discomfort by blinking more rapidly, thus avoiding elevated levels of BUA. The value of the derived variables in the VCMA method, in particular BUA/IBI, is the ability to identify both compensating and noncompensating subjects. We note that differences in BUA and rate between dry-eye subjects and normal subjects have been reported elsewhere, but these authors collected the TFBUT and BUA data under forced-stare conditions.Citation20,Citation21 While we acknowledge that the age difference between the groups may be a potential limitation of this study, an age-adjusted analysis of the data provided qualitatively similar results.
The final objective of this study was to compare the effect of treatment with artificial tears in dry-eye subjects. The area variables (BUA, BUA/IBI) were both able to detect a treatment effect. The analysis made possible by the VCMA methodology indicated that the treatment with artificial tears increased TFBUT but had no statistically significant effect on rate of increase in BUA.
One potential limitation of this study involves the corneal transect grid. The corneal grid was chosen, as more precise interpretation of the National Eye Institute scale for inclusion of more detail and to add specificity, although according to the grid method, any breakup in a region is deemed a breakup in the entire region. This may reduce precision and overestimate breakup; however, the use of ratios of breakup means in the analysis should minimize any bias.
In summary, there is clinically relevant value in an analysis based on tear film stability measured in the context of a natural blink pattern. While the traditionally used variables of IBI and TFBUT are useful, the data presented in this paper suggest that BUA is an important additional variable. Furthermore, BUA/IBI illustrates the potential of combining BUA with traditional variables. The manual data analysis used in this study was time consuming but provided the proof of principle. Studies are underway to automate the data collection and analysis process.
Disclosure
The authors report no conflicts of interest in this work.
References
- OuslerGWGomesPJWelchDAbelsonMBMethodologies for the study of ocular surface diseaseOcul Surf2005314315417131019
- RolandoMZierhutMThe ocular surface and tear film and their dysfunction in dry eye diseaseSurv Ophthalmol200145Suppl 2S203S21011587144
- RolandoMRefojoMFKenyonKRTear water evaporation and eye surface diseasesOphthalmologica198519031471494000640
- NguyenDHBeuermanRWMenerayMAMaitchoukDSensory denervation leads to deregulated protein synthesis in the lacrimal glandAdv Exp Med Biol199843855629634863
- NagyovaBTiffanyJMComponents responsible for the surface tension of human tearsCurr Eye Res199919141110415451
- MishimaSMauriceDMThe oily layer of the tear film and evaporation from the corneal surfaceExp Eye Res19611394514474548
- ChaoCCVergnesJPFreemanILBrownSIBiosynthesis and partial characterization of tear film glycoproteins. Incorporation of radioactive precursors by human lacrimal gland explants in vitroExp Eye Res19803044114256778707
- OuslerGW3rdHagbergKWSchindelarMWelchDAbelsonMBThe ocular protection indexCornea200827550951318520496
- AbelsonMBOuslerGW3rdNallyLAWelchDKrenzerKAlternative reference values for tear film break up time in normal and dry eye populationsAdv Exp Med Biol2002506Pt B1121112512614039
- HollyFJFormation and rupture of the tear filmExp Eye Res19731555155254712544
- LempMABreakup of the tear filmInt Ophthalmol Clin1973131971024724266
- LempMAGoldbergMRoddyMRThe effect of tear substitutes on tear film break-up timeInvest Ophthalmol19751432552581116926
- SmithJNicholsKKBaldwinEKCurrent patterns in the use of diagnostic tests in dry eye evaluationCornea200827665666218580256
- CramptonHJAbelsonMBOuslerGW3rdCorrelation of the controlled adverse environment (CAE) model with a murine model of experimental dry eye in assessing the ability of topical doxycycline to prevent corneal barrier disruptionInvest Ophthalmol Vis Sci200748E-abstract 402
- D’ArienzoPOuslerGW3rdSchindelarMRA comparison of two marketed artificial tears in improvement of tear film stability as measured by tear film break-up time (TFBUT) and ocular protection index (OPI) [Poster presentation]Tear Film and Ocular Surface Society Meeting2007Taormina, Sicily2007
- OuslerGWEmoryTBWelchDAbelsonMBFactors that influence the inter-blink interval (IBI) as measured by the ocular protection index (OPI)Invest Ophthalmol Vis Sci200243E-abstract 56
- Wilcox HagbergKAOuslerGW3rdCasavantJSWelchDAbelsonMBEffects of menopause on the ocular protection index (OPI) in a population of dry eye patients of Ashkenazi Jewish descentInvest Ophthalmol Vis Sci200545E-abstract 79
- OuslerGWMichaelsonCChristensenMTAn evaluation of tear film breakup time extension and ocular protection index scores among three marketed lubricant eye dropsCornea200726894995217721294
- SAS Institute IncSAS OnlineDoc® 9.2Cary, NCSAS Institute Inc2009
- BegleyCGHimebaughNRennerDTear breakup dynamics: a technique for quantifying tear film instabilityOptom Vis Sci2006831152116432468
- LiuHBegleyCGChalmersRWilsonGSrinivasSPWilkinsonJATemporal progression and spatial repeatability of tear breakupOptom Vis Sci2006831072373017041317