 ?Mathematical formulae have been encoded as MathML and are displayed in this HTML version using MathJax in order to improve their display. Uncheck the box to turn MathJax off. This feature requires Javascript. Click on a formula to zoom.
Abstract
Purpose:
We investigated at which corneal region the intraocular pressure as measured by the Icare® rebound tonometer (Finland Oy, Espoo, Finland) (hereinafter referred to as IC) was closest to the intraocular pressure as measured by the Goldmann applanation tonometer (hereinafter referred to as GT). We also investigated which parameters would be best for preparing the most suitable model for predicting GT.
Methods:
A total of 102 normal eyes in 102 subjects were enrolled. IC measurements were carried out at the central, superior, inferior, temporal, and nasal regions of the cornea (ICC, ICS, ICI, ICT, and ICN, respectively), followed by GT calculations. Differences between GT and IC were analyzed using the Bland–Altman method. Stepwise multiple regression analysis was performed using GT as the objective variable, and age, laterality of eye, spherical equivalent refractive error, corneal radius, axial length, central corneal thickness, GT, ICC, ICS, ICI, ICT, and ICN as the explanatory variables.
Results:
IC was higher than GT at all of the corneal regions, but the region with the least bias was ICC, followed by ICT. In the multiple regression analysis, the following prediction formula was calculated: GT = (0.445 × ICC) + (0.198 × ICN) + 3.022. When ICC was excluded from the explanatory variables, ICT had the highest partial correlation coefficient with GT.
Conclusion:
ICC was closest to GT, but GT could be explained better by adding ICN to the prediction model. Moreover, in instances where ICC cannot be calculated or where reliability is clearly poor due to abnormal ocular rigidity, ICT was the closest to GT measured in the central corneal region.
Introduction
Glaucoma is a disorder that causes serious visual impairment that leads to blindness if not treated appropriately.Citation1 The greatest risk factor associated with the onset and progression of glaucoma is elevation in intraocular pressure (IOP).Citation1 Therefore, the accurate measurement of IOP is extremely important for glaucoma management in patients.
The current gold standard for tonometers in ophthalmological practice is the Goldmann applanation tonometer (GAT).Citation2 However, “IOP as measured by a GAT” (hereinafter referred to as GT) is affected by ocular rigidity.Citation3 Ocular rigidity is defined as the distensibility or resistance to deformation in the ocular coat.Citation3 If the ocular rigidity is abnormal due to abnormal corneal thickness, corneal disease, or ocular surgery, GT measurements will be inaccurate.Citation4 For example, in cases where abnormal ocular rigidity occurs in association with disease or surgery, it is known that GT in the affected area is higher than that in other corneal regions, following corneal calcareous degeneration such as band keratopathy.Citation5 On the other hand, GT in the affected area is lower than that in other corneal regions in the case of keratoconusCitation6 and laser in situ keratomileusis.Citation7
Obtaining accurate GT measurements in eyes with abnormal ocular rigidity is not an easy task. In cases where abnormal ocular rigidity of the central corneal region is encountered, IOP must sometimes be measured in the peripheral corneal regions. However, since the area that applanates cornea is large, 3.06 mm in the case of using a GAT, the measurement might be affected by the ocular rigidity in the central corneal region in no small way when measuring IOP in the peripheral corneal regions. Moreover, obtaining a measurement may be impossible in cases where the measured region contains corneal scarring or sclera.
Icare® (Finland Oy, Espoo, Finland), a recently developed rebound tonometer, makes it possible to measure IOP without anesthesia, and it is portable due to its small size and light weight.Citation8–Citation10 In addition, the diameter of the probe tip that comes into contact with the cornea is extremely small at 1.4 mm,Citation10 making it easy to measure IOP in peripheral corneal regions.
In the present study, we investigated at which corneal regions “IOP measurements using the Icare rebound tonometer” (hereinafter referred to as IC) were closest to GT at the central corneal region. We also investigated which parameters would be best for preparing the most suitable model for predicting GT.
Subjects and methods
A total of 102 eyes in 102 subjects (male/female = 52/50) without any abnormality on ophthalmologic examination, other than refractive error, were studied. Informed consent was obtained from all subjects prior to the study. Niigata University Institutional Review Board approved all methodology. Study methods adhered to the provisions of the Declaration of Helsinki guidelines for research involving human participants.
Spherical equivalent refractive error (D) and corneal radius (mm) were calculated using the KR-8100P autorefractometer (Topcon Corporation, Tokyo, Japan).
IC was measured in the central corneal region (ICC) and four other regions (superior [ICS], inferior [ICI], temporal [ICT], and nasal [ICN]) located about 2 mm from the limbus. Subjects were instructed to look head-on (primary position) for measurement of ICC. For measurement of IC in the peripheral corneal regions on the other hand, subjects were instructed to look contralateral (secondary position) to the measured region. For example, subjects were instructed to look downward when measuring ICS. The peripheral corneal measurements were achieved by having the subjects fixate at the target on the wall. The order of the measurements was random. To investigate the reproducibility of Icare tonometry, an averaged IC (ICC) calculated from six consecutive measurements was obtained three times (from 18 measurements) in the central corneal region. In this study, median ICC was used for all analyses other than calculation of coefficients of variation and intraclass correlation coefficients. In the case of the superior, inferior, temporal and nasal corneal regions, IC was measured only once (from six consecutive measurements) to calculate ICS, ICI, ICT, and ICN, respectively.
GT was then measured in the central corneal region using a GAT (Haag-Streit, Koeniz, Switzerland). Finally, the central corneal thickness and axial length of each study eye were measured using an SP-2000 ultrasound pachymeter (Tomey, Nagoya, Japan) and a UD-6000 ultrasonic A/B scanner biometer (Tomey), respectively.
Coefficients of variation and intraclass correlation coefficients were calculated for the three consecutive measurements of ICC. ICC, ICS, ICI, ICT, and ICN were compared using a mixed model with IC as a fixed factor, and subjects and laterality of eye (right/left = 51/51) as random factors. The Bonferroni method was used for multiple comparison adjustments.
Pearson correlation coefficients were calculated, and a correlation matrix was prepared for the following parameters: age, spherical equivalent refractive error, corneal radius, axial length, central corneal thickness, GT, ICC, ICS, ICI, ICT, and ICN. Differences between GT and IC were analyzed using the Bland–Altman method.
To generate a model for predicting GT, multiple regression analysis was performed by the stepwise procedure, using GT as the objective variable, and age, laterality of eye, spherical equivalent refractive error, corneal radius, axial length, central corneal thickness, GT, ICC, ICS, ICI, ICT, and ICN as explanatory variables. In addition, assuming there will be instances where ICC cannot be calculated or where reliability is clearly poor due to abnormal ocular rigidity, multiple regression analysis was also performed without ICC as an explanatory variable. When an explanatory variable with a variance inflation factor exceeding 10 was present, another model was generated without the explanatory variable.
All statistical analyses were performed using SPSS 17.0 J (SPSS Japan Inc, Tokyo, Japan) and MedCalc version 10.1 (MedCalc Software bvba, Mariakerke, Belgium). A significance level below 5% was considered to be statistically significant.
Results
A summary of the 102 eyes in 102 subjects in the present study is shown in . The average coefficient of variation of ICC was 8.8%. The intraclass correlation coefficient was 0.879.
Table 1 Summary of subjects (n = 102, male/female = 52/50, right eye/left eye = 51/51)
ICS and ICN were significantly higher than ICC (P < 0.001 and P = 0.003, respectively), but there was no difference between any of the other regions. In terms of the correlation matrix of each parameter (), there was a strong positive correlation between GT and each IC. In addition, there was a significant correlation between the corneal radius and the central corneal thickness, and many ICs.
Table 2 Correlation matrix for each parameter
Differences of GT and IC using the Bland–Altman method are shown in . ICs were higher than GT in all of the corneal regions, but the IC with the least bias relative to GT was ICC (), followed by ICT.
Figure 1 Scatter diagram of means and differences between GT and ICC according to the Bland–Altman method.
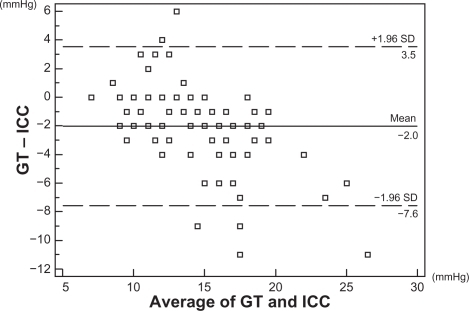
Table 3 DifferencesinintraocularpressuremeasuredbyaGoldmann applanation tonometer and intraocular pressure measured by the Icare® rebound tonometer according to Bland–Altman method
In multiple regression analysis using the stepwise procedure, GT was explained by the following formula:
(1)
When approximated using only ICC, which had the highest coefficient of determination, GT was explained by the following formula:
(2)
When ICC was excluded from the explanatory variables, GT was explained by the following formula:
(3)
When approximated using only ICT, which had the highest coefficient of determination, GT was explained by the following formula:
(4)
Discussion
In the present study, the average of the coefficients of variation of ICC was 8.8%, and the intraclass correlation coefficient was 0.879. These are comparable to the findings (coefficient of variation: 8.9%, intraclass correlation coefficient: 0.73–0.87) reported from a study by Martinez-de-la-Casa et alCitation11 carried out in subjects with glaucoma or ocular hypertension. Therefore, the IC measurements in this investigation have good reproducibility.
In the present study, ICS and ICN were significantly higher than ICC, but there were no differences between any of the other regions. There have been several reports in the past of IOP comparisons in the central and peripheral corneal regions. In a study using a GAT,Citation12 there was no difference in GT between the central corneal region and the peripheral corneal regions. In studies using the Tono-Pen tonometer, no difference in IOP was reported between the central corneal region and peripheral corneal regions in one study,Citation13 while IOP was slightly higher in the temporal corneal region as compared with the central corneal region in another study.Citation14 A past study using Icare reported no difference in IOP between the central corneal region and peripheral corneal regions,Citation15 while ICT was slightly higher than ICC and ICN in another study.Citation16 Thus, with respect to differences in IOP between the central and peripheral corneal regions, the results differ depending on the report. In general, the cornea is thicker in the periphery when compared with the central region.Citation16,Citation17 Therefore, IOP is assumed to be higher in the peripheral corneal regions when compared to the central corneal region.Citation14 Histologically, however, the density of collagen fibers in the peripheral corneal regions is lower than that in the central region,Citation17 making it susceptible to corneal tensility and elasticity during the measurement of IOP.Citation18 Therefore, IOP measurements may be underestimated in the peripheral corneal regions. Moreover, it has been reported that IOP tends to be higher in the secondary position compared with the primary position.Citation19 A combination of several of these factors may have led to the discrepancy between these reports. In addition, many of these reports were of studies that used one-way analysis of variance for the statistical examination, but in the present investigation a mixed model was prepared using subjects’ right and left eyes as random effects, thereby taking into account the effects of the differences between the right and left eyes on IC for comparison of IOP levels between corneal regions in the same cornea.
In the present study, there was a strong positive correlation between GT and IC, with the correlation between GT and ICC being the highest (r = 0.777). In a past report involving healthy subjects,Citation10 the correlation coefficient between GT and ICC was 0.82. In a report involving patients with glaucoma or ocular hypertension,Citation11 the correlation coefficient between GT and ICC was 0.865. The results of the present study are comparable to the results in these reports. In the present study, differences between GT and IC were investigated using the Bland–Altman method, which showed that the bias between GT and ICC was −2.0 mmHg, while that between GT and IC in the other corneal regions was −3.6 to −5.1 mmHg. Overall, these data indicate that IC was higher than GT at all corneal regions. These results are also comparable to a past report of healthy persons (bias (GT – ICC) = −1.94)Citation15 and the results of a study involving patients with glaucoma or ocular hypertension (bias (GT – ICC) = −1.8).Citation11 Based on these results, we concluded that IC correlates well with GT. However, since some differences were seen, some correction was needed to predict GT based on IC.
In the present study, generation of a model for predicting GT using the stepwise procedure, with each IC as well as age, laterality of eye, spherical equivalent refractive error, corneal radius, axial length, and central corneal thickness as explanatory variables, yielded EquationEquation (1)(1) above. ICC had the highest coefficient of determination with GT (= 0.599) and was selected as a significant explanatory variable. Moreover, the coefficient of determination did not decrease much, even when a model was generated with only ICC as an explanatory variable. Although the partial correlation coefficient was low, ICN was also selected as a significant explanatory variable, likely because a GAT was affected more by ocular rigidity in the peripheral cornea compared with Icare, due to the larger corneal contact area during the measurement of IOP. Based on these results, it may be useful to also measure ICN, as well as the ICC, when predicting GT based on IC.
On the other hand, assuming there will be instances where ICC cannot be calculated or where reliability is clearly poor due to abnormal ocular rigidity, multiple regression analysis was also performed without ICC as an explanatory variable. The result was EquationEquation (3)(3) . Here, ICT had the highest coefficient of determination (= 0.360) and was selected as a significant explanatory variable. Moreover, the coefficient of determination did not decrease much even when a model was generated with only ICT as an explanatory variable. Additionally, when we consider the results of the investigation of the differences between GT and IC yielded by the Bland–Altman method, IOP measurements using Icare in the temporal corneal region might be most useful from the standpoint of predicting GT, since bias was the smallest for ICT among IC in the peripheral corneal regions. However, the coefficient of determination is low compared with a GT prediction model that includes ICC as an explanatory variable, and the difference between GT and ICT according to the Bland–Altman method is also larger than that between GT and ICC. Therefore, it is likely inferior to ICC measurements when trying to obtain consistency with GT measurements.
Parameters thought to be related to ocular rigidity such as corneal curvature radius and central corneal thickness were not selected as significant explanatory variables in these prediction models. According to past reports,Citation4,Citation11 corneal curvature radius and central corneal thickness were found to have a significant correlation with GT and ICC, and corneal curvature radius and central corneal thickness were found to have a significant correlation with GT and many ICs in the present study, as well. When generating a multiple regression model using the stepwise procedure, therefore, corneal curvature radius and central corneal thickness were believed to have acted as confounding factors with respect to the objective variable GT and the explanatory variable IC and been removed from the prediction model. Moreover, this revealed that corneal curvature radius and central corneal thickness data are not necessarily required when predicting GT with IC.
IOP decreases when it is measured consecutively with various tonometers, as in the case of IOP measurements by GAT, a phenomenon that was first pointed out during the development of the tonometer.Citation2,Citation20 Significant IOP-lowering effects as a result of consecutive measurements are not seen with Icare, or are less than those associated with consecutive measurements using a GAT.Citation21 In the present study, IOP was measured with Icare before measurement with GAT, in order to partially prevent the IOP-lowering effects associated with consecutive measurements. However, it was reported that an IOP-lowering effect was seen with consecutive measurement of IOP with a rebound tonometer at the animal experiment level.Citation22 In the present study, IOP was measured randomly in each of the corneal regions using Icare, but we cannot rule out the effects of changes in IOP that may have been caused by consecutive measurements.
In conclusion, of the ICs measured in the central or peripheral corneal regions, ICC was the closest to GT. In addition to ICC, GT could be explained better by generating a prediction model using ICN. Moreover, in instances where ICC cannot be calculated or where reliability is clearly poor due to abnormal ocular rigidity, ICT was the closest to GT measured in the central corneal region.
Disclosure
The authors report no conflicts of interest in this work.
References
- Japan Glaucoma SocietyThe Japan glaucoma society guidelines for glaucoma (2nd edition)Nippon Ganka Gakkai Zasshi200611077881417073269
- GoldmannHSchmidtTUber Applanations – TonometrieOphthalmologica195713422124213484216
- DamjiKFMuniRHMungerRMInfluence of corneal variables on accuracy of intraocular pressure measurementJ Glaucoma200312698012567117
- DoughtyMJZamanMLHuman corneal thickness and its impact on intraocular pressure measures: a review and meta-analysis approachSurv Ophthalmol20004436740810734239
- Azuara-BlancoABhojaniTKSarhanARPillaiCTDuaHSTono-Pen determination of intraocular pressure in patients with band keratopathy or glued corneaBr J Ophthalmol1998826346369797663
- BöhmAKohlhaasMLercheRCBischoffBRichardGMeasuring intraocular pressure in keratoconus. Effect of the changed biomechanicsOphthalmologe1997947717749465707
- EmaraBProbstLETingeyDPCorrelation of intraocular pressure and central corneal thickness in normal myopic eyes and after laser in situ keratomileusisJ Cataract Refract Surg199824132013259795845
- KontiolaAA new electromechanical method for measuring intraocular pressureDoc Ophthalmol1996–199793265276
- KontiolaAPuskaPMeasuring intraocular pressure with the Pulsair 3000 and Rebound tonometers in elderly patients without an anestheticGraefes Arch Clin Exp Ophthalmol20042423714634828
- KontiolaAIA new induction-based impact method for measuring intraocular pressureActa Ophthalmol Scand20007814214510794245
- Martinez-de-la-CasaJMGarcia-FeijooJCastilloAGarcia-SanchezJReproducibility and clinical evaluation of rebound tonometryInvest Ophthalmol Vis Sci2005464578458016303951
- WhitacreMMSteinRSources of error with use of Goldmann-type tonometersSurv Ophthalmol1993381308235993
- MokKHWongCSLeeVWTono-Pen tonometer and corneal thicknessEye199913353710396381
- KhanJADavisMGrahamCETrankJWhitacreMMComparison of Oculab Tono-Pen readings obtained from various corneal and scleral locationsArch Ophthalmol1991109144414461929938
- ChuiWSLamAChenDChiuRThe influence of corneal properties on rebound tonometryOphthalmology2008115808417573114
- JorgeJMGonzález-MéijomeJMQueirósAFernandesPParafitaMACorrelations between corneal biomechanical properties measured with the ocular response analyzer and ICare rebound tonometryJ Glaucoma20081744244818794677
- BooteCDennisSNewtonRHPuriHMeekKMCollagen fibrils appear more closely packed in the prepupillary cornea: optical and biomechanical implicationsInvest Ophthalmol Vis Sci2003442941294812824235
- HerndonLWMeasuring intraocular pressure – adjustments for corneal thickness and new technologiesCurr Opin Ophthalmol20061711511916552245
- NardiMBartolomeiMPRomaniABarcaLIntraocular pressure changes in secondary positions of gaze in normal subjects and in restrictive ocular motility disordersGraefes Arch Clin Exp Ophthalmol19882268103342982
- KrakauCEWilkeKOn repeated tonometryActa Ophthalmol (Copenh)1971496116145171572
- DaviesLNBartlettHMallenEAWolffsohnJSClinical evaluation of rebound tonometerActa Ophthalmol Scand20068420620916637838
- MorrisCACrowstonJGLindseyJDDaniasJWeinrebRNComparison of invasive and non-invasive tonometry in the mouseExp Eye Res2006821094109916466714