Abstract
Background
To compare the average values of the American Society of Cataract and Refractive Surgery (ASCRS) and Ocular MD intraocular lens (IOL) calculators to assess their accuracy in predicting IOL power in patients with prior laser-in-situ keratomileusis (LASIK) or photorefractive keratectomy.
Methods
In this retrospective study, data from 21 eyes with previous LASIK or photorefractive keratectomy for myopia and subsequent cataract surgery was used in an IOL calculator comparison. The predicted IOL powers of the Ocular MD SRK/T, Ocular MD Haigis, and ASCRS averages were compared. The Ocular MD average (composed of an average of Ocular MD SRK/T and Ocular MD Haigis) and the all calculator average (composed of an average of Ocular MD SRK/T, Ocular MD Haigis, and ASCRS) were also compared. Primary outcome measures were mean arithmetic and absolute IOL prediction error, variance in mean arithmetic IOL prediction error, and the percentage of eyes within ±0.50 and ±1.00 D.
Results
The Ocular MD SRK/T and Ocular MD Haigis averages produced mean arithmetic IOL prediction errors of 0.57 and −0.61 diopters (D), respectively, which were significantly larger than errors from the ASCRS, Ocular MD, and all calculator averages (0.11, −0.02, and 0.02 D, respectively, all P < 0.05). There was no statistically significant difference between the methods in absolute IOL prediction error, variance, or the percentage of eyes with outcomes within ±0.50 and ±1.00 D.
Conclusion
The ASCRS average was more accurate in predicting IOL power than the Ocular MD SRK/T and Ocular MD Haigis averages alone. Our methods using combinations of these averages which, when compared with the individual averages, showed a trend of decreased mean arithmetic IOL prediction error, mean absolute upper limit of IOL prediction error, and variance, while increasing the percentage of outcomes within ±0.50 D.
Introduction
It is well documented that predicting refractive outcomes after cataract surgery is more difficult in eyes that have undergone laser-in-situ keratomileusis (LASIK) or photorefractive keratectomy than in virgin eyes.Citation1,Citation2 There are numerous methods available to calculate which intraocular lens (IOL) power to use in such patients, but the outcome predictability still falls below that attained in virgin eyes.Citation3
Online IOL calculators are becoming an increasingly popular and efficient way to facilitate the selection of IOL power for surgery. Two commonly used calculators are the American Society of Cataract and Refractive Surgery (ASCRS) post-LASIK/photorefractive keratectomy IOL CalculatorCitation4 and the Ocular MD IOL Calculator.Citation5 The goal of this study was to compare their average values to assess accuracy in estimating IOL power.
Methods
A retrospective chart review was conducted of consecutive patients with previous LASIK or photorefractive keratectomy for myopia and subsequent cataract surgery from April 2006 to April 2011 performed by one surgeon (MM). Cataract surgeries were performed using 2.2 mm temporal clear corneal incisions and the Alcon Infiniti phacoemulsification system (Alcon Laboratories, Fort Worth, TX). A Tecnis ZCB00 (Abbot Medical Optics, Abbott Park, IL), AcrySof IQ SN60WF, or AcrySof SA60AT (both from Alcon Laboratories, Fort Worth, TX) IOL was used for implantation into the capsular bag.
The online ASCRS and Ocular MD calculators both use several formulae to calculate an average IOL power. The ASCRS calculator uses an Aramberri Double-K method modification of the Holladay 1 formula for the majority of IOL power calculations,Citation6 while the Ocular MD calculator utilizes either the corrected SRK/T or Haigis formula for most IOL power calculations.Citation7 The ASCRS and Ocular MD calculators shared the following methods in this study: clinical history, Feiz/Mannis, Corneal Bypass (Walter), Masket, and Shammas. The ASCRS calculator was unique in using the adjusted Atlas 0–3, Modified Masket, Wang-Koch-Maloney, and Haigis-L formulae while only the Ocular MD calculator included the Aramberri double-K, Latkany Flat-K, Latkany Average-K, Koch, and Mannis Normogram formulae.
All data required by the calculators were deemed necessary in order to obtain an accurate average value, with the exception of three values requested from the following machines not used in our preoperative cataract workups, ie, EyeSys 3000 Corneal Atlas System (Eyesys Technologies Inc, Houston, TX), Galilei Topographer (Ziemer Ophthalmic Systems, Port, Switzerland), and Tomey TMS-4 (Tomey Inc, New York, NY). Pre- and post-LASIK/photorefractive keratectomy and pre- and post-cataract surgery manifest refraction, pre- and post-LASIK/photorefractive keratectomy keratometry (K) values, and the IOL implanted in surgery were recorded from patient clinic notes. Precataract surgery K values were recorded from corneal topography readings (Humphrey Atlas, Carl Zeiss Meditec, Dublin, CA). Additionally, precataract surgery K values, axial length, and anterior chamber depth were obtained from IOL Master V.4 measurements (Carl Zeiss Meditec). Exclusion criteria included major complications during or after cataract surgery, missing data for the calculators, or best corrected distance visual acuity < 20/30 after surgery.
Using both online IOL calculators, with standard lens constants and targeting at the actual refraction recorded after cataract surgery, the average predicted IOL power for each calculator was obtained. The ASCRS calculator produces one average value while the Ocular MD calculator produces two average values, ie, one for the SRK/T formula and one for the Haigis formula. In addition to these calculator averages, we created two new averages using combinations of the above values. The Ocular MD average was calculated from the average of Ocular MD SRK/T and Ocular MD Haigis, while the all calculator average was obtained from the average of Ocular MD SRK/T, Ocular MD Haigis, and ASCRS.
The IOL prediction error was then determined by subtracting the predicted IOL power from the power of the IOL implanted.Citation6 Thus, a positive value indicates that method predicts an IOL of less power than the power of the implanted IOL, leaving the patient hyperopic. Conversely, a negative value indicates that the predicted IOL of the method would have resulted in a myopic outcome.
The following results were evaluated for each method studied: mean arithmetic IOL prediction error; mean absolute IOL prediction error; variance in mean arithmetic IOL prediction error (a smaller variance indicates better consistency of IOL prediction with that method; and percentage of eyes within a certain refractive prediction error. Using the assumption that 1.00 diopter (D) of IOL prediction error produces 0.70 D of refractive error at the spectacle plane, the percentage of eyes within a refractive error of ±0.50 (IOL prediction error ±0.71) and within ±1.00 (IOL prediction error ±1.43) were computed for each method.Citation6,Citation8
Statistical analysis
Statistical analysis was performed using STATA Data Analysis and Statistical Software (Release 11. StataCorp LP, College Station, TX). The one-sample t-test was performed to determine whether the mean arithmetic IOL prediction errors were significantly different from zero. Two-sample paired t-tests with equal variances were done to compare the mean arithmetic and absolute IOL prediction errors. The F-test for variance was utilized to compare the consistency of the different prediction values and the McNemar test was used to compare the percentages of eyes ending up within a certain refractive prediction error. The Hochberg correction was applied for multiple tests.
Results
A total of 21 eyes from 17 patients had complete data and were included in the study. Twenty-two eyes were excluded due to lack of biometry (corneal topography, axial length, anterior chamber depth), pre-LASIK data, or post-cataract surgery manifest refraction. Baseline data included a mean age of 62.48 ± 9.55 years, mean pre-LASIK/photorefractive keratectomy spherical equivalent of −5.55 ± 2.50 D, mean pre-LASIK/photorefractive keratectomy K values of 44.04 ± 1.67 D, mean precataract surgery K values of 40.03 ± 2.34 D, mean axial length of 26.10 ± 1.18 mm, and mean postcataract spherical equivalent of −0.56 ± 0.77 D (). Postoperative data was obtained at an average of 5.24 ± 3.39 months after LASIK/photorefractive keratectomy and 2.65 ± 2.68 months after cataract surgery. The Technis ZCB00 lens was used in 15 patients, the ArcySof IQ SN60WF in three patients, and the AcrySof SA60AT in three patients.
Table 1 Patient demographics
The mean arithmetic IOL prediction errors for the ASCRS (0.11 D), Ocular MD (−0.02 D), and all calculator (0.02 D) averages showed increased accuracy when compared with Ocular MD SRK/T (0.57 D) and Ocular MD Haigis (−0.61 D), as shown in and (all P < 0.05). Unlike the other methods, the Ocular MD SRK/T and Ocular MD Haigis mean arithmetic IOL prediction errors were both significantly different from zero (P = 0.002 and P = 0.001, respectively). Although statistical significance was not found due in part to our small sample size, both the Ocular MD average and the all calculator average showed a clear trend of increased accuracy in mean arithmetic and absolute IOL prediction error, variance, and the percentage of eyes within ±0.50 D when compared with the individual averages (ASCRS, Ocular MD SRK/T, and Ocular MD Haigis, see ).
Figure 1 Boxplot of IOL power prediction errors with different methods.
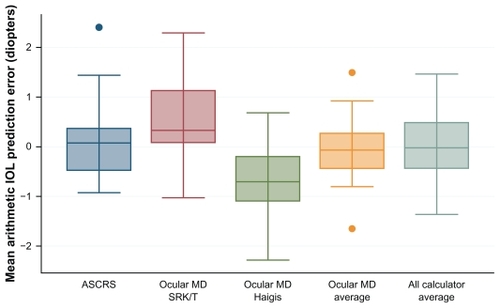
Figure 2 Modified Bland–Altman plots for each method illustrating IOL prediction errors for all 21 patients. The red line represents a mean IOL prediction error of zero, the green lines represent an IOL prediction error of ±0.71 (IOL refractive prediction error ±0.50 diopters), and the blue lines represent an IOL prediction error of ±1.43 (refractive prediction error of ±1.00 diopters). The black lines on each plot represent the mean and two standard deviations for that specific method.
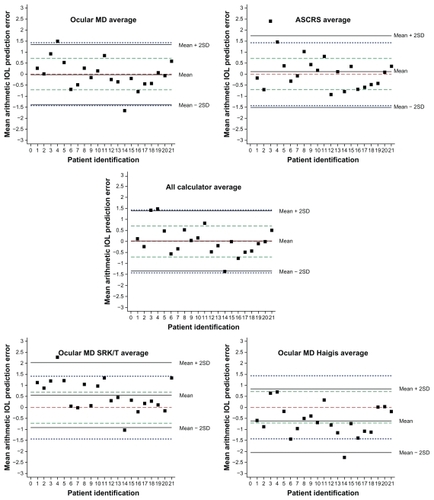
Table 2 Mean arithmetic and absolute IOL prediction errors and ranges, variance of mean arithmetic IOL prediction errors, and percentage of eyes within ±0.50 and ±1.00 diopters (D) for different methods
Discussion
Online IOL calculators facilitate selection of IOL power for use in cataract surgery in patients with prior refractive surgery. The ASCRS calculator uses 11 formulae and produces one average IOL power while the Ocular MD calculator uses 20 methods and produces two average IOL powers, one for SRK/T and one for Haigis formulae. In addition to comparing these three average IOL powers, we also evaluated an average of Ocular MD SRK/T and Ocular MD Haigis (Ocular MD average) and an average of Ocular MD SRK/T, Ocular MD Haigis, and ASCRS (all calculator average).
Important elements to consider when determining accuracy of IOL formulae are mean IOL prediction error, variance in that error, and the percentage of eyes within a certain refractive prediction error. The ideal formula would be one that best combines these different elements.
The averages producing mean arithmetic IOL prediction errors closest to zero were the all calculator average (0.02 D), Ocular MD average (−0.02 D), and ASCRS (0.11 D). There was no statistically significant difference between these three methods, likely due to our small sample size, but certain trends could still be seen. In addition to a slightly higher mean arithmetic IOL prediction error, the ASCRS average also had a higher absolute upper limit of IOL prediction error (2.40 D) than did the Ocular MD average (1.66 D) and all calculator average (1.48 D). This suggests that using the Ocular MD average or all calculator average, instead of the ASCRS average alone, may improve mean arithmetic IOL prediction error, as it moves it closer to zero and lessens the absolute upper limit of error. In addition, a trend can be seen that a smaller variance occurs in the Ocular MD average (0.46) and all calculator average (0.47) than in the ASCRS average (0.66).
Two benchmark standards proposed in 2009 by the British National Health Service are that 55% of routine, virgin cornea cataract surgeries should be within 0.50 D and 85% within 1.00 D of the targeted spherical equivalent.Citation9 The ASCRS, Ocular MD, and all calculator averages met these criteria. Although not statistically significant, our data suggest that in comparison with the ASCRS average alone, using the Ocular MD average or the all calculator average will increase the percentage of outcomes within ±0.50 (71.43%, 76.19%, and 76.19%, respectively) and ±1.00 D (90.48%, 90.48%, and 95.24%, respectively).
Patient satisfaction after cataract surgery is highly dependent upon refractive outcome. Many different individual formulae are being used to optimize this outcome. Instead of using individual formulae, the best result may be obtained by averaging the suggestions of multiple formulae. A previous study of the ASCRS calculator illustrated that in comparison with the individual formulae, an average of eleven formulae used in the calculator had the smallest mean absolute IOL prediction errors, the smallest variance, and the highest percentage of eyes within ±0.50 D of the refractive prediction error.Citation6 Our study also found that averaging different methods provided more accurate results. Even though the ASCRS average produces an acceptable refractive outcome, we found that the all calculator average and Ocular MD average decrease the mean arithmetic IOL prediction error, mean absolute upper limit of IOL prediction error, and variance while increasing the percentage of outcomes within ±0.50 D. Patients with prior laser refractive surgery are among those with the highest satisfaction rates of all elective surgeries. These patients expect similar uncorrected visual acuity results after cataract surgery.Citation10 The all calculator average, followed closely by the Ocular MD average, offers the greatest likelihood of meeting these high expectations.
Limitations to this study include a small sample size, which affected the ability to find statistical significance among comparisons in some categories. Three different IOLs were included in this retrospective study to maximize sample size. We acknowledge these lenses have different optical characteristics that can influence outcomes. However, all lenses used were acrylic monofocal IOLs, and the different A-constants of each lens were taken into account in the calculations. Another limitation to the study was our lack of access to the EyeSys 3000 Corneal Atlas System, Galilei Topographer, and the Tomey TMS-4, which were requested by the ASCRS calculator. This decreased the amount of formulae used to create the ASCRS average from 11, used in the previous ASCRS study,Citation6 to ten in our study. However, many cataract surgeons do not routinely use these three machines, so our results may actually produce an average more representative of what is used in clinical practice.
In summary, our analysis of IOL calculations after myopic LASIK/photorefractive keratectomy indicates that the ASCRS average meets the National Health Service benchmarks for cataract surgery results and outperforms the Ocular MD SRK/T and Ocular MD Haigis averages. However, using combinations of the ASCRS, Ocular MD SRK/T, and Ocular MD Haigis averages has advantages over using the ASCRS average alone. Both the Ocular MD average and all calculator average, when compared with the individual formulae, decrease the mean arithmetic IOL prediction error, mean absolute upper limit of IOL prediction error, and variance while increasing the percentage of outcomes within ±0.50 D. Our suggestion would be to utilize the ASCRS average in combination with the Ocular MD SRK/T and Ocular MD Haigis averages to increase desired outcomes after cataract surgery.
Acknowledgment
Funding for this research was provided by the Research to Prevent Blindness Foundation, New York, NY, USA.
Disclosure
The authors have no financial interests in any materials or products discussed in the work.
References
- SeitzBLangenbucherANguyenNXKusMMKuchleMUnderestimation of intraocular lens power for cataract surgery after myopic photorefractive keratectomyOphthalmology1999106469370210201589
- HamiltonDRHardtenDRCataract surgery in patients with prior refractive surgeryCurr Opin Ophthalmol2003141445312544810
- McCarthyMGavanskiGMPatonKEHollandSPIntraocular lens power calculations after myopic laser refractive surgery: A comparison of methods in 173 eyesOphthalmology2011118594094421131054
- HillWWangLKochDIOL power calculator in post-myopic LASIK/PRK eyes Available from: http://iol.ascrs.orgAccessed June 23, 2011
- GoldsberryDPost-LASIK IOL calculator and database Available from: http://iol.ocularmd.comAccessed 23 June 2011
- WangLHillWEKochDDEvaluation of intraocular lens power prediction methods using the American Society of Cataract and Refractive Surgeons post-keratorefractive intraocular lens power calculatorJ Cataract Refract Surg20103691466147320692556
- GoldsberryDHMajmudarPAThe OcularMD IOL CalculatorCataract & Refractive Surgery Today20072528
- FeizVMannisMJGarcia-FerrerFIntraocular lens power calculation after laser in situ keratomileusis for myopia and hyperopia: a standardized approachCornea200120879279711685053
- GaleRSaldanaMJohnstonRBenchmark standards for refractive outcomes after NHS cataract surgeryEye (Lond)200923114915217721503
- SolomonKDFernandez de CastroLESandovalHPJoint LASIK Study Task ForceLASIK world literature review: quality of life and patient satisfactionOphthalmology2009116469170119344821