
Abstract
Purpose
Risk factors for metabolic syndrome include abdominal obesity, insulin resistance, hypertension, high triglycerides and/or low high-density lipoprotein cholesterol, and hyperglycemia. Risk factors for metabolic syndrome have been associated with dry eye disease; however, their association with meibomian gland disease (MGD), a subtype of dry eye, is unclear. In the present study, we investigated risk factors for metabolic syndrome in a dry eye cohort with and without MGD.
Methods
This retrospective case-control study evaluated electronic medical records at a major urban outpatient medical center to identify patients with a known diagnosis of dry eye disease with and without MGD. Males and females were matched for age, smoking status, race, ethnicity, and body mass index (BMI). Patient demographics, anthropometric measurements, medical history, clinical findings, and serologies were analyzed. A diagnosis of MGD was based on clinical signs noted in the medical record.
Results
MGD was not associated with BMI, smoking, type 2 diabetes mellitus, hypertension or hyperlipidemia in this dry eye cohort. MGD was associated with male sex and increasing age. While increasing age was weakly correlated with decreased low density lipoprotein cholesterol and non-high density lipoprotein cholesterol, serum lipid levels were not associated with MGD.
Conclusion
Importantly, we found that risk factors for metabolic syndrome are not specifically associated with an increase in MGD when compared to non-MGD dry eye subjects. While risk factors for metabolic syndrome are associated with dry eye disease, they likely reflect a chronic systemic state of low-grade inflammation that negatively impacts the function of both lacrimal and meibomian glands.
Introduction
Dry eye disease (DED) is a complex ocular surface inflammatory disease recently defined as
A multifactorial disease of the ocular surface characterized by a loss of homeostasis of the tear film, and accompanied by ocular symptoms, in which tear instability and hyperosmolarity, ocular surface inflammation and damage, and neurosensory abnormalities play etiological roles.Citation1
DED is a major public health issue worldwide and has been identified as the leading reason patients seek eye care among the general population.Citation2 Due to the chronic nature of DED and the lack of effective therapy, the psychological, physical, and financial burden significantly decreases overall quality of life. While the global prevalence of dry eye varies, large epidemiological reports from the Women’s Health Study, the Physician’s Health Study, and others have shown that millions of Americans aged 50 years and over have dry eye, with women disproportionally affected more than men.Citation3–Citation6 Consistent with this, risk factors for DED include advanced age, female sex, postmenopausal status, and the presence of underlying autoimmune disease.Citation1
Clinically, DED is characterized by inflammation, increased tear osmolarity, tear film instability, and ocular surface damage. Collectively, these changes result in ocular symptoms such as dryness, foreign body sensation, irritation and visual dysfunction.Citation1 DED is classified into one of two primary subgroups, aqueous deficiency or evaporative dry eye, although patients often present with signs of both. Aqueous deficient dry eye is characterized by a reduction in tear production from the lacrimal gland and is further subdivided into Sjögren’s Syndrome Dry Eye (SSDE) and Non-Sjögren’s Syndrome Dry Eye (NSSDE). In evaporative dry eye, excessive tear loss due to evaporation and tear instability leads to desiccation of the ocular surface. This occurs as a result of keratinization in the meibomian gland orifice and changes in meibum composition and physical properties.Citation7–Citation9
Meibomian glands are holocrine glands embedded in the tarsal plates of the upper and lower eyelids. Meibomian glands are responsible for secreting meibum, an integral component of the tear film. Meibum is made up of low amounts of polar lipids (phospholipids) and more abundant nonpolar lipids (cholesterol, wax esters, and cholesterol esters).Citation10–Citation12 The prevalence of MGD in the population varies from 21% to 71% and is impacted by variables such as sex, race, systemic and ocular diseases, and the presence or absence of dry eye symptoms.Citation13,Citation14 In contrast to aqueous deficient dry eye, clinical signs of MGD include the presence of foamy tears, lid margin hyperemia/telangiectasias, meibomian orifice plugging, increased meibum viscosity, and a shift in the mucocutaneous junction.Citation15–Citation17 Additional changes in the tear film include thinning of the lipid layer, measured by interferometry, and a shortening in the tear film breakup time.Citation18,Citation19
Metabolic syndrome is defined by the World Health Organization as a pathologic condition characterized by abdominal obesity, insulin resistance, hypertension, dyslipidemia (high triglycerides and/or low high-density lipoprotein cholesterol), and hyperglycemia.Citation20–Citation22 Patients with metabolic syndrome are at high risk for the development of Type 2 diabetes mellitus (T2DM).Citation21,Citation22 T2DM has been identified as a leading systemic risk factor for DED.Citation23 This is due, in part, to a reduction in the corneal subbasal nerve plexus and disruption of the lacrimal function unit.Citation23–Citation28 This is further supported by studies showing a significant reduction in tear production in patients with T2DM.Citation29–Citation31 More recent evidence now suggests that T2DM may be a causative factor in meibomian gland disease (MGD).Citation32–Citation34
While a link between MGD and diabetes has been established, the relationship between MGD and metabolic syndrome is less clear. Tang et al performed a meta-analysis to determine the relationship between metabolic syndrome and DED.Citation2,Citation35 They concluded that hyperlipidemia, hypertension, and hyperglycemia were associated with DED.Citation2 Erdur and colleagues subsequently evaluated patients with metabolic syndrome for clinical signs and symptoms of dry eye.Citation35 They too concluded that tear film parameters were altered in patients with metabolic syndrome. Neither study investigated the effects of metabolic disease on meibomian gland structure and function. Several investigations have also reported on an association between serum cholesterol levels in MGD with varying results.Citation36–Citation41 In these case control studies, patients with MGD were compared to normal controls. In the current study, we investigated risk factors for metabolic syndrome in a dry eye cohort consisting of MGD and non-MGD dry eye patients presenting to an ophthalmology department at a major urban medical center.
Methods
This is a retrospective review of patients with a known diagnosis of DED presenting to the Department of Ophthalmology at the University of Texas Southwestern Medical Center (Dallas, Texas) from the 1st of January 2017 through the end of December 2018. This study conformed to the Declaration of Helsinki and was approved by the Institutional Review Board at the University of Texas Southwestern Medical Center. Due to the retrospective nature of the study design, informed consent was waived. Diagnosis codes for patients with dry eye disease included: ICD9 codes 370.33 and 375.15; ICD10 codes H04.122, H04.123, H04.129, H16.221, H16.222, H16.223, and H16.229. A total of 299 patients were identified that met all inclusion and exclusion criteria. All patients were 18 years of age or above. Demographic data including age, sex, race, ethnicity, previous ocular and medical history, including serology testing for fasting serum lipids and fasting blood glucose, body mass index, and use of systemic and ocular medications were extracted from medical charts. Smoking status was defined as never, former, or current. All other pertinent history was recorded in a binary fashion. Inclusion criteria included control subjects and patients of any age, sex, race or national origin with a diagnosis of dry eye disease in their medical chart. Exclusion criteria included a recent history of ocular surgery (within the prior 12 months), the presence of autoimmune disease, neurotrophic corneal disease, infectious keratoconjunctivitis, contact lens wear, pregnancy, eyelid abnormalities, lacrimal drainage system abnormalities, history of head and neck radiation, and chronic use of topical glaucoma eye drops that contain benzalkonium chloride.
For determination of MGD status, a binary scoring system was used. MGD negative individuals were defined as having no clinical signs or diagnosis in the medical record. MGD positive individuals had evidence of altered quality of meibum, and/or decreased or absent expression, lid margin hyperemia, telangiectasis, and conjunctival hyperemia. Cut-offs for elevated levels of fasting blood sugar and cholesterol at the Aston Ambulatory Care Center Clinical Laboratory, Dallas, Texas, were defined as follows: Fasting blood sugar less than 100 mg/dL was considered normal, 100 to 125 mg/dL pre-diabetes, and 126 mg/dL or greater considered high and falling within the diabetic range. Cholesterol was considered high if over 200 mg/dL. Normal triglyceride levels were less than 150 mg/dL, borderline between 150 to 199 mg/dL, and high if 200 mg/dL or greater. High density lipoprotein (HDL) cholesterol was low if below 39 mg/dL, while low density lipoprotein (LPL) cholesterol was considered high if 100 mg/dL or greater. A cholesterol/HDL ratio of less than 5 was also considered normal, as was a non-HDL cholesterol level between 95 and 160 mg/dL. All numerical data are presented as mean ± standard deviation along with range. Categorical data are expressed as percent. For evaluation of numerical data, a Student’s t-test was used. For evaluation of categorical data, a chi-square test was performed. Statistical analysis was performed using Sigma Plot (Systat Software, San Jose, CA). P<0.05 was considered significant.
Results
A total of 299 medical charts were reviewed in this study. Patient demographics and anthropometric measures are detailed in . Consistent with female sex as a risk factor for DED, 84 (28.1%) of patients were male and 215 (71.9%) were female. The mean age for all patients was 68.3 ± 14.3 years (range of 24 −97). The majority of patients were Caucasian (85.2%), followed by African American (7.7%), Asian (4.3%), and Pacific Islander (0.3%). Race was not available in the medical chart for 7 patients (2.3%). In terms of ethnicity, 93.3% of patients were non-Hispanic/Latino. There were no differences in age, race, or ethnicity between males and females. The mean body mass index (BMI) was 27.2 ± 6.2 (14.9–56.5), which is classified as overweight. This was not significantly different between males and females.
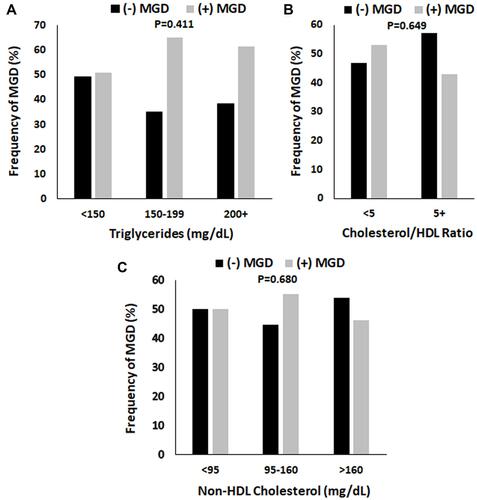
Figure 1 The proportion of patients with MGD was unaffected by triglyceride levels, cholesterol/HDL ratio, and non-HDL cholesterol. (A) Triglyceride levels were separated into three categories: Normal (<150 mg/dL), borderline high (150–199 mg/dL), and high to very high (200 mg/dL and higher). There was a trend, although not significant, towards an increase in MGD in the borderline high and high categories (P = 0.411, chi-square test). (B) The cholesterol/HDL ratio was subdivided into normal (< 5.0) and high (>/= 5.0). There were no differences in the proportion of MGD to non-MGD dry eye patients with normal or high ratios (P=0.649, chi-square test). (C) Non-HDL cholesterol was subdivided into normal (95–160 mg/dL), high (161 mg/dL and higher), and low (< 95 mg/dL). There were no differences between groups (P = 0.680, chi-square test).
In terms of pertinent ocular and medical history (), two thirds of patients (64.5%) were non-smokers having never smoked. One third (34.1%) had a former history of smoking, and 1.3% were current smokers. Forty-three (14.4%) of patients had a prior history of refractive surgery. Neither smoking status nor history of refractive surgery were different between males and females. Just over half (54.5%) of patients had a diagnosis of MGD. There was a greater proportion of males (64.3%) with MGD than females (50.7%). This was significant (P=0.046, t-test). There was a small number of patients with rosacea (1.7%), followed by T2DM (18.1%). Almost half had hypertension (47.8%). With the exception of MGD, there were no differences between sexes for any of these test parameters.
Table 1 Patient Demographics and Pertinent Ocular/Medical History
As shown in , the mean fasting blood glucose level for all patients was 108.3 mg/dL (100–125 mg/mL indicating pre-diabetes). This was significantly different between males and females, 118.8 ± 42.7 and 104.5 ± 27.8 (P = 0.02), respectively. Total cholesterol (male 166.0 ± 42.7, female 190.4 ± 40.5, P = 0.003), HDL cholesterol (male 49.1 ± 20.2, female 63.8 ± 21.1, P < 0.001) and LDL cholesterol (male 90.7 ± 31.8, female 108.4 ± 47.6, P = 0.019) were all significantly different between sexes. There were no statistical differences in triglycerides, cholesterol/HDL ratio, and non-HDL cholesterol.
Table 2 Serological Measures
We next examined whether differences existed between those patients with MGD compared to those with non-MGD dry eye. The proportion of patients with type 2 diabetes mellitus, hypertension, mean BMI, and smoking history were unchanged in those with MGD (). In terms of serologies, there was a small, but significant, increase in mean fasting blood glucose in patients with MGD (P=0.039, ). Comparison of the distribution of patients with and without MGD across triglyceride levels (normal <150 mg/dL, borderline 150–199 mg/dL, or high 200+ mg/dL) showed a trend towards an increase in frequency of MGD with elevated triglycerides, although this finding was not significant (). There were no differences in the frequency of patients with an elevated cholesterol/HDL ratio () or increased non-HDL cholesterol ().
Table 3 Patient Factors Associated with MGD
Table 4 Serology Measures Associated with MGD
Since sex differences were noted for fasting blood glucose, total cholesterol, HDL cholesterol, and LDL cholesterol, the distribution of patients with MGD were further subdivided by serology value and sex. As shown in , no differences in fasting blood glucose were noted between female patients with MGD compared to those without MGD across serum glucose levels (). For males, no differences were seen in the proportion of non-MGD to MGD patients in each of the glucose categories (). However, the overall number of males with MGD was higher across all glucose levels. Similar findings were noted for total cholesterol, HDL cholesterol, and LDL cholesterol (A–F).
Figure 2 The proportion of patients with MGD in both the female and male groups were unaltered by fasting blood glucose levels. Fasting blood glucose levels were separated into three groups: Normal (< 100 mg/dL), pre-diabetes (100–125 mg/dL), and diabetes (126 mg/dL and higher). (A) In females, there were no differences in the proportion of patients with MGD regardless of the fasting blood glucose level (P = 0.611, chi-square). (B) Similarly, in males, there were no differences in the proportion of patients with MGD across fasting blood glucose levels (P = 0.927, chi-square). However, the frequency of MGD was increased two-fold compared to non-MGD patients, regardless of fasting blood sugar.
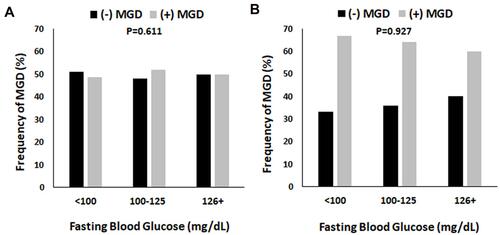
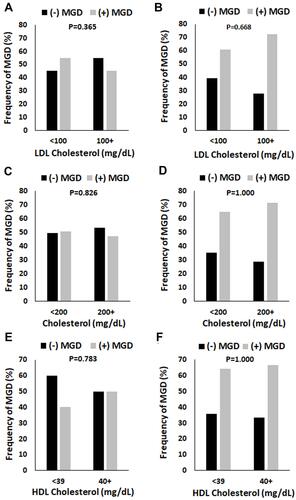
Figure 3 The proportion of patients with MGD in both the female and male groups were unaltered by serum cholesterol levels. (A and B) Total cholesterol levels were defined as normal (< 200 mg/dL) or high (200 mg/dL and above). There were no differences in the proportion of MGD in females (P = 0.826, chi-square test, panel (A) or males (P = 1.000, chi-square test, panel (B). (C and D) HDL cholesterol was defined as low (< 39 mg/dL) or good (40 mg/dL and above). While there were fewer females with MGD in the normal group compared to non-MGD, this was not significant (P = 0.783, chi-square test, panel (C). No differences were seen in the high group. In contrast to this, there were no differences in the proportion of males with MGD compared to non-MGD in either the normal or high group (P = 1.000, chi-square test, panel (D). (E and F) LDL cholesterol was defined as normal (< 100 mg/dL) or high (100 mg/dL and above). There were no differences in the frequency of female patients with MGD in either the normal or high categories (P = 0.365, chi-square test, panel (E). Likewise, no differences were noted for males (P = 0.668, chi-square test, panel (F).
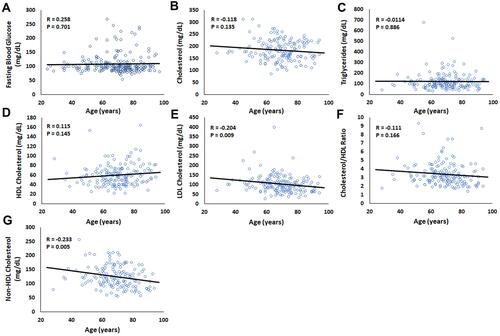
Lastly, while mean age was not different between males and females (70.1 ± 13.9 years and 67.5 ± 14.4 years, ), mean age was significantly different between patients with and without MGD (64.3 ± 15.0 and 71.6 ± 12.9 years, ). To further investigate the effect of age on the serological parameters in this study, a Pearson product moment correlation was used (). Both LDL Cholesterol and non-HDL cholesterol were weakly inversely correlated with age (R = −0.204, P = 0.009; R = −0.233, P = 0.005). No other significant correlations were found.
Figure 4 Older age was weakly associated with lower levels of LDL cholesterol (mg/dL) and non-HDL cholesterol (mg/dL). A Pearson product moment correlation was calculated to determine the relationship between each serological measure and patient age. (A) Fasting blood glucose, R = 0.258, P = 0.701. (B) Cholesterol, R = −0.118, P = 0.135. (C) Triglycerides, R =−0.0114, P = 0.886. (D) HDL cholesterol, R = 0.115, P = 0.145. (E) LDL cholesterol, R = −0.204, P = 0.009. (F) Cholesterol/HDL ratio, R = −0.111, P = 0.166. (G) Non-HDL cholesterol, R = −0.233, P = 0.005.
Discussion
In this study, we investigated the relationship between fasting serum lipid and blood glucose levels and the presence of MGD. Using a non-MGD dry eye cohort for comparison, we show for the first time, that there are no differences in serum lipid and glucose levels between patients with MGD and non-MGD dry eye. This finding differs from previous studies that have primarily focused on a non-MGD population as a comparator and not non-MGD dry eye.Citation37,Citation38,Citation40,Citation41 Thus, differences in the control group across studies may explain the disparity in the findings reported. We further show that within this cohort, male sex is a risk factor for MGD as opposed to non-MGD dry eye. The identification of male sex as a potential risk factor for MGD is not novel and has been previously reported.Citation14,Citation36 It should also be noted that while the male and female cohorts were age matched, there were age differences between patients with MGD compared to non-MGD dry eye. This mean difference in age was seven years, with slightly older patients in the MGD group, however, LDL and non-HDL cholesterol levels were unchanged.
In terms of dyslipidemia, despite males being more likely to have MGD, females in general had significantly higher serum cholesterol levels. This included increases in total cholesterol, LDL cholesterol, and HDL cholesterol. In contrast to this, Chen reported that subjects with asymptomatic MGD were more likely to have elevated serum cholesterol levels, LDL cholesterol and triglycerides.Citation37 When subject to multivariate analysis however, LDL cholesterol and triglycerides posed a relatively low risk for asymptomatic MGD (OR of 1.03 and 1.01, LDL cholesterol and triglycerides, respectively). In a subsequent study, Braich also reported that abnormal levels of total cholesterol, LDL cholesterol, and triglycerides were associated with MGD, with total cholesterol levels carrying the highest overall risk (OR 14.3; 95% CI 8.2–20.7).Citation36 The presence of non-MGD dry eye was not included in the analysis.
Dao and colleagues reported a significant relationship between dyslipidemia and MGD. In their retrospective study, serum lipid profiles in the MGD test group were compared against age-matched serum lipid profiles in the National Health and Nutrition Survey (NHANES), a database containing information regarding the overall prevalence of dyslipidemia in the general population. Likewise, Pinna found that total cholesterol, along with LDL and HDL cholesterol were increased in subjects with MGD.Citation38 As suggested by the authors, a limitation to their work is the lack of heterogeneity in their cohort, as all patients were of Italian ancestry. This may prevent extrapolation of their findings to the overall population due to regional differences in diets, rural versus urban locations that may impact regular access to health care, and genetic factors that may contribute to disease. This limitation applies to many of the currently available studies that have restricted their cohorts to descendants within a specific geographical location. Lastly, Bukhari failed to detect an association between dyslipidemia and MGD.Citation40 Instead, their data suggested a potential relationship between the overall frequency of hypertriglyceridemia and elevated LDL cholesterol with MGD severity. Their comparator group however, consisted of non-MGD subjects and were not screened for the presence of pre-existing dry eye.
Due to the retrospective design of this study, we recognize that certain limitations exist. One potential limitation is the extraction of data from medical records that meet the inclusion criteria, regardless of the treating physician. This undoubtedly resulted in somewhat of an increase in interobserver error. Similarly, as discussed above, data acquired from a single medical center within the region may also result in some level of selection bias. While a single medical center was used for data acquisition in this study, there remained a certain level of racial diversity. It has also been argued that there is a high potential for confounding variables in dry eye subjects, supporting the use of a non-dry eye cohort that may more closely reflect the general population. Different subtypes of dry eye and underlying intrinsic and extrinsic factors may also confound studies such as these. Finally, the inclusion of elderly subjects may also cloud the relationship between fasting lipid abnormalities and MGD. This is due to the association between increased age and an elevation in fasting serum lipids and an increase in MGD.Citation36
DED has been linked with metabolic syndrome and diabetes. Similarly, hyperglycemia, a component of metabolic syndrome, has also been associated with MGD.Citation2 In support of this view, one cross-sectional study showed that the ocular surface disease index questionnaire score and the mean tear osmolarity were significantly higher in patients with metabolic syndrome. Moreover, while the tear film breakup time (TBUT) and Schirmer’s test measurements were significantly lower, there was also a significant correlation between tear osmolarity, waist circumference and fasting blood glucose. No correlations were found between tear osmolarity and triglycerides, HDL and hypertension.Citation35
Meibomian glands are a type of sebaceous gland. Similar to Meibomian glands, dermal sebaceous glands that reside in the hair follicle produce sebum, a lipid-rich secretion that functions to lubricate the skin. Early studies in the mouse showed that ectopic over-expression of human apolipoprotein resulted in hypercholesterolemia and hypertriglyceridemia.Citation42 This increase was pathological, leading to sebaceous and meibomian gland atrophy, skin abnormalities and hair loss. More recently, males with familial type IV hyperlipoproteinemia were shown to have changes in the composition of skin surface lipids, with an increase in wax ester and cholesterol ester, yet the overall sebum production was unchanged compared to normolipid controls. The authors suggested that lipids and lipoproteins derived from blood may account for these changes.Citation43 Lastly, in psoriasis, an inflammatory disease of the skin, dyslipidemia is common.Citation44,Citation45 Other metabolic risk factors associated with psoriasis include dyslipidemia, low cholesterol HDL, hypertriglyceridemia, and changes in blood glucose levels.Citation44,Citation45
While the composition of sebum is quite different from meibum, these studies provide some evidence that the systemic changes in lipids are associated with alterations in sebum.Citation46
It is conceivable that changes in serum lipids and lipoproteins differentially effect the lacrimal and meibomian glands, potentially masking the underlying pathobiology. In certain autoimmune diseases such as psoriasis, sebaceous gland atrophy has been shown in affected skin.Citation47 Self-lipid reactive T-cells have also been shown to contribute to the underlying pathophysiology.Citation48,Citation49 Dyslipidemia is also common in certain autoimmune diseases as is MGD.Citation50 Whether a linkage exists between autoimmune diseases and dyslipidemia as it relates to MGD is unknown and represents an important area of study.
Conclusions
Overall, the relationship between dyslipidemia and MGD is unclear. While some evidence exists to support an association, causation remains to be determined. Since many of these metabolic parameters are associated with both MGD and non-MGD dry eye, prospective well controlled studies are required to tease out the variables associated with ocular surface inflammation, the pathophysiological changes that underly dry eye disease, and the continued evolution of the disease. Further studies are needed to determine how serum lipids contribute to changes in the ocular surface, the potential relationship with autoimmune diseases and self-lipid reactive T cells, and whether modulation of systemic lipids may be efficacious as a treatment for asymptomatic and symptomatic DED.
Disclosure
The authors report no conflicts of interest for this work.
Additional information
Funding
References
- Craig JP, Nichols KK, Akpek EK, et al. TFOS DEWS II definition and classification report. Ocul Surf. 2017;15(3):276–283. doi:10.1016/j.jtos.2017.05.008
- Tang YL, Cheng YL, Ren YP, et al. Metabolic syndrome risk factors and dry eye syndrome: a meta-analysis. Int J Ophthalmol. 2016;9(7):1038–1045.
- Lemp MA, Foulks GN. The epidemiology of dry eye disease: report of the epidemiology subcommittee of the international dry eye workshop (2007). Ocul Surf. 2007;5(2):93–107. doi:10.1016/S1542-0124(12)70082-4
- Paulsen AJ, Cruickshanks KJ, Fischer ME, et al. Dry eye in the beaver dam offspring study: prevalence, risk factors, and health-related quality of life. Am J Ophthalmol. 2014;157(4):799–806. doi:10.1016/j.ajo.2013.12.023
- Schaumberg DA, Sullivan DA, Buring JE, et al. Prevalence of dry eye syndrome among US women. Am J Ophthalmol. 2003;136(2):318–326. doi:10.1016/S0002-9394(03)00218-6
- Schaumberg DA. Prevalence of dry eye disease among US men: estimates from the physicians’ health studies. Arch Ophthalmol. 2009;127(6):763–768. doi:10.1001/archophthalmol.2009.103
- Geerling G, Baudouin C, Aragona P, et al. Emerging strategies for the diagnosis and treatment of meibomian gland dysfunction: proceedings of the OCEAN group meeting. Ocul Surf. 2017;15(2):179–192. doi:10.1016/j.jtos.2017.01.006
- Chhadva P, Goldhardt R, Galor A. Meibomian gland disease: the role of gland dysfunction in dry eye disease. Ophthalmology. 2017;124(11):S20–S26. doi:10.1016/j.ophtha.2017.05.031
- Shine WE, McCulley JP. Role of wax ester fatty alcohols in chronic blepharitis. Invest Ophthalmol Vis Sci. 1993;34(13):3515–3521.
- Green-Church KB, Butovich I, Willcox M, et al. The international workshop on meibomian gland dysfunction: report of the subcommittee on tear film lipids and lipid-protein interactions in health and disease. Invest Ophthalmol Vis Sci. 2011;52(4):1979–1993. doi:10.1167/iovs.10-6997d
- Butovich IA. Tear film lipids. Exp Eye Res. 2013;117:4–27. doi:10.1016/j.exer.2013.05.010
- Shine WE, McCulley JP. Polar lipids in human meibomian gland secretions. Curr Eye Res. 2003;26(2):89–94. doi:10.1076/ceyr.26.2.89.14515
- Rabensteiner DF, Aminfar H, Boldin I, et al. The prevalence of meibomian gland dysfunction, tear film and ocular surface parameters in an Austrian dry eye clinic population. Acta Ophthalmol. 2018;96(6):e707–e711. doi:10.1111/aos.13732
- Hassanzadeh S, Varmaghani M, Zarei-Ghanavati S, et al. Global prevalence of meibomian gland dysfunction: a systematic review and meta-analysis. Ocul Immunol Inflamm. 2021;29(1):66–75. doi:10.1080/09273948.2020.1755441
- Di Pascuale MA. Clinical characteristics of conjunctivochalasis with or without aqueous tear deficiency. Br J Ophthalmol. 2004;88(3):388–392. doi:10.1136/bjo.2003.025460
- Jester JV, Parfitt GJ, Brown DJ. Meibomian gland dysfunction: hyperkeratinization or atrophy? BMC Ophthalmol. 2015;15 Suppl 1(Suppl 1):156. doi:10.1186/s12886-015-0132-x
- Parfitt GJ, Xie Y, Geyfman M, et al. Absence of ductal hyper-keratinization in mouse age-related meibomian gland dysfunction (ARMGD). Aging (Albany NY). 2013;5(11):825–834. doi:10.18632/aging.100615
- Eom Y, Lee J-S, Kang S-Y, et al. Correlation between quantitative measurements of tear film lipid layer thickness and meibomian gland loss in patients with obstructive meibomian gland dysfunction and normal controls. Am J Ophthalmol. 2013;155(6):1104–1110.e2. doi:10.1016/j.ajo.2013.01.008
- Craig JP, Tomlinson A. Importance of the lipid layer in human tear film stability and evaporation. Optom Vis Sci. 1997;74(1):8–13. doi:10.1097/00006324-199701000-00014
- Alberti KG. Harmonizing the metabolic syndrome: a joint interim statement of the International Diabetes Federation Task Force on Epidemiology and Prevention; National Heart, Lung, and Blood Institute; American Heart Association; World Heart Federation; International Atherosclerosis Society; and International Association for the Study of Obesity. Circulation. 2009;120(16):1640–1645.
- O’Neill LA, Pearce EJ. Immunometabolism governs dendritic cell and macrophage function. J Exp Med. 2016;213(1):15–23. doi:10.1084/jem.20151570
- Saklayen MG. The global epidemic of the metabolic syndrome. Curr Hypertens Rep. 2018;20(2):12. doi:10.1007/s11906-018-0812-z
- Zhang X, Zhao L, Deng S, et al. Dry eye syndrome in patients with diabetes mellitus: prevalence, etiology, and clinical characteristics. J Ophthalmol. 2016;2016:8201053. doi:10.1155/2016/8201053
- Cai D, Zhu M, Petroll WM, et al. The impact of type 1 diabetes mellitus on corneal epithelial nerve morphology and the corneal epithelium. Am J Pathol. 2014;184(10):2662–2670. doi:10.1016/j.ajpath.2014.06.016
- Yoo TK, Oh E. Diabetes mellitus is associated with dry eye syndrome: a meta-analysis. Int Ophthalmol. 2019;39(11):2611–2620. doi:10.1007/s10792-019-01110-y
- Huang X, Zhang P, Zou X, et al. Two-year incidence and associated factors of dry eye among residents in shanghai communities with type 2 diabetes mellitus. Eye Contact Lens. 2020;46(Suppl 1):S42–s49. doi:10.1097/ICL.0000000000000626
- Alves Mde C. Tear film and ocular surface changes in diabetes mellitus. Arq Bras Oftalmol. 2008;71(6 Suppl):96–103. doi:10.1590/S0004-27492008000700018
- Markoulli M, Flanagan J, Tummanapalli SS, et al. The impact of diabetes on corneal nerve morphology and ocular surface integrity. Ocul Surf. 2018;16(1):45–57. doi:10.1016/j.jtos.2017.10.006
- Cousen P, Cackett P, Bennett H, et al. Tear production and corneal sensitivity in diabetes. J Diabetes Complications. 2007;21(6):371–373. doi:10.1016/j.jdiacomp.2006.05.008
- Ramos-Remus C, Suarez-Almazor M, Russell AS. Low tear production in patients with diabetes mellitus is not due to Sjögren’s syndrome. Clin Exp Rheumatol. 1994;12(4):375–380.
- Hosaka E, Kawamorita T, Ogasawara Y, et al. Interferometry in the evaluation of precorneal tear film thickness in dry eye. Am J Ophthalmol. 2011;151(1):18–23.e1. doi:10.1016/j.ajo.2010.07.019
- Yu T. Changes of meibomian glands in patients with type 2 diabetes mellitus. Int J Ophthalmol. 2016;9(12):1740–1744.
- Sandra Johanna GP, Antonio LA, Andrés GS. Correlation between type 2 diabetes, dry eye and Meibomian glands dysfunction. J Optom. 2019;12(4):256–262. doi:10.1016/j.optom.2019.02.003
- Lin X, Xu B, Zheng Y, et al. Meibomian gland dysfunction in type 2 diabetic patients. J Ophthalmol. 2017;2017:3047867. doi:10.1155/2017/3047867
- Erdur SK, Aydin R, Ozsutcu M, et al. The relationship between metabolic syndrome, its components, and dry eye: a cross-sectional study. Curr Eye Res. 2017;42(8):1115–1117. doi:10.1080/02713683.2017.1280511
- Braich PS, Howard MK, Singh JS. Dyslipidemia and its association with meibomian gland dysfunction. Int Ophthalmol. 2016;36(4):469–476. doi:10.1007/s10792-015-0149-4
- Chen A, Chen H-T, Chen H-C, et al. Asymptomatic meibomian gland dysfunction and cardiovascular disease risk factors in a middle-aged population in Taiwan - a cross-sectional analysis. Sci Rep. 2017;7(1):4935. doi:10.1038/s41598-017-05368-z
- Pinna A, Blasetti F, Zinellu A, et al. Meibomian gland dysfunction and hypercholesterolemia. Ophthalmology. 2013;120(12):2385–2389. doi:10.1016/j.ophtha.2013.05.002
- Guliani BP, Bhalla A, Naik MP. Association of the severity of meibomian gland dysfunction with dyslipidemia in Indian population. Indian J Ophthalmol. 2018;66(10):1411–1416. doi:10.4103/ijo.IJO_1256_17
- Bukhari AA. Associations between the grade of meibomian gland dysfunction and dyslipidemia. Ophthalmic Plast Reconstr Surg. 2013;29(2):101–103. doi:10.1097/IOP.0b013e31827a007d
- Dao AH, Spindle JD, Harp BA, et al. Association of dyslipidemia in moderate to severe meibomian gland dysfunction. Am J Ophthalmol. 2010;150(3):371–375.e1. doi:10.1016/j.ajo.2010.04.016
- Jong MC, Gijbels MJ, Dahlmans VE, et al. Hyperlipidemia and cutaneous abnormalities in transgenic mice overexpressing human apolipoprotein C1. J Clin Invest. 1998;101(1):145–152. doi:10.1172/JCI791
- Guldur T, Bayraktar Ν, Kaynar Ö, et al. Excretion rate and composition of skin surface lipids on the foreheads of adult males with type IV hyperlipoproteinemia. J Basic Clin Physiol Pharmacol. 2007;18(1):21–35. doi:10.1515/JBCPP.2007.18.1.21
- Fernandez-Armenteros JM. Psoriasis, metabolic syndrome and cardiovascular risk factors. A population-based study. J Eur Acad Dermatol Venereol. 2018;33(1):128–135. doi:10.1111/jdv.15159
- Choudhary S, Pradhan D, Pandey A, et al. The association of metabolic syndrome and psoriasis: a systematic review and meta-analysis of observational study. Endocr Metab Immune Disord Drug Targets. 2020;20(5):703–717. doi:10.2174/1871530319666191008170409
- Butovich IA. Meibomian glands, meibum, and meibogenesis. Exp Eye Res. 2017;163:2–16. doi:10.1016/j.exer.2017.06.020
- Rittié L, Tejasvi T, Harms PW, et al. Sebaceous gland atrophy in psoriasis: An explanation for psoriatic alopecia? J Invest Dermatol. 2016;136(9):1792–1800. doi:10.1016/j.jid.2016.05.113
- Bagchi S. CD1b-autoreactive T cells contribute to hyperlipidemia-induced skin inflammation in mice. J Clin Invest. 2017;127(6):2339–2352. doi:10.1172/JCI92217
- Shahine A. The intricacies of self-lipid antigen presentation by CD1b. Mol Immunol. 2018;104:27–36. doi:10.1016/j.molimm.2018.09.022
- Bagchi S, Genardi S, Wang C-R. Linking CD1-restricted T cells with autoimmunity and dyslipidemia: lipid levels matter. Front Immunol. 2018;9:1616.