
Abstract
Background
Posterior vitreous detachment (PVD) can result in serious pathologic events at the vitreoretinal interface. This study aims to assess the relationship between PVD, macular thickness (MT), and the foveal avascular zone (FAZ) in myopic eyes.
Methods
This retrospective study evaluated 63 myopic subjects’ data who were examined between January 1 and June 30, 2019. The myopes were grouped on a severity scale, namely mild, moderate, high, and very high using their spherical equivalent (SE). The PVD classification was based on OCT images. The status of the PVD and MT were evaluated with the Macular Cube 200×200 images, the FAZ with an OCTA Angioplex, and the dimensions were calculated using a customized algorithm.
Results
The study population (114 eyes) had a median (range) age was 26.00 (22.00–28.00) years and the females constituted 62.3% of the dataset. In this population, 10 eyes had no PVD in any quadrant, and 73 eyes had incomplete PVD in all four quadrants. The inferior quadrant had the maximum rate of PVD occurrences and the nasal quadrant had the least number of occurrences. High myopic eyes exhibited significantly increased low foveal volume (p = <0.01). The inferior part of the para- and perimacular area showed a significant thinning in very high myopic eyes (p = <0.050). The very high myopic eyes showed a significant alteration of FAZ’s circularity index (p = 0.002).
Conclusion
In high and very high myopic eyes, an increasing trend of partial PVD is seen, most commonly in the inferior quadrant. A significant alteration in foveal volume and circularity index of the FAZ is seen in high and very high myopic eyes.
Background
Liquefaction of the vitreous gel which is attached to the internal limiting membrane of the retinaCitation1–Citation3 or spontaneous posterior vitreous detachment (PVD) from the retina is considered to be a part of the normal aging process.Citation1,Citation4 The onset of PVD is usually reported around the fifth decade of life or later in normal.Citation4 The shallow PVD not only helps to predict the prognosis and also determines the indication for vitreoretinal surgery in many vitreoretinal conditions.Citation5 The usual slit-lamp examination with a +90.00 D lens fails to detect shallow PVDs.Citation5 The spectral-domain optical coherence tomography (SD-OCT) is commonly usedCitation2 to image the structural relationship of the vitreomacular interface.Citation3,Citation6 The SD-OCT method not only helps to qualitatively diagnose different stages of the disease but can also be used to quantify the PVD stages.
The increasing prevalence of myopia worldwideCitation7,Citation8 can lead to potentially blinding ocular complications especially in the posterior part of the eyes in pathological myopes.Citation7 Usually the pathological myopic complications are bilateral.Citation9 Myopes are reported to have long axial length (AXL) especially in cases of high myopia (>26.5 mm) due to scleral ectasia.Citation7,Citation8,Citation10 Rhegmatogenous retinal detachment has a higher incidence in axial myopic subjects.Citation4,Citation11 Foveal retinoschisis and posterior staphyloma are also reported in high myopia.Citation4 Bond-Taylor et alCitation12 reported the PVD prevalence in normal individuals was 24% among subjects aged between 50–59 and increases to 89% in the 9th decade of life.
However, in high myopes, the onset of PVD has been reported to occur much earlier than in non-myopic or low-moderate myopic eyes.Citation4,Citation13 For example, Akiba et alCitation11 using a slit-lamp method reported that the onset of PVD in high myopes was in the third decade of life. Similarly, Itakura et alCitation4 also reported that in high myopes (< −8.00 D) PVD could occur as early as the third decade of life.
Many authors have hypothesized that retinal changes occur as a result of mechanical stretching due to axial elongation in myopia.Citation7,Citation8,Citation14 During axial stretching the traction of the vitreous on the fovea in myopic eyes causes structural changes.Citation7 Chung et alCitation15 reported no significant foveal thickness changes with the axial length up to an axial length of 25.5 mm - 26.00 mm. In high myopic eyes (SE < −8.00 D or AXL ≥26.00 mm), a significantly thicker fovea was found with a steep foveal slope.Citation7,Citation16
GomaaCitation17 and AbouhusseinCitation18 reported that retinal morphological changes are common in high myopic eyes and recommended that OCT based investigation should be made routinely. Ito et alCitation19 reported close correlations between the degree of PVD and the stages of idiopathic macular hole. Xu et alCitation20 classified the vitreomacular interface diseases and its sub-classifications based on vitreomacular adhesion and vitreomacular traction. Hence foveal morphological changes are expected in high myopia, especially in the superficial retinal layersCitation21 and blood vessels. To the best of our knowledge there are no reports investigating the relationship between PVD, central macular thickness (CRT) and foveal microvascular zone (FAZ) dimensions in myopic eyes. This is the subject of this study.
Methods
Subjects
The electronic medical records (which included OCTA) of all consecutive myopic subjects who visited a tertiary eye care hospital’s refractive surgery clinic, in Chennai, India between January 1 and June 30, 2019 were reviewed. A total of sixty-three subjects (114 eyes) were included in the study. Myopia was classified into four groups based on spherical equivalent (SE),Citation22 namely low myopia (−0.12 D < SE <-3.00 D), moderate myopia (−3.12 < SE < −5.00 D), high myopia (−5.12 < SE < −10.00 D) and very high myopia (SE <- 10.00 D). The SE was calculated using the manifest refraction during the ophthalmic examination. Inclusion criteria for all groups were subjects with (1) best-corrected visual acuity (BCVA) of 20/30 or better (2) clear ocular media to prevent poor-quality imaging of the macula and FAZ. The exclusion criteria were any prior history of any ocular injury or clinical evidence of retinal diseases.
Central Macular Thickness and Foveal Microvascular Dimensions
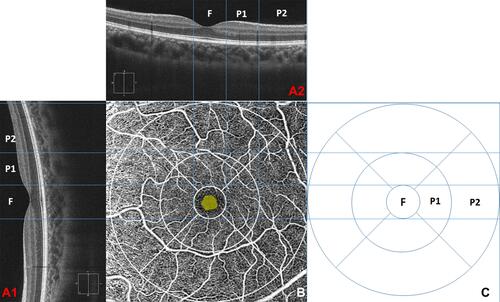
Both central macular thickness (Macular cube 512×128) and foveal microvascular dimensions (Angioplex) were imaged using optical coherence tomography angiography (OCTA; Cirrus 5000 Angioplex; Carl Zeiss Meditec Inc., Dublin, CA). The central macular thickness (CMT) and foveal volume was calculated by an algorithm inbuilt in the device. The foveal microvascular dimensions were calculated using a custom-developed MATLAB programCitation23 and this algorithm has been used to study the FAZ dimensions in normal, diabetic and myopic eyes.Citation24 Though the custom-developed program gives multiple dimension,Citation23 we analyzed FAZ’s area, perimeter, circularity index (a ratio measure, which represents the compactness of a shape relative to a circle),Citation25 and vessel density only. The macular cube utilized a 6 mm x 6 mm (vertical x horizontal) window axial scans in the macular region. The macular region was divided into 9 quadrants with 3 concentric ringsCitation7 (The central 1.0 mm diameter ring represents the fovea. The second 2.0 mm diameter ring represents the para-macular region and the outer most 3.0 mm ring represents the peri-macula; ). The macular thicknesses of every sector were defined by the ETDRS mapCitation26 and were averaged for analysis.
Figure 1 A relationship between PVD location and the corresponding location macular thickness and Angioplex image using the ETDRS method. (A1 and A2) a radial scan of a horizontal and vertical scan. (B) An en-face image of macular and FAZ with ETDRS segmentation (C) the ETDRS macular thickness map. F, P1 & P2 corresponding area of the fovea, para, and peri macular regions.
PVD Classification
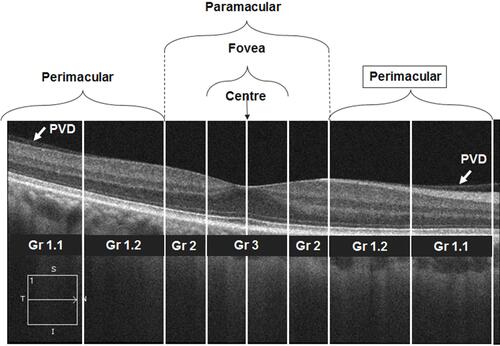
A single clinical expert (RRN) classified the PVD based on the OCT radial images of both vertical and horizontal. Since most of the cases had very early PVD, the method for PVD classification given by Itakura et alCitation4 was modified. shows the stages of PVDs and its classification. If no PVD was seen within the 6 mm scan it was graded as Grade 0. The Grade 1 PVD is a perimacular area attached PVD, the Grade 2 is the PVD attached to the paramacular area. Grade 3 is the foveally attached PVD. Grade 1 covers a larger area and hence it was further sub-classified to 1.1 and 1.2 based on the PDV location (). The PVD was graded for all four quadrants (superior, nasal, inferior and temporal).
Figure 2 An example and a schematic diagram of a SD-OCT horizontal radial scan image. The PVD classification based on the PVD location. The above picture shows the PVD extended till perimacular area with grade 1.2.
Statistical Analysis
All statistical analyses were performed using the SPSS version 20 (SPSS Inc, Chicago, Illinois, USA). The normal distribution of quantitative variables was checked using the Kolmogorov–Smirnov test. A one-way analysis of variance (ANOVA) and Kruskal Wallis analysis was performed for comparison between PVD groups. A two-sided unpaired student’s t-test was used to compare the various parameters of the sub-group myopic groups. The p-value <0.05 was considered significant for all the statistical tests.
Results
Out of the total of 114 eyes, 43 were male (37.72%) and 71 were female (62.28%). The median (IQR: interquartile range) of age, BCVA and SE of this population were 26.00 (22.00–28.00) years, 0.00 (0.00–0.00) logMAR and −5.56 D (−3.09 D - −8.06 D) respectively. The median (IQR) of CMT, FAZ area and macular cube volume (MCV) were 248.00 (235.00–260.00) µm, 0.27 (0.20–0.34) mm2 and 9.80 (9.60–10.10) mm3 for the full sample. shows the median (IQR) study sample demographic and clinical characteristics and their sub-groups of myopia.
Table 1 The Demographic Details of the Study Population
The stage of the PVD was classified using the predefined PVD grading scheme (). Out of 114 myopic eyes, 10 eyes (8.77%) had no PVD in any of the quadrants, 31 eyes (27.19%) had PVD in one or more than one quadrant, and 73 eyes (64.04%) had PVD in all four quadrants. The shows the frequency distribution of PVD in all four quadrants. The inferior quadrant PVD was common and PVD in the nasal quadrant was least common. and show the quadrants wise changes in macular thickness in different degrees of myopia.
Figure 3 Distribution of PVD in all four quadrants.
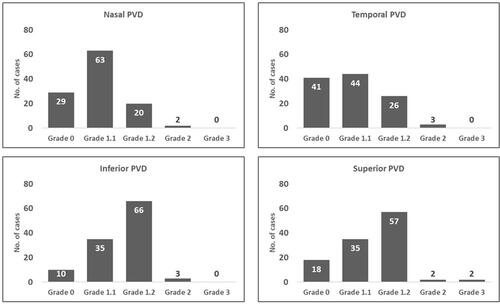
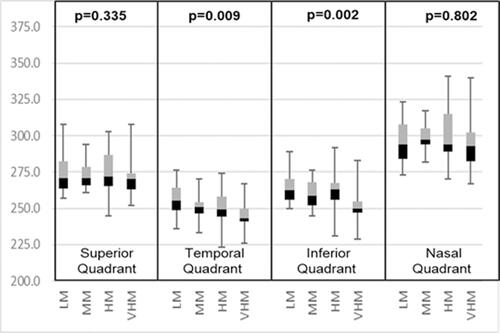
Figure 4 A box-plot between para-macular thickness in four quadrants and degree of myopia.
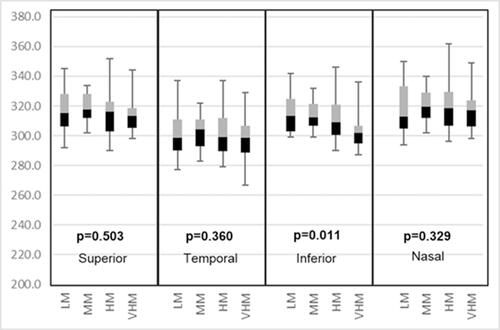
Figure 5 A box-plot of Peri-macular thickness in all the four quadrants and degree of myopia.
shows an alteration in FAZ dimension and foveal characteristics in different degrees of myopia. Only the FAZ circularity (p=<0.010) and foveal volume (p=<0.010) exhibited significant alteration with increases in the degree of myopia.
Table 2 FAZ and Foveal Dimensions for Different Degrees of Myopia
shows a cross correlation table between PVD location and degree of myopia. We found an asymmetry in the PVD location. The results suggest an increasing trend of PVD as the degree of myopia increases with location asymmetry. In low myopia the temporal quadrant showed the least PVD (50.0%) whereas high myopic eyes exhibited the most PVD in the inferior quadrant (97.40%). and show the relationship between paramacular and peri-macular vessel density changes in various stages of PVD. In the paramacular area, the inferior and nasal quadrants showed a significantly decreased vessel density (p=<0.05). However, in the peri-macular area, the nasal quadrant alone showed significant loss of vessel density.
Table 3 A Cross Correlation Table Between PVD Location and Degree of Myopia
Figure 6 Relationship between paramacular vessel density and PVD stages.
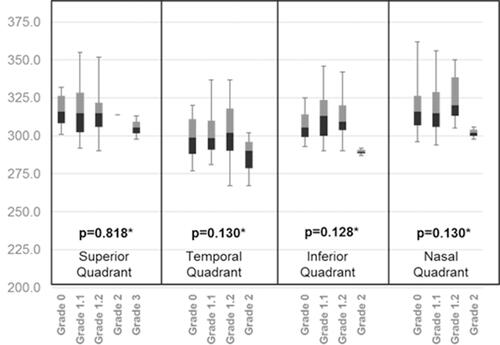
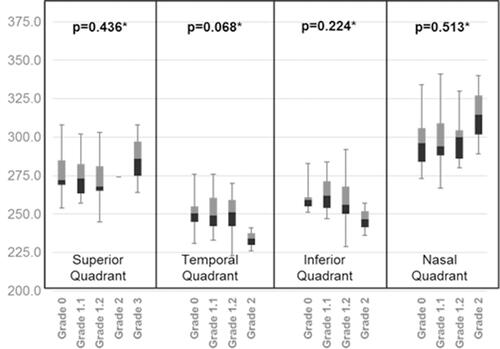
Figure 7 Relationship between peri-macular vessel density and PVD stages.
shows the comparison between PVD with different stages and clinical and foveal dimensions. No clinical parameters, other than SE were statistically significant. However, an increasing trend seen with age and BCVA showed a worsening trend which was not statistically significant. With respect to foveal dimensions an insignificant change was observed with different stages of PVD.
Table 4 Comparison Between Different Stages of PVD and Foveal Dimensions Including Clinical Parameters
Discussion
The current study reports the onset of PVD was in the third decade of life but it did not show any difference in the degree of myopia. However, previous publicationsCitation4,Citation27 report the onset of PVD in high myopia (< −8.00 D SE) was in the third decade of life. This difference could be due to the methodology. In addition, the current paper reports that in patients with no PVD, high myopia patients had increased foveal thickness and macular cube volume when compared to low and moderate myopia. Likewise, in eyes without PVD the FAZ area became smaller as the degree of myopia increased. Previous studies have shown conflicting results regarding foveal thickness and severity of myopia.Citation4 Reports in the literature show results similar to ours. However, Lim et alCitation28 showed that the average macular retinal thickness did not significantly vary between various degrees of myopia. The possible reason for the discrepancies could be because these studies did not take into account the influence of PVD.
There was a reduction in macular volume with a degree of myopiaCitation29 similar in the current study. This could be due to progressive thinning of the para- and peri-foveal thickness with increasing myopia.Citation16 Here we report a smaller FAZ area in high myopia in subjects with incomplete PVD attached at the macula and there is some controversy regarding this issue of FAZ size and degree of myopia.
The custom-developed automated algorithmCitation23 used in this study could detect boundaries with an error of 1.99% compared to the manufacturer’s inbuilt algorithm with 6.42% error excluding orientation. The thresholding method in the custom algorithm dilates the irrelevant part of the image without distorting the actual FAZ boundary and thus reduces the number of false positives.
Kumagai et alCitation30 described the changes in OCT characteristics after an asymptomatic PVD and showed a thinning of the central foveal thickness, deepening of the pit, and widening of the foveal floor after PVD. The mechanism by which the PVD alters the foveal shape and regional macular thickness could be due to the release of the tractional force on the fovea by the peri-foveal Incomplete PVD. An anterior centrifugal traction could cause a thickening of the fovea, and the release of this traction would then presumably reduce the foveal thickness. Likewise, mechanical forces might explain the smaller FAZ in high myopia with Incomplete PVD attached at the macula. The clinical significance of these results, namely that there is an increasing trend of partial PVD has definite clinical implications and needs to be further explored.
A caveat is that we had a small sample size in the various myopia sub-groups. In addition, in this retrospective study there were very few cases with axial length data. Since the FAZ area is affected by the axial magnification during OCT image acquisition, it should be rectified by correcting for this factor.Citation31 We hope to further expand on the datasets as well as pathological conditions in future research.
Conclusions
In summary, this study reports characteristic retinal changes in high and very high myopic eyes. An increasing trend of partial PVD is seen in eyes classified as having high and very high myopia. An asymmetric PVD location was observed and the most commonly involved quadrant was the inferior quadrant. A statistically significant alteration was observed in foveal volume and the FAZ circularity index. However, our data did not show any relationship between PVD and macular thickness and foveal microvascular parameters in high myopic eyes.
Abbreviations
PVD, Posterior vitreous detachment; MT, macular thickness; FAZ, Foveal microvascular zone dimensions; OCTA, Optical coherence tomography angiography; SE, Spherical equivalent; OCT, Optical coherence tomography; SD-OCT, Spectral-domain optical coherence tomography; CRT, Central retinal thickness; CMT, Central macular thickness; ANOVA, Analysis of variance; IQR, Interquartile range; BCVA, Best corrected visual acuity; MCV, Macular cube volume; D, Diopter; LM, Low myopia; MM, Moderate myopia; HM, High myopia; VHM, Very high myopia. mm, Millimetre; µm, Micrometre; ETDRS, Early Treatment Diabetic Retinopathy Study; IPVD, Incomplete posterior vitreous detachment.
Data Sharing Statement
All the clinical data and materials supporting the manuscript are maintained in our hospital (Medical Research Foundation).
Ethics Approval and Consent to Participate
This retrospectives study was approved by the Institutional Review Board of the Vision Research Foundation, Chennai, India. The study conformed to the tenets of the Declaration of Helsinki, and signed informed consent was obtained from all subjects.
Authors’ Information
JJB: Department of Optometry, Sankara Nethralaya, Medical Research Foundation, Chennai, India. RR: Shri Bhagwan Mahavir Vitreoretinal Services, Sankara Nethralaya, Medical Research Foundation, Chennai, India. VL: Theoretical and Experimental Epistemology Lab, School of Optometry and Vision Science, Departments of Physics, Electrical and Computer Engineering and the Systems Design Engineering, University of Waterloo, Waterloo, Ontario, Canada.
Acknowledgments
The authors would like to thank the subjects for agreeing to report the clinical data. This work was partly supported by a DISCOVERY Grant from the Natural Sciences and Engineering Research Council of Canada to V.L.
Disclosure
The authors report no conflicts of interest in this work.
Additional information
Funding
References
- Sebag J. The Vitreous: Structure, Function, and Pathobiology. New York, NY: Springer Verlag; 1989.
- Yıldırım Ş, Menteş J, Barış M. Vitreomacular traction and outer retinal structural changes. Turk J Ophthalmol. 2019;49(2):109–113. doi:10.4274/tjo.galenos.2018.79577
- Stalmans P, Duker JS, Kaiser PK, et al. OCT-based interpretation of the vitreomacular interface and indications for pharmacologic vitreolysis. Retina. 2013;33(10):2003–2011. doi:10.1097/IAE.0b013e3182993ef8
- Itakura H, Kishi S, Li D, Nitta K, Akiyama H. Vitreous changes in high myopia observed by swept-source optical coherence tomography. Investig Ophthalmol Vis Sci. 2014;55(3):1447–1452. doi:10.1167/iovs.13-13496
- Kakehashi A, Takezawa M, Akiba J. Classification of posterior vitreous detachment. Clin Ophthalmol. 2014;8:1–10. doi:10.2147/OPTH.S54021
- Mirza RG, Johnson MW, Jampol LM. Optical coherence tomography use in evaluation of the vitreoretinal interface: a review. Surv Ophthalmol. 2007;52(4):397–421. doi:10.1016/j.survophthal.2007.04.007
- Samuel NE, Krishnagopal S. Foveal and macular thickness evaluation by spectral OCT SLO and its relation with axial length in various degree of myopia. J Clin Diagnostic Res. 2015;9(3):1–4. doi:10.7860/JCDR/2015/11780.5676
- Koh VT, Nah GK, Chang L, et al. Pathologic changes in highly myopic eyes of young males in Singapore. Ann Acad Med Singapore. 2013;42(5):216–224. PMID: 23771108.
- Tsujikawa A, Kikuchi M, Ishida K, et al. Fellow eye of patients with retinal detachment associated with macular hole and bilateral high myopia. Clin Exp Ophthalmol. 2006;34(5):430–433. doi:10.1111/j.1442-9071.2006.01235.x
- Zhao M, Wu Q, Hu P, Jia L. Macular thickness assessed with optical coherence tomography in young Chinese myopic patients. J Ophthalmol. 2015;2015:715798. doi:10.1155/2015/715798
- Akiba J. Prevalence of posterior vitreous detachment in high myopia. Ophthalmology. 1993;100(9):1384–1388. doi:10.1016/S0161-6420(93)31471-5
- Bond-Taylor M, Jakobsson G, Zetterberg M. Posterior vitreous detachment–prevalence of and risk factors for retinal tears. Clin Ophthalmol. 2017;11:1689–1695. doi:10.2147/OPTH.S143898
- Shen Z, Duan X, Wang F, et al. Prevalence and risk factors of posterior vitreous detachment in a Chinese adult population: the Handan eye study. BMC Ophthalmol. 2013;13(1):1–6. doi:10.1186/1471-2415-13-33
- AttaAllah HR, Omar IA, Abdelhalim AS. Assessment of posterior segment using spectral domain OCT in highly myopic eyes. Open Ophthalmol J. 2017;11:334–345. doi:10.2174/1874364101711010334
- Chung YW, Choi MY, Kim JS, Kwon JW. The association between macular thickness and axial length in myopic eyes. BioMed Res Int. 2019;2019:1–7. doi:10.1155/2019/8913582
- Zhao Z, Zhou X, Jiang C, Sun X. Effects of myopia on different areas and layers of the macula: a Fourier-domain optical coherence tomography study of a Chinese cohort. BMC Ophthalmol. 2015;15(1):1–7. doi:10.1186/s12886-015-0080-5
- Panozzo G, Mercanti A. Optical coherence tomography findings in myopic traction maculopathy. Arch Ophthalmol. 2004;122(10):1455–1460. doi:10.1001/archopht.122.10.1455
- Abouhussein M, Gomaa MA. Optical coherence tomography findings in high myopia. Egypt Retina J. 2013;1(2):13–17. doi:10.4103/2347-5617.135241
- Ito Y, Terasaki H, Suzuki T, et al. Mapping posterior vitreous detachment by optical coherence tomography in eyes with idiopathic macular hole. Am J Ophthalmol. 2003;135(3):351–355. doi:10.1016/S0002-9394(02)01944-X
- Xu LT, Punjabi OS, Shao J, et al. Frequency of vitreomacular interface disease in patients presenting to a tertiary care institution. Ophthalmic Surg Lasers Imaging Retin. 2014;45(6):517–520. doi:10.3928/23258160-20141118-05
- Sampson DM, Gong P, An D, et al. Axial length variation impacts on superficial retinal vessel density and foveal avascular zone area measurements using optical coherence tomography angiography. Investig Ophthalmol Vis Sci. 2017;58(7):3065–3072. doi:10.1167/iovs.17-21551
- Dhakal R, Goud A, Narayanan R, Verkicharla PK. Patterns of posterior ocular complications in myopic eyes of Indian population. Sci Rep. 2018;8(1):1–6. doi:10.1038/s41598-018-29536-x
- Agarwal A, Jothi Balaji J, Lakshminarayanan V. A new technique for estimating the foveal avascular zone dimensions. Ophthalmic Technol. 2020;11218R. doi:10.1117/12.2543906
- Jothi Balaji J, Agarwal A, Raman R, Lakshminarayanan V. Comparison of foveal avascular zone in diabetic retinopathy, high myopia, and normal fundus images. Ophthalmic Technol. 2020;11218O. doi:10.1117/12.2544817
- Choi J, Kwon J, Shin JW, Lee J, Lee S, Kook MS. Quantitative optical coherence tomography angiography of macular vascular structure and foveal avascular zone in glaucoma. PLoS One. 2017;12(9):e0184948. doi:10.1371/journal.pone.0184948
- Invernizzi A, Pellegrini M, Acquistapace A, et al. Normative data for retinal-layer thickness maps generated by spectral-domain OCT in a white population. Ophthalmol Retina. 2018;2(8):808–815. doi:10.1016/j.oret.2017.12.012
- Morita H, Funata M, Tokoro T. A clinical study of the development of posterior vitreous detachment in high myopia. Retina. 1995;15(2):117–124. doi:10.1097/00006982-199515020-00005
- Hyun-Taek L, Chun BY. Comparison of OCT measurements between high myopic and low myopic children. Optom Vis Sci. 2013;90(12):1473–1478. doi:10.1097/OPX.0000000000000086
- Hwang YH, Kim YY. Macular thickness and volume of myopic eyes measured using spectral‐domain optical coherence tomography. Clin Exp Optom. 2012;95(5):492–498. doi:10.1111/j.1444-0938.2012.00749.x
- Kumagai K, Hangai M, Larson E, Ogino N. Vitreoretinal interface and foveal deformation in asymptomatic fellow eyes of patients with unilateral macular holes. Ophthalmology. 2011;118(8):1638–1644. doi:10.1016/j.ophtha.2011.01.022
- Llanas S, Linderman RE, Chen FK, Carroll J. Assessing the use of incorrectly scaled optical coherence tomography angiography images in peer-reviewed studies: a systematic review. JAMA Ophthalmol. 2020;138(1):86–94. doi:10.1001/jamaophthalmol.2019.4821