
Abstract
Aim
To study the effect of axial length (AL) on quantitative characterization of macular and optic nerve microvasculature using optical coherence tomography angiography (OCTA) in healthy individuals.
Methods
A cross-sectional study where participants were divided into 3 groups according to AL; A: ≤22.5 mm, B: 22.6–24.5 mm, C: >24.5 mm. Superficial vascular density (SVD), deep vascular density (DVD), foveal avascular zone (FAZ), and radial peripapillary capillary density (RPCD) were calculated using OCTA. Pearson correlation was run to identify the relation between AL and study parameters.
Results
One hundred and twelve eyes of 56 participants (20 males, 36 females) were included. Mean FAZ was 0.33 ± 0.15 mm2, 0.27 ± 0.1 mm2 and 0.28 ± 0.2 mm2 in Groups A, B, and C, respectively (p value 0.073). No significant difference was found between 3 groups, as regards superficial foveal density and vessel density inside the disc. Deep foveal density was significantly lower in Group A in comparison to Groups B and C (p value 0.021 and 0.005, respectively). As for other parameters of SVD, DVD and RPCD, no significant difference was observed between Groups A and B; however, the same parameters were significantly lower in Group C when compared to Group A and B. AL was found to be negatively correlated to FAZ (r −0.191, p value 0.043) and most of parameters of SVD, DVD, and RPCD (p value < 0.0001).
Conclusion
Most of optic nerve and macular microvascular parameters were significantly lower in eyes with longer axial lengths when compared to those with shorter axial lengths. Moreover, most of these parameters were negatively correlated with AL.
Introduction
Optical coherence tomography angiography (OCTA) allows for non-invasive imaging of retinal microvasculature using the motion contrast image processing technology.Citation1
The majority of studies using OCTA to assess and measure normal, healthy retinal microvasculature showed that ageCitation2–Citation4 and genderCitation2,Citation4 are significant parameters when measuring the foveal avascular zone (FAZ) and vessel density in both the superficial and deep retinal vascular layers (SVD and DVD).
A detailed search of literature revealed a few studies concerning the impact of axial length (AL) on retinal vascular densities and FAZ measurement using OCTA. Results of these studies were contradictory. While the majority showed a decrease in retinal microvascular density in macular and peripapillary areas with increased AL,Citation5–Citation9 others failed to establish such relation.Citation10
It is worth noting that these studies included only myopic patients.Citation10–Citation12 One study included a wide range of ALs, however, it was considered mainly by studying image magnification error induced by AL variation on SVD and FAZ.Citation6
Therefore, we conducted this study to investigate the effect of AL on quantitative characterization of the retinal microvasculature. Specifically, we evaluated the effect of AL on superficial vascular density (SVD), deep vascular density (DVD), FAZ area, and radial peripapillary capillary density (RPCD) using OCTA in healthy individuals. As far as we know, study of effect of AL on OCTA parameters in our population has not been addressed in other studies.
Patients and Methods
This cross-sectional population-based study was approved by the ethics committee of Fayoum University, Egypt, and followed the tenets of the Declaration of Helsinki. The study protocol was explained to the participants and signed informed consents were obtained from all of them. The participants were selected from those coming to Fayoum University ophthalmology clinic seeking for glasses or having trivial ocular complaints in the period from December 2020 to March 2021.
Fifty-six healthy participants aging from 18 to 25 years old were included in the study so long they have best corrected visual acuity (BCVA) LogMAR ≤ 0.1, intraocular pressure (IOP) ≤ 21 mm Hg and a normal optic nerve head without any glaucomatous changes. Participants with a history of systemic diseases that might affect the retina or optic nerve such as diabetes or hypertension were excluded from study. Similarly, participants with a history of previous ocular surgery or trauma or signs of any retinal pathology such as pathological myopia and chorioretinal degenerations were not included.
A detailed medical history was obtained from each participant. All participants underwent a thorough ophthalmic examination, including measurement of BCVA using Snellen chart and then converted to LogMAR for statistical analysis, IOP measurement using Goldmann Tonometry, slit-lamp examination, and dilated fundus examination. Axial length (AL) was measured using Carl Zeiss Meditec AG IOLMaster 700 (Goeschwitzer Strasse 51–5107745 Jena, Germany).
Participants were divided into 3 groups according to the AL; Group A: AL ≤ 22.5 mm, Group B: AL from 22.6–24.5 mm, Group C: AL > 24.5 mm.
OCTA Imaging
The OCTA scans were obtained using a spectral-domain device (RTVue-XR Avanti; Optovue, Inc., Fremont, CA, USA). Optic disc 4.5×4.5 scan size (mm) and parafoveal (scan size of 6×6 mm). OCTA scans were captured in two consecutive B-scans at 400 raster locations, and each B-scan was composed of 400 A-scans in 6mm scan. The vessel density was expressed as a percentage of the measured area that was occupied by vessels and quantified using the built-in software (version 2016.1.0.23). In this study, the foveal avascular zone (FAZ) was automatically delineated, preset as an area of absolute no flow, and calculated using the contained software () The vessel density of optic nerve was measured and calculated for the whole image, inside the disc, and peripapillary area which is then divided into superior-hemi and inferior-hemi. ( and ) Superficial and deep vascular densities (SVD and DVD) were calculated, as well, for the whole image, foveal and the parafoveal region which is defined as the annulus extending between 1 and 3 mm radius from foveal center ( and ). The parafoveal density is then divided into superior-hemi and inferior-hemi. OCTA scans having signal strength index <40, segmentation errors or remaining motion artifacts were excluded.
Figure 1 (A) FAZ area 0.346 mm2 of the right eye of case number 46 with AL±22.21mm (Group A), (B) FAZ area 0.207 mm2 of the right eye of case number 1 with AL±23.27mm (Group B).
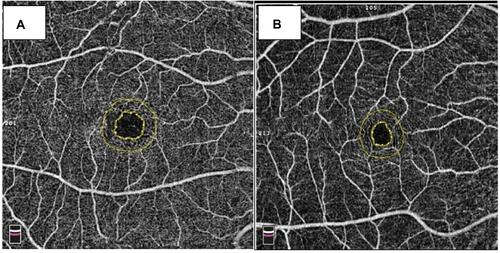
Figure 2 (A and B) Representative angiographic images of the right eye of case number 46 with AL±22.21mm (Group A), 6mm×6mm scan of the superficial plexus and density map, (C and D) of deep capillary plexus and its density map, (E) angiographic images of the optic disc 4.5×4.5mm scan.
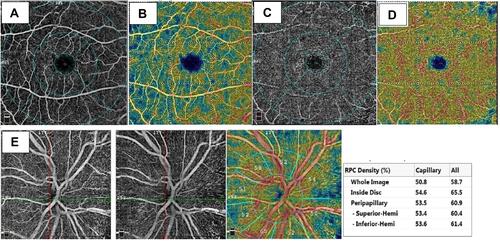
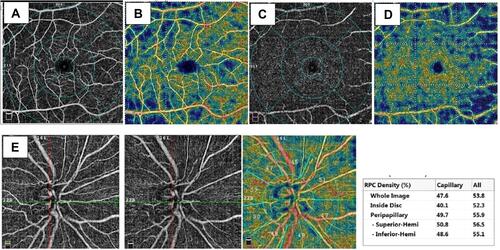
Figure 3 (A and B) Representative angiographic images of the right eye of case number 1 with AL±23.27mm (Group B), 6mm×6mm scan of the superficial plexus and density map, (C and D) of deep capillary plexus and its density map, (E) angiographic images of the optic disc 4.5×4.5mm scan.
Statistical Methods
Sample Size
Both eyes of 56 patients were included in the study. Sample size was calculated using G*Power version 3.1.9.4. To identify the relation between AL and study parameters, a minimum sample size of 112 is needed to detect correlation coefficient (r) of 0.3, based on alpha of 0.05 and power of 90%.
Statistical Analysis
The collected data were arranged, tabulated and statistically analyzed using SPSS software statistical computer package version 22 (SPSS Inc, USA). Normally distributed quantitative data were displayed as the mean and standard deviation (SD). One-way ANOVA was used in comparing between the three groups. Pairwise comparison was done using Post hoc Tukey’s test. However not- normally distributed data were expressed as median and interquartile range (IQR) and Kruskal–Wallis test was used as a test of significance Pearson or Spearman correlation was used to recognize relation between AL and study parameters. Linear regression analysis was done to identify the value of AL in predicting other study parameters. For explanation of results of tests of significance, significance was assumed at P ≤ 0.05.
Results
One-hundred and twelve eyes of 56 participants (20 males, 36 females) were included in this study. The number of participants was 28, 44, and 40 in Groups A, B, and C, respectively. The AL was 21.82 ± 0.71mm, 23.53 ± 0.61mm and 26.44 ± 1.38 mm in Groups A, B, and C, respectively.
Mean FAZ area was found to be 0.30 (21–40 mm2), 0.26 (21–32 mm2) and 0.23 (0.16–33 mm2) in Groups A, B, and C, respectively (p value 0.073, Kruskal Wallis test). No significant difference was found between 3 groups, as regards the superficial foveal density and vessel density inside the disc (p value 0.082 and 0.183, respectively, One Way ANOVA). The deep foveal density was significantly lower in Group A in comparison to Groups B and C (p value 0.021 and 0.005, respectively). As for other parameters of SVD, DVD and RPCD, no significant difference was observed between Groups A and B. On the contrary, the same parameters were significantly lower in Group C when compared to both Group A and B, except for deep parafoveal and inferior parafoveal VD. Different parameters are shown in .
Table 1 OCTA Parameters in Different Groups
Axial length was found to be negatively correlated to FAZ area and this correlation was statistically significant (r −0.191, p value 0.043, Spearman correlation). On the contrary, it was positively correlated with the superficial and deep foveal density (r 0.107, p value 0.275 and r 0.282, p value 0.003, Pearson correlation, respectively) and vascular density inside the disc (r 0.139, p value 0.143). Axial length was negatively correlated to other parameters of SVD, DVD, and RPCD, and this correlation was highly significant (p value < 0.0001).
Several univariate linear regression analyses were run in which each parameter of vessels density was the dependent variable and the AL was the predictor or the independent variable. Multivariate linear regression analyses were used to adjust for age, sex, and LogMAR. Linear regression analysis showed that AL is a significant predictor for the measured parameters except the FAZ area which shows borderline significance (p value 0.051), and vascular density inside the disc (p value 0.178) .
Table 2 Linear Regressions Showing Al as a Predictor for FAZ and Vessels Density
Discussion
The authors imaged and quantified macular and optic nerve microvasculature in healthy participants, with varying ALs, in an attempt to study the effect of AL on quantitative characterization of the retinal microvasculature.
In the current study, most of parameters of SVD, DVD, and RPCD were significantly lower in eyes with AL > 24.5 mm when compared to those with shorter axial lengths. On the contrary, no significant difference was reported between Group A (AL ≤22.5 mm) and Group B (AL from 22.6 mm to 24.5 mm) regarding the same parameters. Moreover, AL was negatively correlated to same parameters of SVD, DVD, and RPCD, and this correlation was highly significant. These results were consistent with a Chinese study that reported that different parafoveal and peripapillary vascular parameters were significantly lower in high myopes when compared to emmetropes, mild and moderate myopes. Similarly, AL was found to be negatively correlated with DVD and RPCD.Citation12 Reduction in retinal microvascular density in macular and\ or peripapillary areas, in myopic eyes compared to emmetropic eyes, has been documented in various studies. Compared to our study, these studies compared eyes of different degrees of myopia to emmetropic eyes and did not include eyes with shorter ALs leading to a narrower range of AL.Citation5–Citation8
Excessive prolongation of the eyeball causes mechanical stretching and thinning of the retina and choroid, this might decrease the oxygen demand and accordingly the vascular density. Alternatively, the thinned retina due to the increased AL can cause the degeneration of retinal vascular endothelial cells and retinal pigment epithelium cells, leading to subsequent reduction of vascular endothelial growth factor (VEGF) production and microvascular density.Citation9,Citation13,Citation14
Surprisingly, Venkatesh et al reported increase in SVD & DVD with higher grades of myopia and found that microvascular density, in both superficial and deep plexuses, is positively correlated with AL.Citation10 It is worth noting that they found thickening of inner retinal and outer plexiform layers, with longer AL, where the superficial and deep plexuses reside, respectively. This might explain the increased vascular density in their study. On the other hand, Yang et al reported that both superficial and deep macular vascular densities were not significantly different among different groups of myopes and they were not correlated with AL.Citation11 This might be due to the fact that their study included only myopic eyes and accordingly a narrow range of AL that might be insufficient to yield statistically significant results.
In our study, mean FAZ area was found to be 0.33±0.15 mm2, 0.27±0.1 mm2 and 0.28 ±0.2 mm2 in Groups A, B, and C, respectively. In previous studies mean FAZ area, in healthy subjects, varied from 0.25 to 0.34 mm2 owing to different image processing techniques, different age groups or racial differences.Citation15–Citation18 Moreover, we depended on automated calculation of FAZ area by the machine’s software, giving us an average of the FAZ area for the whole thickness of the inner two thirds of the fovea unlike previous studies calculating the FAZ area in SCP and DCP layers separately. In our study, we suggested the use of average FAZ instead of individual superficial or deep FAZ, as it may give the most complete profile of microvascular structure of such important landmark, depending on whether superficial or deep capillary plexuses or a combination are involved in determination of size of FAZ.
Mean FAZ area was found to be larger in eyes with AL < 22.5mm when compared to eyes with longer ALs, but this difference was not statistically significant. Consequently, the foveal density was lower in eyes with AL < 22.5mm when compared to eyes with longer ALs, however, this was statistically significant only for DCP. The inverse relation between FAZ area and foveal density has been proved by Falavarjani et al.Citation19 This finding contradicted the results of He et al who reported that area of FAZ was significantly larger in eyes with high myopia.Citation12 In their study they included myopic eyes with AL of 26.43 ± 1.14mm. Large FAZ area in myopes might be due to inverse correlation between central macular thickness and the FAZ area. This correlation might be partially due to the fact that a thicker retina has more metabolic needs and accordingly a smaller FAZ.Citation20,Citation21 Unfortunately, we have not included thickness map in the current study.
We do believe that our study is limited from more than one aspect. First, we included only patients aging from 18 to 25 years old; this might be short of providing a comprehensive normative dataset. Bearing in mind that age affects the retinal microvascular density, this narrow age range might offer an advantage by removing age from being a confounder. Second, we have not reported retinal thickness and consequently we could not correlate the retinal microvascular changes with the retinal structure, but it is worth noting that our main outcome is to study effect of AL on OCTA parameters. Third, our study was monoracial, and it is known that FAZ area and microvascular parameters vary among different ethnic groups. On the other hand, study of effect of AL on OCTA parameters in our population, to the best of our knowledge, has not been addressed in other studies. This might be considered as a point of strength of current study. Fourth, our sample size is small and accordingly range of ALs is smaller than what is expected in the general population.
In conclusion, most of radial peripapillary and macular microvascular density parameters in both superficial and deep layers were found to be significantly lower in eyes with AL> 24.5 mm when compared to those with shorter ALs. Moreover, most of these parameters were negatively correlated with AL. Further studies with a large number of healthy subjects, encompassing a wider range of age, axial lengths and ethnic groups are required to better evaluate retinal microvascular parameters.
Data Sharing Statement
The raw data (excel sheet) that support the findings of this study is available upon request from the corresponding author (M.Y).
Ethics Approval
Authors of this manuscript believe that the research work was guided by the international standards of research ethics and followed the tenets of the Declaration of Helsinki.
Consent to Participate
All patients signed a written informed consent to participate.
Consent for Publication
No individual specific data is included in this submission, therefore the consent to publish is not applicable.
Author Contributions
All authors contributed to data analysis, drafting or revising the article, have agreed on the journal to which the article will be submitted, gave final approval of the version to be published, and agree to be accountable for all aspects of the work.
Disclosure
The authors report no conflicts of interest in this work.
References
- Mo S, Phillips E, Krawitz BD, et al. Visualization of radial peripapillary capillaries using optical coherence tomography angiography: the effect of image averaging. PLoS One. 2017;12(1):e0169385. doi:10.1371/journal.pone.0169385
- Nelson DA, Burgansky-Eliash Z, Barash H, et al. High-resolution wide-field imaging of perfused capillaries without the use of contrast agent. Clin Ophthalmol. 2011;5:1095–1106. doi:10.2147/OPTH.S20103
- de Carlo T, Romano A, Waheed N, Duker J. A review of optical coherence tomography angiography (OCTA). Int J Retina Vitreous. 2015;1(5):1–15. doi:10.1186/s40942-015-0005-8
- Burgansky-Eliash Z, Bartov E, Barak A, Grinvald A, Gaton D. Blood-flow velocity in glaucoma patients measured with the retinal function imager. Curr Eye Res. 2016;41(7):965–970. doi:10.3109/02713683.2015.1080278
- Wang X, Kong X, Jiang C, Li M, Yu J, Sun X. Is the peripapillary retinal perfusion related to myopia in healthy eyes? A prospective comparative study. BMJ Open. 2016;6(3):e010791. doi:10.1136/bmjopen-2015-010791
- Yang Y, Wang J, Jiang H, et al. Retinal microvasculature alteration in high myopia. Invest Ophthalmol Vis Sci. 2016;57(14):6020–6030. doi:10.1167/iovs.16-19542
- Mo J, Duan A, Chan S, Wang X, Wei W. Vascular flow density in pathological myopia: an optical coherence tomography angiography study. BMJ Open. 2017;7(2):e013571. doi:10.1136/bmjopen-2016-013571
- Li M, Yang Y, Jiang H, et al. Retinal microvascular network and microcirculation assessments in high myopia. Am J Ophthalmol. 2017;174:56–67. doi:10.1016/j.ajo.2016.10.018
- Suwan Y, Fard MA, Geyman LS, et al. Association of myopia with peripapillary perfused capillary density in patients with glaucoma: an optical coherence tomography angiography study. JAMA Ophthalmol. 2018;136(5):507–513. doi:10.1001/jamaophthalmol.2018.0776
- Venkatesh R, Sinha S, Gangadharaiah D, et al. Retinal structural-vascular-functional relationship using optical coherence tomography and optical coherence tomography – angiography in myopia. Eye and Vision. 2019;6:1–2. doi:10.1186/s40662-019-0133-6
- Yang S, Zhou M, Lu B, et al. Quantification of macular vascular density using optical coherence tomography angiography and its relationship with retinal thickness in myopic eyes of young adults. J Ophthalmol. 2017;10. doi:10.1155/2017/1397179
- He J, Chen Q, Yin Y, et al. Association between retinal microvasculature and optic disc alterations in high myopia. Eye. 2019;33:1494–1503. doi:10.1038/s41433-019-0438-7
- Jiang H, Debuc DC, Rundek T, et al. Automated segmentation and fractal analysis of high-resolution non-invasive capillary perfusion maps of the human retina. Microvasc Res. 2013;89:172–175. doi:10.1016/j.mvr.2013.06.008
- Zhang M, Hwang TS, Campbell JP, et al. Projection-resolved optical coherence tomographic angiography. Biomed Opt Express. 2016;7(3):816–828. doi:10.1364/BOE.7.000816
- Matsunaga D, Puliafito CA, Kashani AH, Kashani AH. OCT angiography in healthy human subjects. Ophthalmic Surg Lasers Imaging Retina. 2014;45:510–515. doi:10.3928/23258160-20141118-04
- Agemy SA, Scripsema NK, Shah CM, et al. Retinal vascular perfusion density mapping using optical coherence tomography angiography in normals and diabetic retinopathy patients. Retina. 2015;35:2353–2363. doi:10.1097/IAE.0000000000000862
- Samara WA, Say EA, Khoo CT, Samara WA, Say EA, Khoo CT. Correlation of foveal avascular zone size with foveal morphology in normal eyes using optical coherence tomography angiography. Retina. 2015;35:2188–2195. doi:10.1097/IAE.0000000000000847
- Carpineto P, Mastropasqua R, Marchini G, Toto L, Di Nicola M, Di Antonio L. Reproducibility and repeatability of foveal avascular zone measurements in healthy subjects by optical coherence tomography angiography. Br J Ophthalmol. 2016;100:671–676. doi:10.1136/bjophthalmol-2015-307330
- Flavarjani KG, Iafe NA, Velez FG, et al. Optical coherence tomography angiography of the fovea in children born preterm. Retina. 2017;37(12):2289–2294. doi:10.1097/IAE.0000000000001471
- Kim YM, Yoon JU, Koh HJ. The analysis of lacquer crack in the assessment of myopic choroidal neovascularization. Eye (Lond). 2011;25(7):937–946. doi:10.1038/eye.2011.94
- Lopes de Faria JM, Andreazzi DD, Larico Chavez RF, Arthur AM, Arthur R, Iano Y. Reliability and validity of digital assessment of perifoveal capillary network measurement using high-resolution imaging. Br J Ophthalmol. 2014;98(6):726–729. doi:10.1136/bjophthalmol-2013-304100