Abstract
Purpose
Our aim was to extend the concept of blink patterns from average interblink interval (IBI) to other aspects of the distribution of IBI. We hypothesized that this more comprehensive approach would better discriminate between normal and dry eye subjects.
Methods
Blinks were captured over 10 minutes for ten normal and ten dry eye subjects while viewing a standardized televised documentary. Fifty-five blinks were analyzed for each of the 20 subjects. Means, standard deviations, and autocorrelation coefficients were calculated utilizing a single random effects model fit to all data points and a diagnostic model was subsequently fit to predict probability of a subject having dry eye based on these parameters.
Results
Mean IBI was 5.97 seconds for normal versus 2.56 seconds for dry eye subjects (ratio: 2.33, P = 0.004). IBI variability was 1.56 times higher in normal subjects (P < 0.001), and the autocorrelation was 1.79 times higher in normal subjects (P = 0.044). With regard to the diagnostic power of these measures, mean IBI was the best dry eye versus normal classifier using receiver operating characteristics (0.85 area under curve (AUC)), followed by the standard deviation (0.75 AUC), and lastly, the autocorrelation (0.63 AUC). All three predictors combined had an AUC of 0.89. Based on this analysis, cutoffs of ≤3.05 seconds for median IBI, and ≤0.73 for the coefficient of variation were chosen to classify dry eye subjects.
Conclusion
(1) IBI was significantly shorter for dry eye patients performing a visual task compared to normals; (2) there was a greater variability of interblink intervals in normal subjects; and (3) these parameters were useful as diagnostic predictors of dry eye disease. The results of this pilot study merit investigation of IBI parameters on a larger scale study in subjects with dry eye and other ocular surface disorders.
Introduction
An estimated number of 1.68 million men and 3.23 million women are affected by dry eye disease in the United States.Citation1,Citation2 A study of the impact of dry eye disease has determined that the disease has a detrimental effect on the daily visual functioning of patients who report problems with all types of visual tasking.Citation3 The tendency towards decreased blink rate during visual function tasks, such as computer use, reading, video gaming, and watching TV can exacerbate the signs and symptoms of dry eye, further limiting a patient’s visual function.Citation4–Citation6 Furthermore, visual function has been shown to deteriorate throughout the day.Citation7–Citation9 Compromised and fluctuating visual function has also been shown to negatively affect the patients’ quality of life.Citation3
Tear film characteristics, components, and dynamics have been studied for many years to better define changes in tear film stability and, most recently, how those changes can affect visual function. Traditionally, tear film stability has been measured by tear film breakup time, a standard diagnostic test for dry eye, while limited attention has been given to the role of blink patterns. This is in part due to the difficulty of analyzing their widely variable and dynamic nature.
In 1977, we began exploring blink patterns and the relationship of partial blinks to keratopathy.Citation10 Twenty-five years ago, DoaneCitation11,Citation12 laid the foundation on the mechanics of blinking, establishing its importance as a relevant clinical endpoint. Continuing research has shown that measurements of blink patterns and tear film stability are linked, and both are crucial to understanding breakup of the tear film over the cornea, ocular surface health, and function in dry eye subjects.Citation6–Citation9,Citation13 Blink rates, functional changes in relation to blink, and interblink interval (IBI) are parameters that provide a means to evaluate differences between the dry eye and normal patient, as well as changes incurred by treatment.Citation7–Citation9 Tsubota et alCitation14 studied blink rates and intervals in the late 1990s, demonstrating abnormalities in dry eye patients; however, parameters were limited to means and variances, and not time series patterns.Citation14,Citation16
The purpose of the present study was to extend the concept of blink characteristics from simple mean blink rates to other aspects of the distribution of IBI in order to provide a more comprehensive understanding of blink patterns in normal and dry eye subjects, and in particular, to demonstrate whether IBI had a time-series pattern at all.
Methods
This was a single-center pilot study designed to evaluate blink patterns in ten normal and ten dry eye subjects. The study was conducted according to a protocol approved by an external independent review board (Alpha IRB, San Clemente, CA, USA) and written informed consent was obtained prior to the study procedures. Subjects were informed that video would be collected during the study visit.
Subject selection
For the current study, all subjects were at least 18 years of age and were required to have a best corrected visual acuity of +0.6 logMar (logarithm of the maximum angle of resolution) or better in each eye based on the Early Treatment of Diabetic Retinopathy Study chart. They were required to avoid all ophthalmic medications for 2 hours prior to the study visit. We allowed the use of tear substitutes for up to 2 hours prior to blink assessments since it is our experience that the beneficial effects of these products typically have worn off before this time frame. Subjects who had taken any systemic medications known to cause ocular drying were excluded from the study. Subjects were also excluded if they wore contact lenses, had any ocular inflammation or infection, including ocular allergies; or had any significant illness that, in the opinion of the investigator, could have interfered with the trial parameters or confounded the study results. Finally, subjects with a history of ocular surgery of any kind within the previous 12 months were excluded.
Dry eye subjects were selected from a patient database. In order to participate, subjects needed to have a reported history of dry eye and a history of use, or a desire to use, eye drops for dry eye symptoms within the previous 6 months. The dry eye status of each subject was then confirmed by dry eye symptoms, fluorescein staining after video capture, as well as assessments of tear film break up time, as described in a previous report.Citation16 Fluorescein staining was assessed by the investigator in precisely defined regions of the ocular surface using a 0 to 4 scale. Subjects with a mean staining score of ≥1.5 were confirmed as dry eye subjects. Normal subjects were selected based on having no reported history of dry eye symptoms and fluorescein staining of <1.
Video monitoring environment
Each subject was instructed to view a 10-minute documentary displayed on a 25-inch television from a viewing distance of 5 feet. The documentary viewing was conducted individually in an isolated room with the lights on. Temperature and humidity were not controlled, but were within a comfortable range of 70°F–75°F and 35%–55% relative humidity.
Blink analysis
To minimize forced blinking and other changes in natural blink patterns, the subjects were not told that blink patterns were being analyzed. Blink information was obtained from digital video imaging of each subject’s eyes captured over the course of the 10-minute documentary viewing period. The camera was mounted to a headset and directed towards the eye so that eyelid movement could be captured noninvasively. Postcapture, the videos were manually processed and blink patterns analyzed.
The number of blinks measured over a 10-minute period ranged from 65 to 241 for normal subjects, and 129 to 652 for dry eye subjects. The first ten blinks were discarded to establish a more stationary time series. The following 55 blinks were used for all subjects, providing a total sample for analysis of 1100 blinks.
The repeatability of this method was found to be acceptable based on seven of the ten normal subjects who were retested on a second visit. Averages on day 1 and 2 were similar for: IBI means (5.40 and 6.10, P = 0.723), standard deviations (4.69 and 5.65, P = 0.783), and autoregression (0.20 and 0.21, P = 0.918).
Data elaboration
The approach was to construct a sequence of blinks as an IBI time series rather than a simple blink rate, thus providing more information for distinguishing between populations beyond mean blink levels.
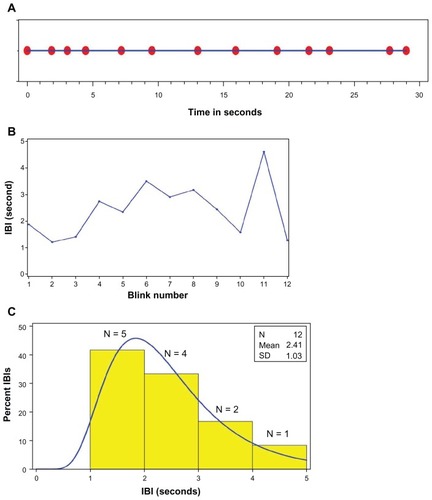
For each subject, a sequence of blinks over time in seconds was transformed into a sequence of IBIs over blink number. This transformation, and the resulting distribution of IBIs, is illustrated in (blink sequence over time in seconds), 1B (IBI sequence over blink number), and 1C (IBI frequency distribution) for the first 30 seconds (after discarding the initial ten blinks) for a normal subject in the study.
Figure 1 Illustration of the transformation of blinks over seconds to IBIs over blink number to the distribution of IBI based on the first 30 seconds of recorded time for a normal subject. (A) Blink sequence (red dots) over time in seconds (blue timeline): 12 blinks (beyond the initial ten blinks) over 30 seconds. (B) IBI sequence (blue line) over blink number: 12 IBIs over 12 blinks. (C) IBI histogram (yellow bars) overlaid with a log normal distribution (blue curve).
Abbreviations: IBI, interblink interval; N, number; SD, standard deviation.
Descriptive and comparative statistics
Two approaches were used to analyze the data. First, a t-test was used to compare normal and dry eye groups based on the 20 subjects’ IBI means, IBI standard deviations, and IBI autocorrelations. IBI means captured the level of blink activity in the time series, the standard deviation captured the variability, and the autocorrelations captured the dependence of the current IBI on past IBIs. Analyses were performed using both IBI and log IBI.
For the second approach, groups were compared using a single random effects model fit to all 1100 data points (55 IBIs × 20 subjects). This model allowed each subject to have their own mean IBI, and provided estimates for group means, within- and between-subject variances, and within-subject autocorrelation coefficients. While other time series structures were explored, an autoregression model of order 1 was found to best fit these data. Analyses were performed on log IBI and results were back-transformed to the original scale.
Receiver operating characteristics (ROC) curves: a diagnostic model
Diagnostic models were fit, the objective of which was to predict the probability of having dry eye given a subject’s IBI mean, standard deviation, and autocorrelation coefficient. For each endpoint, alone and in combination, ROC curves were plotted, and areas under the curves (AUC) were calculated. Models with higher AUCs (approaching 1) had greater predictive power.
Cut-points corresponding to low false positive and low false negative error rates were calculated.
Random effects models were fit using the MIXED procedure of SAS version 9.2 (2009; SAS Institute Inc, Cary, NC, USA; SAS OnlineDoc® 9.2, SAS Institute Inc), and t-tests were fit using the GENMOD procedure.
Results
Subjects
Eight female and two male dry eye subjects participated, with a mean (standard deviation) age in years of 65.5 (15.3), ranging from 37 to 88 years. The signs and symptoms of dry eye present in this group at baseline are reported in . The eight female and two male subjects who comprised the normal group had a mean (standard deviation) age of 26.1 (7.8) years and a range from 22 to 47 years.
Table 1 Baseline signs and symptoms of the ten dry eye subjects included in the study
IBI time series for individual subjects
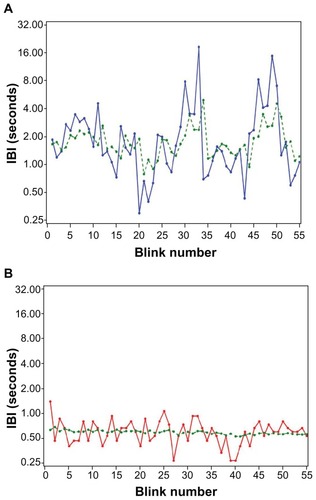
Individual log IBI time series are depicted in (one normal subject) and B (one dry eye subject). These plots illustrate the central results: that normal subjects had higher means, standard deviations, and autocorrelations. The higher autocorrelation in normal subjects is depicted by the similarity of the observed and predicted lines.
Figure 2 IBI time series for a normal and dry eye subject. IBI time series for a normal and dry eye subject plotted on log-linear axes: observed IBI (solid red or blue lines) and predicted IBI for a given blink number based on the previous blink number (dashed green line). (A) Blue = observed; green = predicted for normals; (B) red = observed; green = predicted for dry eye.
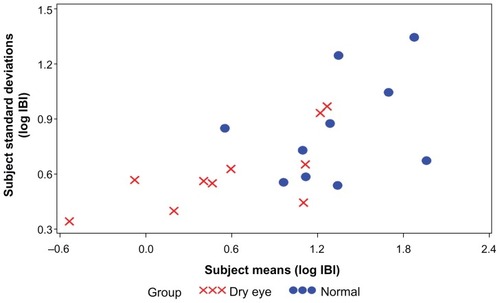
illustrates the relationship between subject means and subject standard deviations. Normal subjects had both higher means and higher standard deviations compared to dry eye subjects.
Figure 3 Log IBI standard deviations versus log IBI means for ten normal and ten dry eye subjects.
Group differences between normal and dry eye subjects
shows the comparison between groups with respect to the 20 subjects’ IBI means, variability, and autocorrelations on original and logarithmic scales. The mean of IBI means for normal subjects was 5.93 seconds versus 2.65 seconds for dry eye subjects (ratio = 2.24, P = 0.003). Differences between group means for coefficients of variation and autocorrelations on the original scale were not significant, although, comparisons for all three outcomes were more significant on the log scale.
Table 2 Group means, SD from the mean, and AC for IBI and log IBI in ten normal and ten dry eye subjects
Random effects model
shows the comparison between groups based on the 1100 individual IBIs. Results are shown on the log scale (on which the model was fit) and on the original scale (after back transformation). All differences were significant: mean IBI for normal subjects was 5.97 seconds versus 2.56 seconds for dry eye subjects (ratio = 2.33, P = 0.004). The IBI coefficient of variation for normal subjects was 1.56 times higher than that for dry eye subjects (P < 0.001), while the ratio for autocorrelations was 1.79 times higher (P = 0.044).
Table 3 Random effects model: IBI and log IBI in ten normal and ten dry eye subjects
Classifying dry eye and normal subjects: diagnostic model
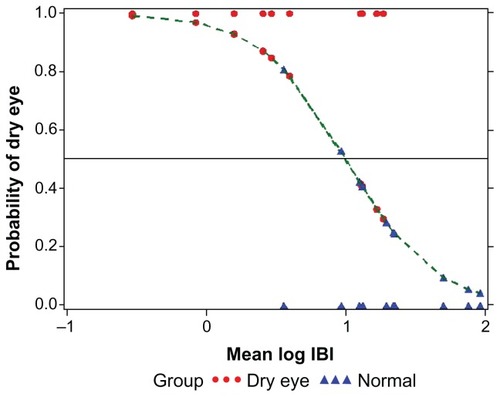
shows the fit of a logistic model using mean log IBI as the single predictor for dry eye. The green fitted curve from the logistic model shows the predicted probability of a subject having dry eye based on their mean IBI. As the mean IBI increased, the probability of having dry eye decreased.
Figure 4 Predicted probability of a subject having dry eye based on their mean log IBI.
Abbreviation: IBI, interblink interval.
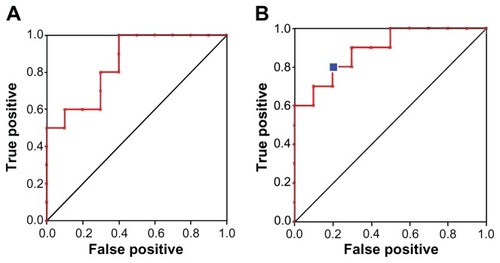
ROC curves were plotted for each outcome and corresponding AUC and R2 statistics were calculated. Mean IBI (on the log scale) was the best classifier (: R2 = 0.49, AUC = 0.85) for dry eye, followed by the standard deviation (R2 = 0.27, AUC = 0.75) and autocorrelation (R2 = 0.04, AUC = 0.63). All three predictors combined provided the best diagnostic prediction (: R2 = 0.63, AUC = 0.89). Cutoff points of ≤1.12 for log mean IBI, ≤0.65 for log standard deviation, and ≤0.21 for log autocorrelation gave a true positive probability of 0.8 and a false positive probability of 0.2. On the raw scale, this corresponded to a median IBI of ≤3.05 seconds, and a coefficient of variation of ≤0.73.
Figure 5 (A) The ROC curve based on one predictor (mean IBI) AUC = 0.85 and (B) on three predictors representing, IBI level (mean), variability (standard deviation), and relationship to past IBIs (autocorrelation), AUC = 0.89.
Abbreviations: ROC, receiver operating characteristics; IBI, interblink interval; AUC, area under the curve.
Discussion
Consideration of IBI rather than blink rate revealed a substantial amount of information for a given sample of blinks. Where blink rate is a single measurement, the IBI series provides several endpoints describing a subject’s blink frequency. This study showed that the IBI was significantly shorter for dry eye patients performing a visual task. Our values for mean IBI of 5.97 versus 2.56 seconds were comparable to those reported by TsubotaCitation14 of 4.0 and 1.5 for normal and dry eye, respectively. Our method differs from that of Tsubota et alCitation14 from a technical perspective, in that subjects are watching a video during measurements instead of engaged in a fixed primary stare; our method also differs from a statistical perspective in that we explored the time-dependent nature of this series of data. It is known that monitor viewing decreases blink rates, and this could have accounted for the slightly higher IBIs that we observed compared to Tsubota et al.Citation14 Our visual task was chosen as a more representative activity of everyday life than primary gaze, and furthermore, the task was the same for normal and dry eye subjects. The finding of increased blinking in dry eye compared to normal subjects observed in the present study might suggest a compensating rather than a triggering event in dry eye.
Another finding was the notable difference revealed in the variability of IBI in normal subjects compared to dry eye patients. Greater variability and autocorrelation in the normal population might have indicated an ability to suppress blinking at will and vary blink according to individual needs. It appears that in the normal subject, there might be a homeostatic mechanism that can adjust the timing of each blink and optimize the optical role of the tear film in retinal image formation. Supporting this finding, Nakano et alCitation17 demonstrated in normal subjects that blinking was synchronized in the video tasking to prevent loss of critical information from the flow of visual input. This control of blink in normals may be closely related to the visual attentional system and contributes to stable visual perception and awareness across interruptions of blinks. In contrast, the present study demonstrated that frequent blinking in dry eye subjects may supersede the requirements of the visual task. Desynchronization with visual tasking in dry eye patients could lead to a critical loss of flow of visual information. This is suggested by other altered parameters of visual function,Citation7–Citation9,Citation13 and by the patient’s own assessment of visual tasking being compromised by tear dysfunction.Citation3
To our knowledge, this is the first representation of blink as a time series. This approach revealed a distinct difference in patterns between dry eye and normals. It also allowed us to predict whether a subject had dry eye. Cutoff points for predicting dry eye with low error rates corresponded to an IBI median of ≤3.05 seconds and a coefficient of variation of ≤0.73. Limitations of this study include its small sample size and the discrepancy in age, which was due to the difficulty in finding age-matched subjects who in fact do not have any signs and/or symptoms of dry eye. More data from a large age-matched subject pool of dry eye and normal subjects, including those with other types of ocular surface disease, would be needed to validate the methodological accuracy and clinical usefulness of this study.
Disclosure
The authors report no conflicts of interest in this work.
References
- SchaumbergDADanaRBuringJESullivanDAPrevalence of dry eye disease among US men: estimates from the Physicians’ Health StudiesArch Ophthalmol2009127676376819506195
- SchaumbergDASullivanDABuringJEDanaMRPrevalence of dry eye syndrome among US womenAm J Ophthalmol2003136231832612888056
- MiljanovićBDanaRSullivanDASchaumbergDAImpact of dry eye syndrome on vision-related quality of lifeAm J Ophthalmol2007143340941517317388
- CardonaGGarciaCSerésCVilasecaMGispetsJBlink rate, blink amplitude, and tear film integrity during dynamic visual display terminal tasksCurr Eye Res201136319019721275516
- SchloteTKadnerGFreudenthalerNMarked reduction and distinct patterns of eye blinking in patients with moderately dry eyes during video display terminal useGraefes Arch Clin Exp Ophthalmol2004242430631214747951
- HimebaughNLBegleyCGBradleyAWilkinsonJABlinking and tear break-up during four visual tasksOptom Vis Sci2009862E106E11419156014
- OuslerGW3rdHagbergKWSchindelarMWelchDAbelsonMBThe Ocular Protection IndexCornea200827550951318520496
- WalkerPMLaneKLOuslerGW3rdAbelsonMBDiurnal variation of visual function and the signs and symptoms of dry eyeCornea201029660761220458235
- TorkildsenGThe effects of lubricant eye drops on visual function as measured by the Inter-blink interval Visual Acuity Decay testClin Ophthalmol2009350150619789659
- AbelsonMBHollyFJA tentative mechanism for inferior punctate keratopathyAm J Ophthalmol1977836866869868989
- DoaneMGInteractions of eyelids and tears in corneal wetting and the dynamics of the normal human eyeblinkAm J Ophthalmol19808945075167369314
- DoaneMGBlinking and the mechanics of the lacrimal drainage systemOphthalmology19818888448517322503
- WalkerPOuslerGWIIIWorkmanDAHankinMAbelsonMBVisual function in normals compared to patients diagnosed with dry eye as measured by the inter-blink interval acuity decay (IVAD) testInvest Ophthalmol Vis Sci2007 48E-abstract 422
- TsubotaKHataSOkusawaYEgamiFOhtsukiTNakamoriKQuantitative videographic analysis of blinking in normal subjects and patients with dry eyeArch Ophthalmol199611467157208639084
- NakamoriKOdawaraMNakajimaTMizutaniTTsubotaKBlinking is controlled primarily by ocular surface conditionsAm J Ophthalmol1997124124309222228
- AbelsonMBOuslerGW3rdNallyLAWelchDKrenzerKAlternative references values for tear film break up time in normal and dry eye populationsAdv Exp Med Biol2002506Pt B1121112512614039
- NakanoTYamamotoYKitajoKTakahashiTKitazawaSSynchronization of spontaneous eyeblinks while viewing video storiesProc Biol Sci200927616733635364419640888