Abstract
Purpose
To study the relationship between macular function assessed by multifocal electroretinogram (mfERG) and morphological changes evaluated with optical coherence tomography (OCT) and fundus photography in patients with drusen maculopathy.
Methods
Ten patients (age 71 ± 5 years) with drusen maculopathy were compared to fifteen healthy control patients (age 67 ± 7 years). One eye per patient was examined with OCT, color fundus pictures, and mfERG (103 hexagons) recorded in nine areas corresponding to the nine areas of the OCT retinal map. Drusen density for every separated area was registered.
Results
All nine areas in the maculopathy group demonstrated prolonged implicit time compared to healthy controls; the mean value for the maculopathy group was 31.3 milliseconds (95% confidence intervals [CI]: 30.9–31.6) vs 27.9 milliseconds (95% CI: 27.5–28.2; P = 0.006) for the control group. The amplitude in the foveal area was lower in the maculopathy group; the mean value for the maculopathy group was 25.1 nV/deg2 (95% CI: 18.4–31.7) vs 33.9 nV/deg2 (95% CI: 27–40.9; P = 0.03) for the control group. mfERG in the maculopathy group demonstrated no differences in areas with or without drusen. There was no correlation between the retinal thickness assessed with OCT and the mfERG response.
Conclusion
Eyes with drusen maculopathy demonstrated functional changes compared to healthy controls evaluated with mfERG. Drusen seems to be associated with general macular dysfunction.
Introduction
Age-related macular degeneration (AMD) is an increasing sight-threatening problem worldwide. According to the latest predictions released by the United Nations, the number of people aged over 60 years will triple from 606 million worldwide in 2000, to nearly 2 billion by 2050. The increase in the population aged over 80 years is expected to be more than five-fold, from 69 million in 2000 to 379 million by 2050. People aged over 60 years constitute about 20% of the population in more developed regions of the world; by 2050, they will probably account for 33%.Citation1 One major implication of this demographic change is the emergence of conditions that are directly related to aging. AMD is already the leading cause of blindness in people over 60 years of age; in the Western world, which totals 8 million people with severe blindness, excluding the countries where data are scarce.Citation2
Large, soft drusen increase the risk of progression to advanced AMD and they are indicative for insufficient cellular function in the retinal pigment epithelium (RPE).Citation3 Substances formed in RPE cells and lipids derived from the neural retina accumulate in Bruch’s membrane, ultra-structurally recognized as basal linear hydrophobic deposits which are visible as drusen.Citation4 Drusen might be complicated by a cellular inflammatory response, that leads to choroidal neovascularization (CNV)Citation5 in the 24% of cases with large drusen over a period from three to five years.Citation6,Citation7
The multifocal electroretinography (mfERG) is a well-established technique for evaluating the local electrophysiological response of the cone-driven retina under light-adapted conditions and has recently been used in AMD studies.Citation8–Citation11
The purpose of the present study was to correlate the functional changes to the morphological status of the macula using mfERG, optical coherence tomography (OCT), and fundus images in patients with drusen maculopathy.
Methods
The research procedures were in accordance with the institutional board of the Medicine Faculty of Lund and informed consent was obtained from all patients in accordance with the Declaration of Helsinki.
Patients
Ten consecutive AMD patients (median age 71 years [range: 64–78]) attended by the Department of Ophthalmology in Blekinge and Lund were included. Eligibility criteria for entry into the study were the presence of at least five or more drusen with a minimum size of 63 μm, within 1500 μm from the fovea, in absence of signs of any other retinopathy or advanced AMD in any eye.Citation12 None of them had cataract or glaucoma in the examined eye and no CNV was detected in the other eye. The best corrected visual acuity (BCVA) was taken in both eyes of each patient. OCT, color fundus photography, and mfERG were performed in the eye with better BCVA.
Control group
Fifteen consecutive healthy controls, similarly aged to the patient group (median age 65 years [range: 60–82]), attending the Department of Ophthalmology of the Hospital of Lund, were included. No subjects had media opacity, myopia, eye disease, or previous ocular surgery. We chose one eye per patient by a randomized process and recorded mfERG.
Visual acuity
The BCVA was measured separately in each eye using the charts of the Early Treatment Diabetic Retinopathy Study Group (ETDRS).Citation13
Optical coherence tomography (OCT)
OCT was performed using a Time Domain (TD) Stratus® OCT 3 (Carl Zeiss Meditec, Inc, Dublin, CA, USA), with centering at the fovea.Citation14,Citation15 Retinal map analysis was performed which consisted of six radial lineal scans of 6 mm length though the center of fixation with 30° displacement of each other. A macular thickness map was calculated in each eye.
Multifocal electroretinography
mfERGs were recorded using the Visual Evoked Response Image System (VERIS Science 5.113 Xb 316; EDI, San Mateo, CA, USA) developed by Sutter et al and according to the ISCEV Guidelines.Citation16–Citation18 The stimulus matrix consisted of 103 hexagonal elements, scaled with eccentricity to elicit approximately equal amplitude responses at all locations, and were displayed on a screen in an infrared (IR) camera and driven at a 75 Hz frame rate at a viewing distance of 27 cm. Each hexagon was independently alternated between black and white according to a pseudorandom binary m-sequence at 75 Hz. The maximum luminance was 138.0 cd/m2 and the minimum luminance was 3.5 cd/m2, resulting in a mean luminance of approximately 70.8 cd/m2, which was also the level of the background luminance. Pupils were maximally dilated with tropicamide and phenylephrine hydrochloride. A gold ground electrode was attached to the forehead. Retinal activity was recorded with a Burian-Allen bipolar lens, which was placed on the anesthetized (oxybuprocaine) cornea. The edge of the lens, lying outside the cornea, contains IR light. The contralateral eye was occluded with an eye patch. A small black fixation object was placed at the center of the stimulus matrix and fixation was monitored with the IR eye camera. The optic disc was identified and the hexagonal elements could be visualized over the retina during the recordings.
Implicit times in N1, P1, and amplitudes were calculated. We analyzed only the electrophysiological results of the four innermost (14°) of the six concentric rings registered by the mfERG which corresponded to the surface explored by the OCT’s macular thickness map (Ø 6 mm) (). The ophthalmologic assistant superimposed the hexagonal pattern from the mfERG examination, corresponding to the three OCT concentric rings, and showed that 1 mm of the radial line corresponds to 4° of the mfERG rings. Finally, we individually analyzed the summed mfERG registers of nine different areas corresponding to each of the segments of the OCT’s exploration ().
Figure 1 OCT and mfERG (103 hexagons) in an eye with drusen maculopathy (picture from IR camera).
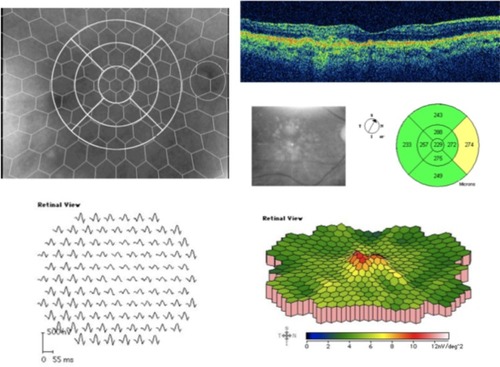
Figure 2 Response of the mfERG in the nine central areas and correlation between fundus pictures, OCT segments, and mfERG hexagons.
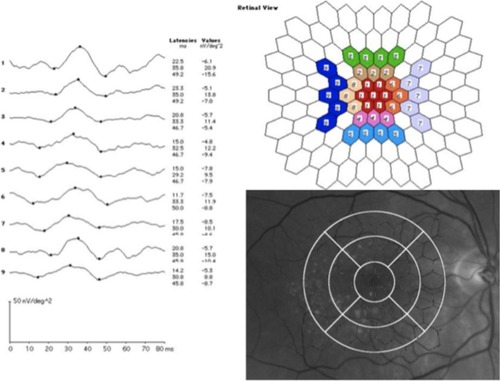
Image acquisition
Fifty degree color fundus pictures were obtained with a Topcon TRC-50 ix camera and Imaginet 2000 system (Topcon American Corporation, Paramus, NJ, USA), with centering at the fovea.
Drusen definition
Drusen were defined as basal linear hydrophobic deposits with diameter greater than 63 μm.Citation11 No eye presented pigment abnormalities or signs of advanced AMD.
Image analysis and quantification of drusen maculopathy
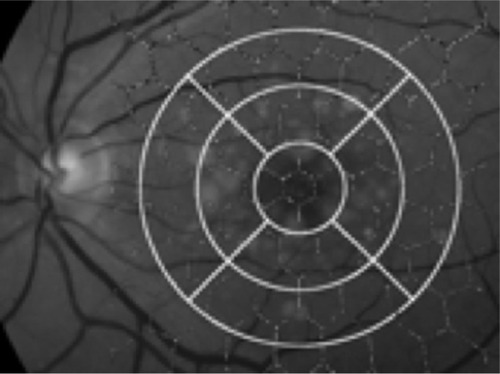
The pattern of the nine segments of the OCT’s macular thickness map was digitally superimposed onto the fundus image with the center corresponding to the fovea and 6 mm diameter (14°) using the Imaginet 2000 system. Consequently, we obtained nine segments on the fundus picture (one central, two superior, two inferior, two nasal, and two temporal; ). Two independent retinal specialists, who were masked to the mfERG and OCT results, graded the extension of each drusen in each segment’s area, to obtain an estimate of the total area occupied by drusen in each segment, which was then expressed as a percentage of the segment area. These were then added and correlated to each area to get a quantitative measurement in the form of percentages. The findings were classified into three groups to facilitate the grading: less than 33%, between 33% and 66%, and more than 66% of the surface occupied by drusen in each segment’s area. We then analyzed the relationship of the macular thickness (OCT), the quantified drusen groups, and the mfERG in each segment of the macular area.
Figure 3 The nine areas of the OCT retinal thickness map and the hexagonal pattern from the mfERG examination, superimposed onto the fundus image of a drusen maculopathy patient for image analysis.
Statistical analysis
Values were given as mean ± SD. Visual acuity and age were given as median and range. Mann-Whitney tests were used for comparing the age, the amplitude, and the implicit time in the different areas between the groups. Cohen’s kappa coefficient was used to measure the agreement between the two retinal specialists in the quantification of drusen. Correlations between the variables, the OCT’s macular thickness, the drusen maculopathy, and the mfERG were tested using Spearman’s rho. For all tests, a P-value less than 0.05 was considered to be statistically significant.
Results
Median BCVA was 85 letters (from 75 to 96) in the maculopathy group. In the control group, the minimal BVCA requirement was 75 letters. No statistically significant age difference was found between the patients and the controls (P = 0.07, Mann-Whitney test).
In patients with drusen, a delay was found in the implicit time response in N1 and P1 in all the nine areas recorded (, ) compared with the controls. The mean N1 was 17.3 ± 2 milliseconds in the patients vs 14.4 ± 1 milliseconds in the controls (P = 0.006, Mann–Whitney test). The mean P1 was 31.3 ± 2 milliseconds in the patients vs 27.9 ± 2 milliseconds in the controls (P = 0.001).
Table 1 Mean ± SD of implicit time (milliseconds) and amplitudes (nV/deg2) in each analyzed area for patient and control groups
The amplitudes in the most central area, corresponding to the fovea, were lower in the patient group (mean 25.1 ± 9 nV/deg2) compared to controls (mean 33.9 ± 12 nV/deg2; P = 0.033) ().
In the maculopathy group, the quantification of drusen was less than 33% of each area in all the segments that contained drusen. Twenty-three percent of the segments did not contain any drusen. Drusen were mostly localized (from highest to lowest) at the central segment (ten patients), the innermost superior (ten patients), the innermost inferior (eight patients), both temporal (eight patients), the innermost nasal (eight patients), the outermost superior (six patients), and the outermost inferior (five patients). There was complete agreement in the image analysis between the two retinal specialists (κ = 1.0; P = 0.001, Cohen’s kappa coefficient).
Within the group with drusen, we did not find any significant difference between the areas with drusen compared to areas without drusen (23% of all areas), neither in implicit time nor in amplitude (Mann-Whitney test).
The OCT thickness was less than 300 μm in each area. There was no statistically significant correlation between the decreased function, showed by mfERG response, and the retinal thickness in each area in the maculopathy group (Spearman’s rho) ().
Table 2 Mean ± SD of implicit time (milliseconds), amplitudes (nV/deg2), OCT thickness, and the grading of drusen in each analyzed area
Discussion
It is known that, in the mfERG, the response density is largest in the fovea where the cone photoreceptors and bipolar cells are densest.Citation18 The implicit time delay reflects disorders in the inner retina and lower amplitude represents photoreceptor loss.Citation19
The results in the present study objectively demonstrate that mfERG from patients with multiple drusen had smaller amplitudes in the fovea and longer implicit time, compared to controls. Previous studies have stated that implicit time is a more sensitive measure than amplitude to detect early dysfunction in eyes with large drusen and that this might indicate that cell loss comes relatively late in the course of the disease.Citation10,Citation11 In contrast, we have found significant reduction in the foveal amplitudes. This finding suggests that cell loss could occur earlier than has been previously thought. One could argue that those alterations in response density are partly due to optical factors or aging, but that would result in amplitude changes, not in implicit time delays.Citation20 In addition, in our sample, none had disturbing media opacity and both the BCVA and age were similar between the groups.
According to the inclusion criteria, only patients with relatively good visual acuity were included (75 letters or more using a 4 m ETDRS chart). In any case, the method is suitable even for patients with lower vision because we obtained the mfERG recording with an IR camera, thus we can monitor the fixation of the eye during the test. Therefore, it is a reliable and reproducible method in the study of macular dysfunction.
We have only considered the four inner rings of the mfERG analysis (14°), in order to associate it to the OCT. In contrast, previous works have examined two additional rings of mfERG.Citation10–Citation12 We believe that our research method is suitable for studying macular function and for comparison with the OCT thickness map, because the summed response from the nine defined areas on the mfERG recording corresponds well to the OCT mapping protocol. This is supported by an earlier study from Holm et al.Citation21
In our research, no significant statistical correlation was found between the OCT retinal thickness (less than 300 μm) and macular function (mfERG). It is possible that the mfERG may only decrease when macular thickness is greater than 300 μm, as it has been previously reported.Citation21 Time domain OCT (TD-OCT) was used as this was the only possibility at the beginning of the study. However, additional research with spectral domain OCT (SD-OCT) could be of interest to study the ultra-structural association between mfERG response in cases of drusen maculopathy and findings seen in the four outer bands of the SD-OCT in those patients.Citation22,Citation23
Our study showed that dysfunction of the outer retina is limited to the fovea, which is in agreement with Johnson et al, who suggested altered synaptic architecture in cones overlying drusen.Citation24 Furthermore, we have observed a spread effect in the surrounding areas where there are no drusen. About 25% of the areas explored showed no drusen and there were no statistically significant differences in the electrophysiological response between areas with or without drusen. This implies that retinal dysfunction is not limited to areas with visible morphological changes in drusen maculopathy and that the presence of drusen may lead to general dysfunction in the macula.
According to our results, we can confirm that our OCT model of mfERG analysis is a reliable method to assess macular dysfunction by drusen maculopathy in the early stages of AMD. Eyes with drusen demonstrated mfERG alterations compared to healthy controls, even in areas where drusen were not present. Further studies are needed to investigate the usefulness of mfERG as a tracking tool in this disease, and to correlate it to findings in the SD-OCT.
Acknowledgments
This study was supported by grants from the Medical Faculty, Lund University; the Skane County Council Foundation for Research and Development; and the Crown Princess Margareta’s Committee for the Blind.
Disclosure
The authors report no conflicts of interest in this work.
References
- United NationsThe World Population Prospects: The 2000 Revision. HighlightsNew YorkUnited Nations2001 Available from: http://www.un.org/esa/population/publications/wpp2000/highlights.pdfAccessed May 29, 2013
- World Health OrganizationFact sheet N 144. Blindness and Visual Disability. Part III of VII: Other Leading Causes WorldwideGenevaWorld Health Organization1997 Available from: https://apps.who.int/inf-fs/en/fact144.htmlAccessed May 29, 2013
- KleinRPetoTBirdAVannewkirkMRThe epidemiology of age-related macular degenerationAm J Ophthalmol200413748649515013873
- RubertiJWCurcioCAMillicanCLMencoBPHuangJDJohnsonMQuick-freeze/deep-etch visualization of age-related lipid accumulation in Bruch’s membraneInvest Ophthalmol Vis Sci2003441753175912657618
- Espinosa-HeidmannDGSunerIJHernandezEPMonroyDCsakyKGCousinsSWMacrophage depletion diminishes lesion size and severity in experimental choroidal neovascularizationInvest Ophthalmol Vis Sci2003443586359212882811
- HolzFGWolfensbergerTJPiguetBGross-JendroskaMBilateral macular drusen in age-related macular degeneration. Prognosis and risk factorsOphthalmology1994101152215288090455
- KleinRKleinBEJensenSCMeuerSMThe five-year incidence and progression of age-related maculopathy: the Beaver Dam Eye StudyOphthalmology19971047219022098
- HoodDCBachMBrigellMISCEV standard for clinical multifocal electroretinography (2011 edition)Doc Ophthalmol201212411322038576
- LiLTsoMLamTReduced amplitude and delayed latency in foveal response of multifocal electroretinogram in early age related macular degenerationBr J Ophthalmol20018528729011222332
- GerthCHauserDDelahuntPBMorseLSWernerJSAssessment of multifocal electroretinogram abnormalities and their relation to morphologic characteristics in patients with large drusenArch Ophthalmol2003211404141414557176
- GerthCDelahuntPBAlamSMorseLSWernerJSCone- mediated multifocal electroretinogram in age-related macular degeneration: progression over a long-term follow-upArch Ophthalmol200612434535216534054
- Age-Related Eye Disease Study Research GroupThe Age-Related Eye Disease Study system for classifying age-related macular degeneration from stereoscopic color fundus photographs: the Age-Related Eye Disease Study Report Number 6Am J Ophthalmol200113266868111704028
- Early photocoagulation for diabetic retinopathyETDRS report number 9. Early Treatment Diabetic Retinopathy Study Research GroupOphthalmology199198Suppl 57667852062512
- HeeMRIzattJASwansonEAOptical coherence tomography of the human retinaArch Ophthalmol19951133253327887846
- HuangDSwansonEALinCPOptical coherence tomographyScience1991254117811811957169
- SutterEETranDThe field topography of ERG components in man – I. The photopic luminance responseVision Res1992324334461604830
- BearseMASutterEEImaging localized retinal dysfunction with the multifocal electroretinogramJ Opt Soc Am Assoc199613634640
- HoodDCBachMBrigellMISCEV guidelines for clinical multifocal electroretinography (2011 edition)Doc Ophthalmol2012116111
- TakiuraKYuzawaMMiyasakaSMultifocal electroretinogram in patients with soft drusen in maculaInvest Ophthalmol Vis Sci200142Suppls73
- TzekovRTGerthCWernerJSSenescence of human multifocal electroretinogram components: a localized approachGraefes Arch Clin Exp Ophthalmol200424254956015085352
- HolmKLarssonJLövestam-AdrianMIn diabetic retinopathy, foveal thickness of 300 micron seems to correlate with functionally significant loss of visionDoc Ophthalmol200711411712417242898
- RubertiJWCurcioCAMillicanCLQuick-freeze/deep etch visualization of age-related lipid accumulation in Bruch’s membraneInvest Ophthalmol Vis Sci2003441753175912657618
- SpaideRCurcioCAnatomical correlates to the bands seen in the outer retina by Optical Coherence TomographyRetina201181609161921844839
- JohnsonPTLewisGPTalagaKCDrusen-associated degeneration in the retinaInvest Ophthalmol Vis Sci2003444481448814507896