Abstract
Background
The purpose of this study was to examine cone photoreceptors in the macula of patients with retinitis pigmentosa using an adaptive optics fundus camera and to investigate any correlations between cone photoreceptor density and findings on optical coherence tomography and fundus autofluorescence.
Methods
We examined two patients with typical retinitis pigmentosa who underwent ophthalmological examination, including measurement of visual acuity, and gathering of electroretinographic, optical coherence tomographic, fundus autofluorescent, and adaptive optics fundus images. The cone photoreceptors in the adaptive optics images of the two patients with retinitis pigmentosa and five healthy subjects were analyzed.
Results
An abnormal parafoveal ring of high-density fundus autofluorescence was observed in the macula in both patients. The border of the ring corresponded to the border of the external limiting membrane and the inner segment and outer segment line in the optical coherence tomographic images. Cone photoreceptors at the abnormal parafoveal ring were blurred and decreased in the adaptive optics images. The blurred area corresponded to the abnormal parafoveal ring in the fundus autofluorescence images. Cone densities were low at the blurred areas and at the nasal and temporal retina along a line from the fovea compared with those of healthy controls. The results for cone spacing and Voronoi domains in the macula corresponded with those for the cone densities.
Conclusion
Cone densities were heavily decreased in the macula, especially at the parafoveal ring on high-density fundus autofluorescence in both patients with retinitis pigmentosa. Adaptive optics images enabled us to observe in vivo changes in the cone photoreceptors of patients with retinitis pigmentosa, which corresponded to changes in the optical coherence tomographic and fundus autofluorescence images.
Introduction
Retinal degenerations constitute a group of inherited diseases that result in progressive loss of photoreceptors. In retinitis pigmentosa, cone dysfunction is secondary to rod degeneration and ultimately results in loss of fine visual acuity.Citation1,Citation2 Survival of photoreceptors seems to be closely correlated with visual functioning in patients with retinitis pigmentosa.Citation2,Citation3 Therefore, assessment of photoreceptors may be very important in evaluation of disease progression in patients with the disease.
The functioning of the retinal pigment epithelium can be visualized by fundus autofluorescence using a short wave length, which reflects lipofuscin accumulation in the retinal pigment epithelium or disrupted phagocytosis.Citation4 Indeed, other studies have reported that an abnormal fundus autofluorescence ring is present in more than half of patients with retinitis pigmentosa examined, and that the length of the inner and outer segment (IS/OS) line determined by optical coherence tomography (OCT) is significantly correlated with the diameter of the fundus autofluorescence ring.Citation2,Citation5,Citation6 In a study using new retinal imaging devices, such as spectral-domain OCT and adaptive optics scanning laser ophthalmoscopy, it was shown that patients with retinitis pigmentosa had abnormal cone spacing values, which were correlated with reduction in visual acuity and the amplitudes of multifocal electroretinograms.Citation7
In the present study, we analyzed cone photoreceptors in the macula of patients with retinitis pigmentosa using an adaptive optics fundus camera, and examined the relationship between cone photoreceptor density and abnormal findings on fundus autofluorescence and OCT images.
Materials and methods
We examined two patients with retinitis pigmentosa at Toyama University Hospital. Each patient underwent a complete eye examination, including measurement of decimal best-corrected visual acuity and collection of scotopic and photopic full-field electroretinographic, OCT, fundus autofluorescent, and adaptive optics fundus camera images. OCT was performed using a three-dimensional OCT-2000 system (Topcon Corp, Tokyo, Japan). Electroretinography was performed using an LE-4000 system (Tomey Corp, Aichi, Japan) according to the International Society for Clinical Electrophysiology of Vision standards. Fundus autofluorescent images were obtained with a scanning laser ophthalmoscope (F-10, Nidek Co, Aichi, Japan). A blue laser light (490 nm) was used for excitation and a wide bandpass filter with a cutoff at 521 nm was inserted in front of the detector for fundus autofluorescence. Adaptive optics fundus images were taken with a rtx-1™ food-illuminated adaptive optics fundus camera (Imagine Eyes, Orsey, France). The rtx-1 has a resolution of 1.6 μm with a 4 × 4 degree imaging field of view and an illumination wavelength of 850 nm. The adaptive optics images taken with the rtx-1 were analyzed using the original cone analysis software created by the manufacturer.
To establish a healthy control group for purposes of comparison with the patients suffering from retinitis pigmentosa, we also included five healthy control eyes from five subjects. Adaptive optics images of the healthy control eyes were taken using the rtx-1 and analyzed with the same software. All procedures conformed to the tenets of the Declaration of Helsinki. The study protocol for the adaptive optics fundus camera was approved by the institutional review board of the University of Toyama. All subjects gave their written informed consent before participation in the study.
Results
Case 1
Case 1 was a 31-year-old woman with best-corrected visual acuity of 0.9 in the right eye and 1.0 in the left eye. A color fundus photograph of the right eye showed fundus changes typical of retinitis pigmentosa, ie, black bone spicule pigmentation and depigmentation, narrowing of the retinal vessels, and retinal degeneration (). Scotopic and photopic full-field electroretinograms were undetectable in both eyes (data not shown). An abnormal parafoveal ring of high-density fundus autofluorescence was observed in the fundus autofluorescence image (arrows in ), which indicated abnormal phagocytosis and concomitant lipofuscin accumulation in the retinal pigment epithelium. The fovea showed a normal dark area on fundus autofluorescence.
Figure 1 Fundus images of the right eye in case 1. Color fundus photograph (A), short-wave length fundus autofluorescence photograph (B), spectral-domain optical coherence tomographic image (C), and magnifed fundus autofluorescence photograph of the macula (D). Arrows show a parafoveal high-density fundus autofluorescence ring (B). Arrowheads show the border of the external limiting membrane and the inner segment and outer segment line (C) and parafoveal high-density fundus autofluorescence ring (D). Bar = 200 μm (C and D).
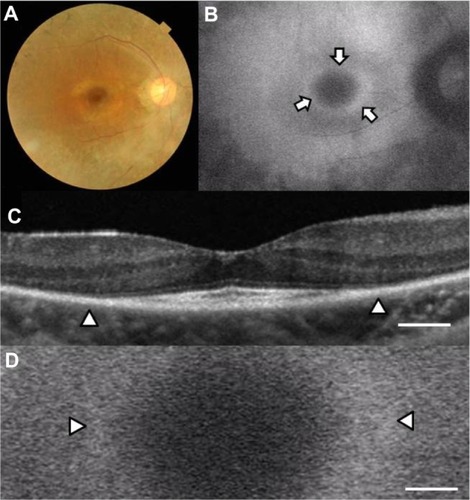
The OCT image of the macula of the right eye () showed an irregular cone outer segment tips line and IS/OS line at the fovea. The normal dark macular fundus autofluorescence area corresponded to the area with the residual cone outer segment tips line and IS/OS line ( and D). The high-density autofluorescent ring in the fundus autofluorescence image corresponded to the border of the IS/OS line and the external limiting membrane in the OCT image (arrowheads in and D). However, it was difficult to determine whether the inner or outer border of the high-density fundus autofluorescence ring corresponded to the termination of the IS/OS line and external limiting membrane in the OCT image.
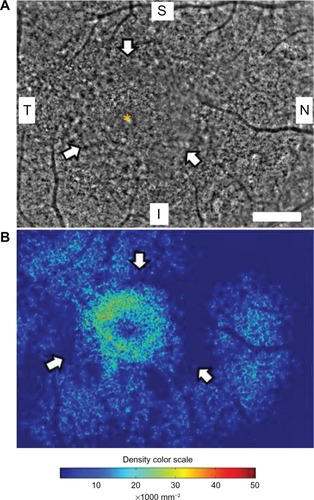
shows a panoramic image of cone photoreceptors in a 2.42 × 3.16 mm area including the fovea of the right eye taken with the adaptive optics fundus camera. The number of cone photoreceptors was reduced in this panoramic adaptive optics image. A ring-shaped area with blurred cone mosaics and some patchy dark areas around the fovea was observed (arrows in ). This ring-shaped blurred area corresponded to the high-density autofluorescent ring by fundus autofluorescence. Cone photoreceptors in the adaptive optics images were analyzed using the manufacturer’s software. The cone density panorama map obtained from the image in is shown in . The blurred ring in shows a reduced density of cone photoreceptors (arrows in ). In the region outside of the ring, areas of higher cone densities resembling islands were observed (arrowheads in ). Adaptive optics fundus photographs were taken several times and photographs that were blurred by motion artifacts were not used.
Figure 2 Panoramic adaptive optics fundus image (A) and cone density map (B) of the right eye in case 1. (A) Panoramic adaptive optics fundus image 2.42 × 3.16 mm in area including the fovea (yellow asterisk). Arrows show a blurred ring area of cone mosaics which corresponds to the parafoveal high-density fundus autofluorescence ring. Bar = 200 μm (A). (B) Panoramic cone density map of the same area as in (A).
Abbreviations: S, superior; i, inferior; N, nasal; T, temporal.
Four 200 × 200 μm areas at the nasal or temporal retina were selected (avoiding large retinal vessels) and analyzed using the software (). The nasal or temporal areas were selected at the blurred ring (N600 and T600) and outside of the ring (N1300 and T1 100). The N600 and T600 distances were 600 μm from the foveal center, and the N1300 and T1100 distances were 1300 μm and 1100 μm from the foveal center. The results for the three types of cone analyses at the four areas are shown in , and the data are shown in . The results of the cone analyses for the five healthy control eyes in the same four areas as examined in case 1 are also shown in . The control data are expressed as the mean ± standard deviation for the five healthy control eyes. shows panoramic (6.22 × 0.96 mm) and 0.2 × 0.2 mm adaptive optics images in one of the five healthy control eyes obtained by rtx-1.
Figure 3 Cone analyses of the parafoveal areas in case 1.
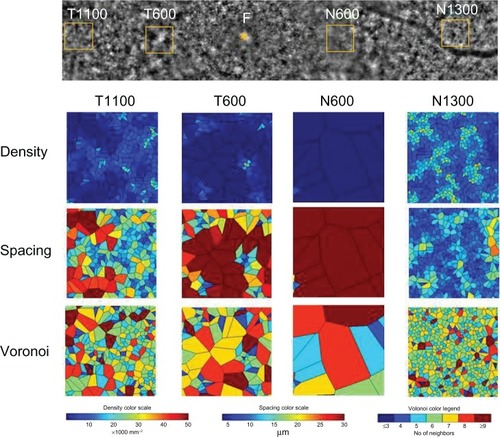
Figure 4 Panoramic and focal adaptive optics images of the macular area in one eye for the healthy controls.
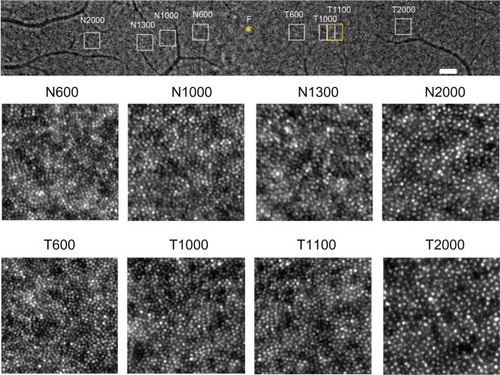
Table 1 results of cone analyses at four areas in the macula of the right eye in case 1 and healthy control eyes
The densities of cone photoreceptors were lower at all four areas than those of the healthy control eyes (). As shown in , the cone densities at the blurred area of the ring (T600 and N600) were lower than the areas outside of the ring (T1 100 and N1300), even though the OCT image showed loss of the IS/OS line and external limiting membrane. The results for the spacing and Voronoi domains were correlated with those of the densities.
Case 2
Case 2 was a 56-year-old woman with best-corrected visual acuity of 1.2 in both eyes. A color fundus photograph of the right eye showed fundus characteristics typical of retinitis pigmentosa, as also seen in case 1 (). Scotopic and photopic full-field electroretinograms were undetectable in both eyes (data not shown). A parafoveal ring with a high density of autofluorescence was observed by fundus autofluorescence (arrows in ), but only the inner border of the temporal part of the ring was demarcated (arrowhead in ). The IS/OS line and the external limiting membrane were better preserved than in case 1, and the border of the IS/OS line and the external limiting membrane was observed in the OCT image (arrowheads in ). The nasal part of the high-density parafoveal fundus autofluorescence ring corresponded to the border of the IS/ OS line and the external limiting membrane (arrowheads in ), but the temporal part of the ring was not clear. shows a panoramic image of cone photoreceptors in a 1.05 × 5.88 mm area including the fovea of the right eye. The cone photoreceptors of the adaptive optics image were reduced in the macula, and the area with blurred cone mosaics and patchy dark spots corresponded to only the nasal part of the parafoveal ring (arrowheads in ). The cone photoreceptors in the adaptive optics images were analyzed using the manufacturer’s software. The cone density panoramic map () shows that the area of the blurred cone mosaics in the nasal part of the ring has reduced cone densities (arrowheads in ).
Figure 5 Color fundus photograph (A) and short-wavelength fundus autofluorescence photograph (B) of the right eye in case 2. Arrows show an incomplete parafoveal ring of high-density fundus autofluorescence (B). The arrowhead shows the inner border of the high-density fundus autofluorescence ring (B).
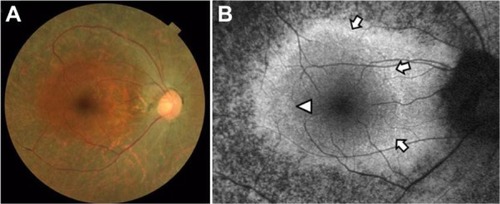
Figure 6 Macular images of OCT (A), fundus autofluorescence (B), adaptive optics (C), and the panoramic cone density map (D) of the right eye in case 2. The OCT image shows the border of the inner segment and outer segment line and the external limiting membrane at the arrowheads (A). Magnifed fundus autofluorescence image of the macula shows part of the high-density fundus autofluorescence ring at the nasal retina [arrowheads in (B)]. The temporal inner border of the ring is indicated by an arrowhead (B). The adaptive optics panoramic image of a 5.9 × 1.1 mm area appears as a blurred region with some dark patchy areas at the nasal side of the high-density fundus autofluorescence ring (arrowheads in C). A panoramic cone density map of the same area as in (C) shows low densities at the nasal ring [arrowheads in (D)]. Bar = 200 um (A-C).
Abbreviation: OCT, optical coherence tomography.
![Figure 6 Macular images of OCT (A), fundus autofluorescence (B), adaptive optics (C), and the panoramic cone density map (D) of the right eye in case 2. The OCT image shows the border of the inner segment and outer segment line and the external limiting membrane at the arrowheads (A). Magnifed fundus autofluorescence image of the macula shows part of the high-density fundus autofluorescence ring at the nasal retina [arrowheads in (B)]. The temporal inner border of the ring is indicated by an arrowhead (B). The adaptive optics panoramic image of a 5.9 × 1.1 mm area appears as a blurred region with some dark patchy areas at the nasal side of the high-density fundus autofluorescence ring (arrowheads in C). A panoramic cone density map of the same area as in (C) shows low densities at the nasal ring [arrowheads in (D)]. Bar = 200 um (A-C).](/cms/asset/de8f5b75-4111-43cd-b0b6-1a33308a06c5/doph_a_39879_f0006_c.jpg)
Four 200 × 200 μm areas at the nasal or temporal retina () were selected (avoiding large retinal vessels) and analyzed using the manufacturer’s software. The nasal area was selected at the inside of the blurred ring (N1000) and at the border of the ring (N2000). The temporal areas (T1000 and T2000) were selected at the same distance as the two nasal areas. The N1000 and T1000 distances were 1000 μm from the foveal center, and those of N2000 and T2000 were 2000 μm from the foveal center. The results for the three types of cone analyses at the four areas are shown in , and the data are shown in . The mean densities of the cone photoreceptors were lower at T1000, N1000, and N2000 than for the healthy controls (). Because the temporal part of the fundus autofluorescence ring was not clear, the number of cone photoreceptors remained the same as that in the healthy controls at T2000 in case 2. The results for the spacing and Voronoi domains were correlated with those of the densities.
Figure 7 Cone analyses of the parafoveal areas in case 2.
Abbreviation: F, foveal center.
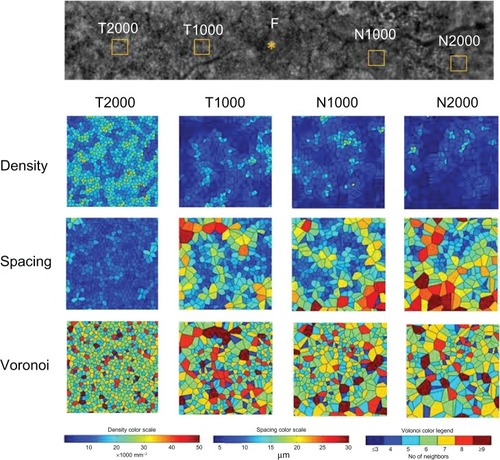
Table 2 results of cone analyses at four areas in the macula of the right eye in case 2 and healthy control eyes
Discussion
Retinitis pigmentosa causes progressive degeneration of photoreceptors and the retinal pigment epithelium. These changes were observed as an abnormal parafoveal ring of high-density or low-density fundus autofluorescence at the macula by fundus autofluorescence imaging in patients with retinitis pigmentosa.Citation2,Citation3,Citation8 In fact, previous studies have reported that an abnormal parafoveal ring of high-density fundus autofluorescence was observed in more than half of patients with retinitis pigmentosa studied.Citation2,Citation5 The high-density parafoveal fundus autofluorescence ring area represented a transition between the functional and dysfunctional retina, and the diameter and area of the high-density fundus autofluorescence ring were significantly correlated with retinal sensitivity and lengths of the IS/OS line and cone outer segment tips line in patients with retinitis pigmentosa.Citation2,Citation5,Citation6
In the present study, we used an adaptive optics fundus camera to observe cone photoreceptors in vivo and showed that the blurred areas of cone mosaics in adaptive optics images corresponded to the high-density fundus autofluorescence ring in the fundus autofluorescence images and to the border of the external limiting membrane and the IS/OS line in OCT images. Because a previous histological studyCitation9 found that the foveal center had high cone densities of 100,000–324,000/mmCitation2, we concluded that the adaptive optics fundus camera did not have sufficient resolution to distinguish between individual cones at the foveal center. Therefore, cone analyses at the foveal center were not performed. Loss of the external limiting membrane, IS/OS line, and cone outer segment tips line in the OCT images may represent loss of cell bodies of photoreceptors, which appeared as dark patchy areas without cone mosaics or blurred reflections in adaptive optics images in case 1. The area with a detectable external limiting membrane in the OCT images showed decreased cone mosaics and blurred reflections in adaptive optics images as well as relatively normal autofluorescence in fundus autofluorescence images. However, as shown in and , the areas outside of the high density fundus autofluorescence ring (T1100 and N1300 in case 1 and T2000 in case 2) showed higher densities than those at the ring (T600 and N600 in case 1 and T1000 in case 2). We compared the results of cone analyses for the five healthy control eyes and two eyes of patients with retinitis pigmentosa using the same manufacturer’s software. Although the high-density fundus autofluorescence ring corresponded to the area with low cone densities, the nasal area of case 1 (N1300) and the temporal area of case 2 (T2000) in the region outside of the ring showed relatively normal cone densities that corresponded to the cone density maps in both cases. These results suggest that degeneration of photoreceptors might occur unevenly in retinitis pigmentosa, even though a high-density fundus autofluorescence ring was observed.
Histopathological studies of retinitis pigmentosa have shown that dysfunction of the rods precedes that of the cones and that the shortening of the rod outer segments and photoreceptor cell death occur at the mid-peripheral retina.Citation1,Citation10 Photoreceptors in all types of retinitis pigmentosa were decreased at the parafoveal areas by up to 1.5 mm compared with normal retinas.Citation8 After the death of photoreceptors, the retinal pigment epithelium migrates into the inner retina, and the processes of Mueller cells become hypertrophied.Citation1
In both of the cases reported here, the cone densities were decreased in a wide area of the temporal and nasal retina. Cone spacing and Voronoi analyses showed similar abnormalities. In the cone density maps of both cases, more cones were observed in nasal areas outside of the ring (N1300 in case 1) and in the temporal area of the parafoveal high-density fundus autofluorescence ring (T2000 in case 2), suggesting that the rate of loss of photoreceptors might be different in the nasal area from that in the temporal area. The patchy dark areas around the fovea in the adaptive optics images may represent a loss of photoreceptors and proliferation of retinal pigment epithelium.
In this study we demonstrated that cone photoreceptors were decreased in the macula of patients with retinitis pigmentosa and especially at the abnormal high-density fundus autofluorescence ring using an adaptive optics fundus camera. The abnormal findings on OCT and fundus autofluorescence images were correlated with the decrease in cone photoreceptors shown by adaptive optics images. The results suggest that adaptive optics images may have advantages for visualizing the horizontal distribution of cone photoreceptors and increasing our understanding of the pathophysiology of retinitis pigmentosa. Further studies using adaptive optics fundus imaging are needed to evaluate successive changes in the cone photoreceptors of patients with retinitis pigmentosa over the long term.
References
- MilamAHLiZYFarissRNHistopathology of the human retina in retinitis pigmentosaProg Retin Eye Res1998171752059695792
- MitamuraYMitamura-AizawaSNagasawaTKatomeTEguchiHNaitoTDiagnostic imaging in patients with retinitis pigmentosaJ Med Invest20125911122449988
- WakabayashiTSawaMGomiFTsujikawaMCorrelation of fundus autofluorescence with photoreceptor morphology and functional changes in eyes with retinitis pigmentosaActa Ophthalmol201088177183
- KellnerUKellnerSWeberBHFFiebigBWeinitzSRuetherKLipofuscin- and melanin-related fundus autofluorescence visualize different retinal pigment epithelial alterations in patients with retinitis pigmentosaEye2009231349135918791550
- MurakamiTAkimotoMOotoSAssociation between abnormal autofluorescence and photoreceptor disorganization in retinitis pigmentosaAm J Ophthalmol200814568769418242574
- AizawaSMitamuraYHagiwaraASugawaraTYamamotoSChanges of fundus autofluorescence, photoreceptor inner and outer segment junction line, and visual function in patients with retinitis pigmentosaClin Experiment Ophthalmol20103859760420456441
- DuncanJLZhangYGandhiJHigh-resolution imaging with adaptive optics in patients with inherited retinal degenerationInvest Ophthalmol Vis Sci2007483283329117591900
- LenassiETroegerEWilkeRHawlinaMCorrelation between macular morphology and sensitivity in patients with retinitis pigmentosa and hyperautofluorescent ringInvest Ophthalmol Vis Sci201253475222110079
- CurcioCASloanKRKalinaREHendricksonAEHuman photoreceptor topographyJ Comp Neurol19902924975232324310
- StoneJLBarlowWEHumayunMSde JuanEJrMilamAHMorphometric analysis of macular photoreceptors and ganglion cells in retinas with retinitis pigmentosaArch Ophthalmol1992110163416391444925