
Abstract
Purpose
Spectral domain optical coherence tomography (SD-OCT) with posterior pole asymmetry analysis (PPAA) provides a mapping of posterior pole retinal thickness with asymmetry analysis between hemispheres of each eye. We investigated whether these structural abnormalities were correlated with functional retinal ganglion cell (RGC) loss, quantified by steady state pattern electroretinogram (ssPERG), in glaucoma suspects (GS).
Methods
Twenty GS (34 eyes) were enrolled in a prospective study at the Manhattan Eye, Ear, and Throat Hospital. All subjects underwent ophthalmological examination, including Humphrey visual field, Spectralis Glaucoma Module Premium Edition (GMPE) SD-OCT PPAA, and ssPERG testing. The ability of ssPERG parameters (Magnitude [Mag, µv], MagnitudeD [MagD, µv], and MagD/Mag ratio) to predict PPAA thickness (total, superior, and inferior thickness, [µm]) was tested via adjusted multivariate linear regression analysis.
Results
Mag explained 8% of variance in total PPAA change (F(1,29)=6.33, B=6.86, 95% CI: 1.29–12.44, p=0.018), 8% in superior PPAA change (F(1,29)=5.57, B=6.92, 95% CI: 0.92–12.92, p=0.025), and 7.1% in inferior PPAA change (F(1,29)=5.83, B=6.80, 95% CI: 1.04–12.56, p=0.022). Similarly, MagD explained 9.7% of variance in total PPAA change (F(1,29)=8.09, B=6.47, 95% CI: 1.82–11.13, p=0.008), 10% in superior PPAA change (F(1,29)=7.33, B=6.63, 95% CI: 1.62–11.63, p=0.011), and 8.5% in inferior PPAA change (F(1,29)=7.25, B=6.36, 95% CI: 1.53–11.18, p=0.012). MagD/Mag ratio and PPAA were not significantly associated.
Conclusion
To the best of our knowledge, this is the first study demonstrating a positive relationship between RGC dysfunction and retinal thickness changes between the superior and inferior hemispheres. The detection of asymmetrical structural loss, combined with functional RGC assessment using ssPERG, may be an informative tool for early glaucoma diagnosis.
Keywords:
Introduction
Glaucoma is a neuropathy of the optic nerve characterized by progressive damage to the fibers and cell bodies of the retinal ganglion cells (RGC).Citation1 Glaucomatous damage produces thinning of the RGC and retinal nerve fiber layer (RNFL) layers, and structural changes in optic nerve head (ONH) morphology, and many of these changes can be identified prior to RGC cell death.Citation2,Citation3 However, as the disease initially presents asymptomatically with an occult period, progressive cupping of the disc and thinning of the RNFL may already be present in these patients. Estimates suggest 25–33% of RGCs must be lost prior to producing any significant visual field abnormality.Citation4 As glaucoma is one of the major global proponents of irreversible vision loss, investigations into different modalities to identify early glaucomatous changes and limit progression have been of utmost interest. Standard automated perimetry (SAP) became the gold standard for diagnosing glaucoma and detecting its progression, but because of known anatomic reasons, glaucomatous field loss is not symmetric across the horizontal meridian.Citation5 Asman et al concluded that using a glaucoma hemifield test, which used two hemifields separated by the horizontal meridian, was beneficial to differentiate between localized losses seen in early glaucoma and diffuse losses that are often caused by media opacity or miotic therapy.Citation5
Currently, another modality is used in glaucoma diagnosis, which is RNFL thickness measurement by means of spectral domain optical coherence tomography (SD-OCT). One shortcoming of this method is that the parameters of the OCT is limited to a 3.5 mm distance from the center of the ONH.Citation6 Additionally, automatic demarcation of the ONH borders may be inaccurate, particularly in patients with peripapillary atrophy (PPA) and different sized discs.Citation7 Localized neuroretinal rim (NRR) and optic cup changes might also be missed by interpolation algorithms.Citation2,Citation7 More recently, a new protocol of OCT has been proposed: posterior pole asymmetry analysis (PPAA). The goal of PPAA is to detect early glaucomatous changes in the posterior pole that may be missed by RNFL measurements.Citation8–10 PPAA reveals not only the retinal thickness of each cell but also provides the retinal thickness asymmetry (RTA) that exists between the superior and inferior corresponding cells across the horizontal meridian.
Several studies have evaluated the reproducibility of the PPAA in comparison to RNFL thickness measurements, and they reported that the reproducibility of PPAA exceeded that of established RNFL thickness measurements in normal and glaucomatous eyes.Citation6,Citation11 The RTA analyses may also be significant, as studies have noted RTA increased when contrasting glaucomatous eyes with healthy eyes.Citation5 Though the specific zones to be analyzed are still being investigated, as between-subject variability exists, macular thickness PPAA parameters have been reported as equally effective as RNFL parameters, and early studies are promising in noting changes to the retinal thickness at earlier stages within the posterior pole, where asymmetry or glaucoma-associated changes could be missed by SD-OCT.Citation12–15 Studies by Nakatani et al used PPAA in early glaucoma subjects and they concluded that PPAA parameters had high discriminating power and high reproducibility comparable with peripapillary RNFL thickness measurements.Citation16 Another study reported that PPAA and the presence of asymmetry between superior and inferior retinas had a better diagnostic sensitivity than average peripapillary RNFL thickness measurements in the early stages of glaucoma, but no such studies were conducted in GS.Citation17
Another imaging modality that has been investigated in the diagnosis and progression monitoring of glaucoma is pattern electroretinogram (PERG). PERG has the ability to objectively assess RGC function in glaucoma, ocular hypertension, and glaucoma suspects.Citation18 One study by Porciatti et al found a correlation between ssPERG and average RGC receptive field size in human eyes.Citation19 An important study by Banitt et al reported that an 8-year delay exists from a 10% change in PERG amplitude to a 10% decline in RNFL thickness in GS.Citation20 Moreover, PERG can identify functional changes that occur prior to the structural changes detected by SD-OCT.Citation18,Citation21–23 implying that PERG is promising imaging modality.Citation22,Citation24 Furthermore, new studies investigating visual field hemifields in glaucomatous eyes and their associations with retinal blood flow (RBF) concluded that RBF was not only reduced in the retinal hemisphere that was associated with the abnormal hemifield, but it was also associated with thinner RNFL and ganglion cell complex (GCC). Reduced RBF and GCC loss were also observed in the contralateral, perimetrically normal retinal hemisphere.Citation25
Based on this background, the question we sought to answer was whether the structural abnormalities that are identified in PPAA correlated to functional RGC loss as quantified by steady state PERG (ssPERG) parameters in GS. No study to our knowledge has assessed this relationship.
Methods
Twenty GS participants (34 eyes) with suspicious ONH and normal Humphrey 24-2 VF (HVF) were consecutively enrolled in a cross-sectional study at the Manhattan Eye, Ear, and Throat Hospital at Northwell Health as part of a larger longitudinal study in glaucoma. Subjects received comprehensive ophthalmologic examination, HVF, ssPERG tests via Diopsys® NOVA PERG (Diopsys®, Inc. Cedar Knolls, NJ), and OCT imaging by means of SPECTRALIS® OCT Glaucoma Module Premium Edition PPAA (Heidelberg Engineering, Inc. Heidelberg, Germany). The study received approval from the Northwell Health System’s Institutional Review Board. All subjects signed written informed consent and all parameters of the study followed the Declaration of Helsinki.
Participants with a suspicious glaucomatous ONH, defined as C:D ratio of greater than 0.2 between fellow eyes, thinning of the neuro-retinal, or notching, and a normal Humphrey Field Analyzer (HFA) 24-2 Swedish Interactive Thresholding Algorithm (SITA)-standard test, were classified as GS. Subjects aged 20–80, with BCVA (best corrected visual acuity) greater than or equal to 20/40, spherical refraction within 6.0 D and cylinder correction within 3.0 D were included to circumvent the effects of refractive errors on PERG parameters.Citation26 Furthermore, only subjects with no VF loss (stage zero), based on the Glaucoma Staging System (GSS 2), were enrolled.Citation27 The following criteria were considered for exclusion: Participants with fixation losses, false positive or negative rates exceeding 20%, history of ocular surgery except uncomplicated cataract extraction, or trauma. Finally, OCT images with poor quality or inadequate algorithm segmentation were not also considered.
Pattern Electroretinography Testing
The steady state (ssPERG) was recorded using a commercially available system, Diopsys® NOVA PERG device (Diopsys®, Inc. Cedar Knolls, NJ), following the PERGLA protocol previously described.Citation28–32 In order to isolate the component at 15 reversals per second, an automatic Fast Fourier transformation (FFT) was utilized on the PERG waveforms. The ssPERG test results were saved in a Structured Query Language (SQL) database and presented in a report form to be used for analysis. Three measurements from PERG were provided and collected for the analysis of each eye. These included magnitude (Mag), Magnitude D (MagD), and the ratio of the two (MagD/Mag).
Posterior Pole Asymmetry Analysis
Posterior pole asymmetry analysis between hemispheres of each eye was conducted using the Spectralis OCT Glaucoma Module Premium Edition PPAA (Heidelberg Engineering, Inc. Heidelberg, Germany) and was described in previous studies.Citation8 In summary, a customized retinal thickness measurement protocol was utilized to grant high-density measurements in the macular region. The software provided posterior pole thickness maps and displayed the retinal thickness over the entire posterior pole (30°x25° OCT volume scan) for each eye, with retinal thickness values of 64 (8x8) cells within each eye. Compressed color scale was used to localize the smallest differences in retinal thickness measurements. An 8×8 grid was positioned symmetrically to the fovea-disc axis and the mean retinal thickness for each cell of the grid was displayed.Citation33
The hemisphere analysis displayed the asymmetry between the superior and inferior hemisphere. Using the fovea-disc axis as the horizontal symmetry line, the mean retina thickness of each cell of one hemisphere was compared to the thickness value in the corresponding cell of the opposite hemisphere. Superior (S)-inferior (I) and I-S hemisphere asymmetry analysis was provided, as well as numerical values for mean thicknesses (total, superior and inferior) for future analysis. Right eye-left eye asymmetry analysis, provided by the device was not used in this study. RNFL thickness measurements, such as global, quadrant and sector thickness measurements were provided as well.Citation13
Statistical Analysis
Demographic data from this study were reported using descriptive statistics and the mean and standard deviations were calculated for each ssPERG, HFA SITA-Standard (24-2) tests, and all PPAA parameters (superior, inferior, and total). Outliers with values greater than or equal to three standard deviations were not included. Normality of distribution was calculated using Shapiro–Wilk test. The Pearson correlation analysis was used to detect associations between circumpapillary global retinal nerve fiber layer (gRNFL) thickness and PPAA measurements. In the prediction of the PPAA thickness measurements (total, superior and then inferior), nine consecutive linear regression models were used, where age, spherical equivalent (SE) and central corneal thickness (CCT) were entered in step 1 of the model as covariates, then PERG parameters (Mag, then MagD and then MagD/Mag ratio) were entered as predictors in step 2. Statistical analyses were performed using IBM® SPSS® version 28; SPSS Inc, Chicago, IL, USA).
Results
Thirty-four glaucoma suspect (GS) eyes (20 patients) were included in the study. The mean age was 60.15 ± 13.01 years, with 66.6% females. The mean intraocular pressure (IOP) was 17.49 ± 3.84 mmHg, and 24-2 mean deviation (MD) was −0.17dB and 24-2 visual field index (VFI) of 100%. Correlation analysis revealed significant correlations between all three PPAA measurements with global RNFL (gRNFL) (p<0.001, r>0.646), superior RNFL quadrant (p<0.001, r>0.583), temporal RNFL quadrant (p<0.013, r>0.360), inferior RNFL quadrant (p<0.001, r>0.513), nasal RNFL quadrant (p<0.001, r>0.469), as well as with the following RNFL thickness sectors: nasal superior (p<0.022, r>0.334), temporal superior (p<0.001, r>0.593), and temporal inferior (p<0.001, r>0.630). No significant correlations were found between PPAA thickness measurements and nasal inferior sector.
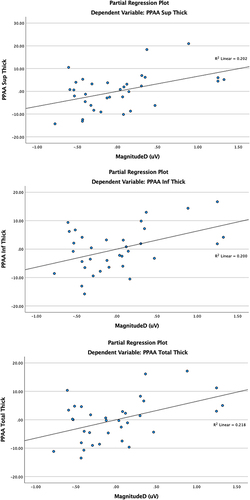
After controlling for age, spherical equivalent (SE), and central corneal thickness (CCT), total, superior, and inferior PPAA parameters were independently analyzed against ssPERG parameters. Mag explained 8% of variance in total PPAA change (F(1,29)=6.33, B=6.86, 95% CI: 1.29–12.44, p=0.018), 8% in superior PPAA change (F(1,29)=5.57, B=6.92, 95% CI: 0.92–12.92, p=0.025), and 7.1% in inferior PPAA change (F(1,29)=5.83, B=6.80, 95% CI: 1.04–12.56, p=0.022) (). In a similar model, replacing Mag by MagD as the independent variable, MagD explained 9.7% of variance in total PPAA change (F(1,29)=8.09, B=6.47, 95% CI: 1.82–11.13, p=0.008), 10% in superior PPAA change (F(1,29)=7.33, B=6.63, 95% CI: 1.62–11.63, p=0.011), and 8.5% in inferior PPAA change (F(1,29)=7.25, B=6.36, 95% CI: 1.53–11.18, p=0.012) (). No significant associations between MagD/Mag ratio and PPAA measures were found. The significant relationships between PPAA thickness measurements (total, superior and inferior) PERG parameters (Mag and MagD) are represented in . Significant relationships between PPAA and MagD/Mag ratio were not detected.
Table 1 Associations of Magnitude (μV) and PPAA Measurements, Controlling for Age, SE and CCT
Table 2 Associations of MagnitudeD (μV) and PPAA Measurements, Controlling for Age, SE and CCT
Figure 1 Significant associations between Magnitude (μV) and PPAA superior thickness, inferior thickness, and total thickness. Best fit regression lines and R2 values are shown.
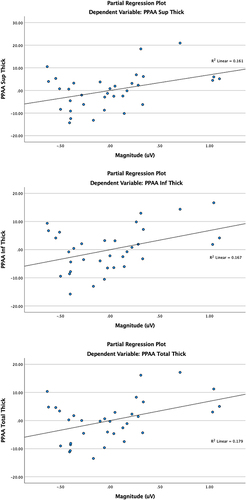
Figure 2 Significant associations between MagnitudeD (μV) and PPAA superior thickness, inferior thickness, and total thickness. Best fit regression lines and R2 values are shown.
Discussion
In this study, we investigated whether RGC dysfunction, measured by ssPERG, correlated with structural retinal thickness changes at the posterior pole, using PPAA in GS. We found that ssPERG parameters Mag and MagD significantly explained up to 10% of variance in total, superior, and inferior PPAA. Furthermore, MagD was a stronger predictor than Mag in explaining variance in all three PPAA measures. These findings suggest that PPAA, along with ssPERG, may pick up glaucomatous damage earlier than conventional techniques in GS, and its use in the clinical setting should therefore be considered.Citation34
In glaucoma suspects with suspicious ONH but normal RNFL thickness and normal Humphrey visual fields, ssPERG can detect abnormalities that may otherwise be missed until later in the disease course.Citation35–37 Banitt et al reported an 8-year delay from a 10% change in ssPERG amplitude to a 10% decline in RNFL thickness in GS.Citation20 Moreover, Jeon et al previously described positive relationships between ssPERG amplitude and cup morphology and RNFL thickness.Citation21 Another study reported that ssPERG abnormalities may have utility in predicting rim area loss in preperimetric glaucoma, after disc area is accounted for.Citation32 Based on these findings, we hypothesize that degenerative RGCs undergo degenerative and morphologic changes, including RGC soma shrinkage, reductions in the dendritic tree, and thinning of their axons, likely predating irreversible ganglion cell death and apoptosis. Our laboratory has demonstrated a linear relationship between ssPERG and estimated RGC count in GS, and the association among ssPERG and structural measures were mediated by estimated RGC count.Citation31
Many recent studies have demonstrated the presence of an inter-eye variability in RNFL thickness parameters among glaucoma subjects.Citation38 Some studies have reported an association of inter-eye visual-sensitivity asymmetry with progression of primary open-angle glaucoma.Citation39 Leading up to the introduction of PPAA, several studies reported that the evaluation of macular thickness could be an effective method to evaluate for glaucomatous damage.Citation40–42 The pathophysiologic basis of the PPAA protocol is that in open-angle glaucoma, because of increased intraocular pressure, early glaucomatous damage is typically localized to either the superior or inferior side of the horizontal meridian, and rarely both simultaneously. In normal tension glaucoma, this asymmetry in hemifields is not seen; instead, centralized defects around the central macular region are observed.Citation43 Therefore, a comparison of the asymmetry between the two hemifields could be an indicator of early glaucomatous damage.Citation7 After accounting for confounding factors, we found that MagD was a better predictor of explaining variance in all three PPAA measurements ( and ). These findings appear to support the hypothesis that RGC dysfunction, assessed by means of MagD, is associated with degenerative morphological changes in RGCs, leading to losses in posterior pole thickness.Citation29–32 Ganglion soma shrinkage, trimming of the dendritic tree, and reductions in axonal diameters contribute to the structural changes measured by PPAA technique. RGC death (by means of Mag) also contributed to the structural loses found in PPAA, but to a lesser extent ( and ). These techniques can be used to detect glaucomatous progression prior to irreversible cellular death.
As a part of this study, we conducted a literature review of prior studies that examined the utility of PPAA in the diagnosis of glaucoma. The earliest report we found was by Seo et al from 2012, which found that PPAA could detect early localized RNFL defects in glaucoma suspects with high sensitivity and specificity, which is in line with our findings and hypothesis that PPAA may have early diagnostic utility in glaucoma suspects.Citation11 A later study by Zha et al compared PPAA and peripapillary RNFL thickness measurements between primary angle-closure suspects (PAGS) and age, sex, IOP, and axial length-matched normal subjects.Citation14 They found that the former group showed significantly thinner macular retinal thickness on posterior pole and a larger asymmetry on PPAA analysis, when compared with the control group, but no significant differences on RNFL parameters were found. In our view, these findings could be explained by the fact that PPAA could possibly better discriminate glaucomatous damage before RNFL, exhibiting a higher sensitivity for early glaucoma diagnosis. Another possible explanation could lay in the recruitment procedure since control group had a lower VF MD by 33%, which could lower RNFL ability to discriminate the disease, and improve PPAA sensitivity even higher.Citation14
These findings align with and further augment the importance of this study, highlighting the clinical utility of PPAA in GS with normal RNFL thicknesses. As previously described, one important shortcoming of OCT RNFL, including the RNFL thickness measurements based on anatomic positioning system (APS), is that it is limited to a 3.5 mm, 4.1 mm, or 4.7 mm scan diameters (10° central), while PPAA evaluates a wider area of potential glaucomatous damage (30°x25°).Citation6,Citation44
The study findings are also consistent with a subsequent report by Kim et al who conducted a structure-function analysis using PPAA and visual field sensitivity from SAP as a proxy for cellular function.Citation9 The researchers found that visual field sensitivity had a significant reciprocal relationship in its corresponding posterior pole thickness at all test points; notably, the strength of the relationship varied by location and was strongest in the arcuate region.Citation9 Although these results appear promising, SAP glaucoma detection is delayed by 8 years when compared to the objective RGC functional assessment by ssPERG.Citation19 Additionally, it can be challenging to correlate the visual field test points to the PPAA measurement (curvilinear or logarithmic relationship), a limitation that is better addressed by ssPERG measurements.Citation27,Citation45
Porciatti et al reported that Mag and phase were essentially uncoupled, meaning that these two measures indicate different aspects of RGC physiology.Citation46 Therefore, each parameter can be used in the analysis separately. They also point out that PERG is spatially tuned, having a clear maximum of intermediate spatial frequencies of 15 Hz.Citation47 Our device utilizes this technology developed by Porciatti et al with the maximum RGC response at 15 Hz. The ssPERG device provided three parameters, Mag, MagD, and the ratio between the two. It is important to consider that MagD/Mag ratio did not significantly impact PPAA variance. As discussed earlier, Mag corresponds to the strength of the RGC response in response to a patterned stimulus, while MagD correlates with RGC response that is adjusted to phase or latency. However, given that both Mag and MagD explained a significant amount of variance in PPAA, it is plausible that the lack of relationships between MagD/Mag ratio and PPAA measures could be explained by the equal change of the numerator and denominator of the ratio, in the same direction. When Mag and MagD are changing equally, it is possible that MagD/Mag ratio could have a lower sensitivity to diagnose RGC dysfunction. Some additional strengths of our model include that we adjusted for variables that could potentially confound the ssPERG and PPAA relationship, including age, SE, and CCT. Importantly, many of these factors have been associated with variable ganglion cell layer thickness and adjusting for these factors further strengthens our model.Citation48,Citation49
In recent years, vascular risk factors have been suggested to be significant contributors to the development and progression of glaucoma and visual field loss.Citation50,Citation51 Other studies have shown that primary open angle glaucoma was associated with diminished blood flow in the optic nerve head, choroid and retina.Citation50,Citation52 Several studies have reported significant associations between the attenuations of retinal vessels and the severity of glaucomatous damage.Citation25 Other studies have demonstrated the association of retinal caliber with the 10-year incidence of glaucoma,Citation53 and with RNFL thickness.Citation54,Citation55 Our team has demonstrated a significant reduction in retinal vessel diameter in GS and its association with RGC dysfunction, measured by means of PERG.Citation56 We have also reported that abnormal ssPERG parameters were associated with enlarged foveolar avascular zone (FAZ) and with reduced macular and peripapillary vessel density in GS.Citation57,Citation58 These studies have demonstrated that ssPERG was associated with markers of microvascular abnormalities in preperimetric and in GS, underlying the presence of neurovascular uncoupling between the blood supply and demand in the RGC.Citation52 Another strength of this study is that it demonstrated the presence of RGC dysfunction, most likely associated with the disturbance of autoregulation, an unstable ocular blood flow and an increased oxidative stress,Citation52 leading to the morphological RGC changes that could be measured by OCT. While comparing the location of measurements between macular region (PPAA) and circumpapillary area (RNFL), PPAA can measure the ganglion cell complex (soma and dendritic trees) and RNFL thickness combined, as opposed to just measuring the nerve fiber layer (RGC axons), giving this methodology a slight advantage. This study findings confirm that the functional alterations of RGC are established before the anatomical structural damage.Citation59
Another advantage of this study was the PPAA retinal coverage area of 30°x25° OCT volume scan, when compared to standard macular thickness scan of central 10°. This advantage provided not only a more accurate retinal thickness assessment of the posterior pole, including the para-papillary region, but it also compared the superior versus inferior hemispheres across the fovea-disc axis (horizontal symmetry line).Citation33 Furthermore, the lower hemisphere has a higher risk for vascular dysregulation due to anatomical reasons leading to asymmetrical retinal functional and structural changes across the horizontal meridian.Citation5 Another advantage of this study was the function-structure assessment using ssPERG, demonstrating a significant association between the dysfunctional RGCs and their morphological changes contributing to structural alterations in the posterior pole, and possibly depending on supply/demand balance (neurovascular coupling) in this region.Citation52
This study has some limitations that should be addressed. Firstly, we present a cross-sectional analysis which does not shed light on longitudinal glaucomatous progression. The sample size was also relatively small, and future randomized studies in larger patient sizes are necessary to confirm our findings. A sector or hemi-PERG evaluation could bring new light to this investigation. However, despite these limitations, our findings suggest that the functional decline in RGC function explains a significant amount of variance in posterior pole thickness, indicating the potential utility of PPAA in combination with ssPERG for the diagnosis of early glaucoma.
Conclusion
This is the first study to report a significant positive correlation between RGC dysfunction and structural thickness losses assessed by means of PPAA analysis. After controlling for age, spherical equivalent (SE), and central corneal thickness (CCT), Mag and MagD parameters significantly explained the variance in total, superior, and inferior PPAA measurements. These findings demonstrate possible morphological changes in RGCs that occur prior to cell death, including reductions in the dendritic tree, decrease in soma size, and thinning of the RNFL. These are positively correlated with the detection of asymmetrical structural RGC loss, combined with RGC dysfunction, suggesting ssPERG to be an informative tool for early glaucoma diagnosis in glaucoma suspects.
Ethical Approval
The study received approval from the Northwell Health System’s Institutional Review Board. All parameters of the study followed the Declaration of Helsinki.
Informed Consent
All subjects signed written informed consent.
Disclosure
CT and AT are consultants for Diopsys Inc. The authors report no other conflicts of interest in this work.
Acknowledgment
The abstract of this paper was presented at the ARVO Meeting 2022 in Denver, CO, as a poster presentation. The poster’s abstract was published in ‘Poster Abstracts’ in Investigative Ophthalmology & Visual Science https://iovs.arvojournals.org/article.aspx?articleid=2779520.
Additional information
Funding
References
- Weinreb RN, Aung T, Medeiros FA. The pathophysiology and treatment of glaucoma: a review. JAMA. 2014;311(18):1901–1911. doi:10.1001/jama.2014.3192
- Jonas JB, Budde WM. Diagnosis and pathogenesis of glaucomatous optic neuropathy: morphological aspects. Prog Retin Eye Res. 2000;19(1):1–40. doi:10.1016/S1350-9462(99)00002-6
- Fry LE, Fahy E, Chrysostomou V, et al. The coma in glaucoma: retinal ganglion cell dysfunction and recovery. Prog Retin Eye Res. 2018;65:77–92. doi:10.1016/j.preteyeres.2018.04.001
- Kerrigan-Baumrind LA, Quigley HA, Pease ME, Kerrigan DF, Mitchell RS. Number of ganglion cells in glaucoma eyes compared with threshold visual field tests in the same persons. Invest Ophthalmol Vis Sci. 2000;41(3):741–748.
- Asman P, Heijl A. Glaucoma hemifield test. Automated visual field evaluation. Arch Ophthalmol. 1992;110(6):812–819. doi:10.1001/archopht.1992.01080180084033
- Kochendörfer L, Bauer P, Funk J, Töteberg-Harms M. Posterior pole asymmetry analysis with optical coherence tomography. Klin Monbl Augenheilkd. 2014;231(4):368–373. doi:10.1055/s-0034-1368213
- Sathyan P, Shilpa S, Anitha A. Optical Coherence Tomography in Glaucoma. J Curr Glaucoma Pract. 2012;6(1):1–5. doi:10.5005/jp-journals-10008-1099
- Hua R, Gangwani R, Guo L, et al. Detection of preperimetric glaucoma using Bruch membrane opening, neural canal and posterior pole asymmetry analysis of optical coherence tomography. Sci Rep. 2016;6(1):21743. doi:10.1038/srep21743
- Kim JM, Sung KR, Yoo YC, Kim CY. Point-wise relationships between visual field sensitivity and macular thickness determined by spectral-domain optical coherence tomography. Curr Eye Res. 2013;38(8):894–901. doi:10.3109/02713683.2013.787433
- Khanal S, Davey PG, Racette L, Thapa M. Intraeye retinal nerve fiber layer and macular thickness asymmetry measurements for the discrimination of primary open-angle glaucoma and normal tension glaucoma. J Optom. 2016;9(2):118–125. doi:10.1016/j.optom.2015.10.002
- Seo JH, Kim T-W, Weinreb RN, Park KH, Kim SH, Kim DM. Detection of localized retinal nerve fiber layer defects with posterior pole asymmetry analysis of spectral domain optical coherence tomography. Invest Ophthalmol Vis Sci. 2012;53(8):4347–4353. doi:10.1167/iovs.12-9673
- Zhang Y, Li N, Chen J, Wei H, Jiang SM, Chen XM. A new strategy to interpret OCT posterior pole asymmetry analysis for glaucoma diagnosis. Int J Ophthalmol. 2017;10(12):1857–1863. doi:10.18240/ijo.2017.12.11
- Dave P, Shah J. Diagnostic accuracy of posterior pole asymmetry analysis parameters of spectralis optical coherence tomography in detecting early unilateral glaucoma. Indian J Ophthalmol. 2015;63(11):837–842. doi:10.4103/0301-4738.171965
- Zha Y, Huang W, Zhuang J, Cai J. Posterior pole asymmetry analysis and retinal nerve fibre layer thickness measurements in primary angle-closure suspect patients. BMC Ophthalmol. 2019;19(1):36. doi:10.1186/s12886-019-1034-0
- Asrani S, Rosdahl JA, Allingham RR. Novel software strategy for glaucoma diagnosis: asymmetry analysis of retinal thickness. Arch Ophthalmol. 2011;129(9):1205–1211. doi:10.1001/archophthalmol.2011.242
- Nakatani Y, Higashide T, Ohkubo S, Takeda H, Sugiyama K. Evaluation of macular thickness and peripapillary retinal nerve fiber layer thickness for detection of early glaucoma using spectral domain optical coherence tomography. J Glaucoma. 2011;20(4):252–259. doi:10.1097/IJG.0b013e3181e079ed
- Um TW, Sung KR, Wollstein G, Yun S-C, Na JH, Schuman JS. Asymmetry in hemifield macular thickness as an early indicator of glaucomatous change. Invest Ophthalmol Vis Sci. 2012;53(3):1139–1144. doi:10.1167/iovs.11-8373
- Fiorentini A, Maffei L, Pirchio M, Spinelli D, Porciatti V. The ERG in response to alternating gratings in patients with diseases of the peripheral visual pathway. Invest Ophthalmol Vis Sci. 1981;21(3):490–493.
- Porciatti V. The mouse pattern electroretinogram. Doc Ophthalmol. 2007;115(3):145–153. PMID: 17522779; PMCID: PMC2773675. doi:10.1007/s10633-007-9059-8
- Banitt MR, Ventura LM, Feuer WJ, et al. Progressive loss of retinal ganglion cell function precedes structural loss by several years in glaucoma suspects. Invest Ophthalmol Vis Sci. 2013;54(3):2346–2352. doi:10.1167/iovs.12-11026
- Jeon SJ, Park HL, Jung KI, Park CK. Relationship between pattern electroretinogram and optic disc morphology in glaucoma. PLoS One. 2019;14(11):e0220992. doi:10.1371/journal.pone.0220992
- Bach M, Unsoeld AS, Philippin H, et al. Pattern ERG as an early glaucoma indicator in ocular hypertension: a long-term, prospective study. Invest Ophthalmol Vis Sci. 2006;47(11):4881–4887. doi:10.1167/iovs.05-0875
- Turkey E, Elsanabary ZSE, Elshazly LHM, Osman MH. Role of pattern electroretinogram in ocular hypertension and early glaucoma. J Glaucoma. 2019;28(10):871–877. doi:10.1097/IJG.0000000000001325
- Ventura LM, Porciatti V, Ishida K, Feuer WJ, Parrish RK. Pattern electroretinogram abnormality and glaucoma. Ophthalmology. 2005;112(1):10–19. doi:10.1016/j.ophtha.2004.07.018
- Sehi M, Goharian I, Konduru R, et al. Retinal blood flow in glaucomatous eyes with single-hemifield damage. Ophthalmology. 2014;121(3):750–758. doi:10.1016/j.ophtha.2013.10.022
- Lim XH, Nongpiur ME, Najjar RP, et al. Steady-state pattern electroretinography in eyes with glaucoma and high myopia. Clin Ophthalmol. 2021;15:4455–4465. doi:10.2147/OPTH.S336903
- Brusini P, Filacorda S. Enhanced Glaucoma Staging System (GSS 2) for classifying functional damage in glaucoma. J Glaucoma. 2006;15(1):40–46. doi:10.1097/01.ijg.0000195932.48288.97
- Porciatti V, Ventura LM. Normative data for a user-friendly paradigm for pattern electroretinogram recording. Ophthalmology. 2004;111(1):161–168. doi:10.1016/j.ophtha.2003.04.007
- Orshan D, Tirsi A, Sheha H, et al. Structure-function models for estimating retinal ganglion cell count using steady-state pattern electroretinography and optical coherence tomography in glaucoma suspects and preperimetric glaucoma: an electrophysiological pilot study. Doc Ophthalmol. 2022;145(3):221–235. doi:10.1007/s10633-022-09900-z
- Tirsi A, Wong A, Zhu D, Stoffels G, Derr P, Tello Md C. Pattern electroretinogram parameters and their associations with optical coherence tomography in glaucoma suspects. J Curr Glaucoma Pract. 2022;16(2):96–104. doi:10.5005/jp-journals-10078-1365
- Tirsi A, Orshan D, Wong B, et al. Associations between steady-state pattern electroretinography and estimated retinal ganglion cell count in glaucoma suspects. Doc Ophthalmol. 2022;145(1):11–25. doi:10.1007/s10633-022-09869-9
- Tirsi A, Gliagias V, Moehringer J, et al. Pattern electroretinogram parameters are associated with optic nerve morphology in preperimetric glaucoma after adjusting for disc area. J Ophthalmol. 2021;2021:8025337. doi:10.1155/2021/8025337
- Asrani S. Spectralis posterior pole asymmetry analysis. Heidelberg Engineering; 2010.
- Shah PP, Tirsi A, Orshan D, et al. Posterior pole asymmetry analysis as a diagnostic tool in glaucoma suspects: an electrophysiological approach. Invest Ophthalmol Vis Sci. 2022;63(7):626 – A0366-626–A.
- Colotto A, Salgarello T, Falsini B, et al. Pattern electroretinogram and optic nerve topography in ocular hypertension. Acta Ophthalmol Scand. 1998;76(S227):27–29. doi:10.1111/j.1600-0420.1998.tb00871.x
- Stewart WC, Chauhan BC. Newer visual function tests in the evaluation of glaucoma. Surv Ophthalmol. 1995;40(2):119–135. doi:10.1016/S0039-6257(95)80002-6
- Gordon PS, Kostic M, Monsalve PF, et al. Long-term PERG monitoring of untreated and treated glaucoma suspects. Doc Ophthalmol. 2020;141(2):149–156. doi:10.1007/s10633-020-09760-5
- Field MG, Alasil T, Baniasadi N, et al. Facilitating glaucoma diagnosis with intereye retinal nerve fiber layer asymmetry using spectral-domain optical coherence tomography. J Glaucoma. 2016;25(2):167–176. doi:10.1097/IJG.0000000000000080
- Bak E, Kim YK, Ha A, et al. Association of intereye visual-sensitivity asymmetry with progression of primary open-angle glaucoma. Invest Ophthalmol Vis Sci. 2021;62(9):4. doi:10.1167/iovs.62.9.4
- Zeimer R, Asrani S, Zou S, Quigley H, Jampel H. Quantitative detection of glaucomatous damage at the posterior pole by retinal thickness mapping. A pilot study. Ophthalmology. 1998;105(2):224–231. doi:10.1016/S0161-6420(98)92743-9
- Leung CK, Chan WM, Yung WH, et al. Comparison of macular and peripapillary measurements for the detection of glaucoma: an optical coherence tomography study. Ophthalmology. 2005;112(3):391–400. doi:10.1016/j.ophtha.2004.10.020
- Guedes V, Schuman JS, Hertzmark E, et al. Optical coherence tomography measurement of macular and nerve fiber layer thickness in normal and glaucomatous human eyes. Ophthalmology. 2003;110(1):177–189. doi:10.1016/S0161-6420(02)01564-6
- Yum HR, Park HL, Park CK. Characteristics of normal-tension glaucoma patients with temporal retinal nerve fibre defects. Sci Rep. 2020;10(1):6362. doi:10.1038/s41598-020-63486-7
- Ghassibi MP, Chien JL, Patthanathamrongkasem T, et al. Glaucoma diagnostic capability of circumpapillary retinal nerve fiber layer thickness in circle scans with different diameters. J Glaucoma. 2017;26(4):335–342. doi:10.1097/IJG.0000000000000610
- Garway-Heath DF, Holder GE, Fitzke FW, Hitchings RA. Relationship between electrophysiological, psychophysical, and anatomical measurements in glaucoma. Invest Ophthalmol Vis Sci. 2002;43(7):2213–2220.
- Porciatti V, Ventura LM. Physiologic significance of steady-state pattern electroretinogram losses in glaucoma: clues from simulation of abnormalities in normal subjects. J Glaucoma. 2009;18(7):535–542. doi:10.1097/IJG.0b013e318193c2e1
- Porciatti V, Falsini B, Brunori S, Colotto A, Moretti G. Pattern electroretinogram as a function of spatial frequency in ocular hypertension and early glaucoma. Doc Ophthalmol. 1987;65(3):349–355. doi:10.1007/BF00149941
- Xu X, Xiao H, Lai K, Guo X, Luo J, Liu X. Determinants of macular ganglion cell-inner plexiform layer thickness in normal Chinese adults. BMC Ophthalmol. 2021;21(1):267. doi:10.1186/s12886-021-02023-0
- Orman G, Fırat PG, Doganay S, Doganay D. Assessment of ganglion cell complex, macular thickness, and optic disc parameters in keratoconus patients. Saudi J Ophthalmol. 2020;34(4):256–260. doi:10.4103/1319-4534.322604
- Hwang JC, Konduru R, Zhang X, et al. Relationship among visual field, blood flow, and neural structure measurements in glaucoma. Invest Ophthalmol Vis Sci. 2012;53(6):3020–3026. doi:10.1167/iovs.11-8552
- Galassi F, Sodi A, Ucci F, Renieri G, Pieri B, Baccini M. Ocular hemodynamics and glaucoma prognosis: a color Doppler imaging study. Arch Ophthalmol. 2003;121(12):1711–1715. doi:10.1001/archopht.121.12.1711
- Flammer J, Mozaffarieh M. Autoregulation, a balancing act between supply and demand. Can J Ophthalmol. 2008;43(3):317–321. doi:10.3129/i08-056
- Kawasaki R, Wang JJ, Rochtchina E, Lee AJ, Wong TY, Mitchell P. Retinal vessel caliber is associated with the 10-year incidence of glaucoma: the Blue Mountains Eye Study. Ophthalmology. 2013;120(1):84–90. doi:10.1016/j.ophtha.2012.07.007
- Kim JM, Sae Kim M, Ju Jang H, Ho Park K, Caprioli J. The association between retinal vessel diameter and retinal nerve fiber layer thickness in asymmetric normal tension glaucoma patients. Invest Ophthalmol Vis Sci. 2012;53(9):5609–5614. doi:10.1167/iovs.12-9783
- Zheng Y, Cheung N, Aung T, Mitchell P, He M, Wong TY. Relationship of retinal vascular caliber with retinal nerve fiber layer thickness: the Singapore Malay eye study. Invest Ophthalmol Vis Sci. 2009;50(9):4091–4096. doi:10.1167/iovs.09-3444
- Gupta R, Tirsi A, Orshan D, et al. Reductions in retinal vessel diameter are associated with retinal ganglion cell dysfunction and with decreased ganglion cell layer-inner plexiform layer thickness measurements in glaucoma suspects. Invest Ophthalmol Vis Sci. 2022;63(7):631 – A0371-631–A.
- Lacher CR, Tirsi A, Orshan D, et al. Reduced macular vessel density in glaucoma suspects correlates with abnormal pattern electroretinogram parameters and retinal nerve fiber layer thinning. Invest Ophthalmol Vis Sci. 2022;63(7):641 – A0381-641–A.
- Lacher C, Orshan D, Tirsi A, et al. Retinal vessel diameter reductions in pre-perimetric glaucoma correlate with pattern electroretinogram and foveal avascular zone area parameters. Invest Ophthalmol Vis Sci. 2021;62(8):1850.
- Tatham AJ, Weinreb RN, Zangwill LM, Liebmann JM, Girkin CA, Medeiros FA. Estimated retinal ganglion cell counts in glaucomatous eyes with localized retinal nerve fiber layer defects. Am J Ophthalmol. 2013;156(3):578–587.e1. doi:10.1016/j.ajo.2013.04.015