Abstract
We used a unique combination of four state-of-the-art technologies to achieve a high performance spectral domain optical coherence tomography system suitable for imaging the entire ocular surface. An ultra-high resolution, extended depth range, full-phase interferometry, and high-speed complementary metal-oxide semiconductor transistor camera detection provided unprecedented performance for the precise quantification of a wide range of the ocular surface. We demonstrated the feasibility of this approach by obtaining high-speed and high-resolution images of a model eye beyond the corneal–scleral junction. Surfaces determined from the images with a segmentation algorithm demonstrated excellent accuracy and precision.
Introduction
Accurate and precise mapping of the region around the corneal–scleral junction may be helpful in fitting contact lenses because this geometric shape impacts lens fitting characterizations like centration, movement, and tightness.Citation1–Citation3 Prosthetic replacement of the ocular surface environment (PROSE) devices are large in diameter, and have vaulted scleral lenses with a liquid reservoir that are used to protect the eye surface, thus promoting healing and restoring sight in injured and diseased eyes.Citation4,Citation5 These devices have been used to treat corneal ectasia, exposure keratopathy, vascularized limbal keratitis, and are useful for improving visual function in subjects with these conditions.Citation4–Citation8 However, PROSE is not widely used because the current fitting procedure, which involves multiple trial lenses, is time-consuming and costly.Citation4 An automated fitting procedure would reduce costs and time, improve results, and allow a greater number of patients to be treated. Several commercial imaging modalities are capable of providing ocular shape information including slit scanning topography such as the Orbscan® (Bausch and Lomb Incorporated, Rochester, NY, USA), Scheimpflug imaging, ultrasound biomicroscopy, and Placido ring-based corneal topography (Carl Zeiss Meditec, Dublin, California, USA).Citation9 These technologies are either limited to the corneal region, have insufficient resolution, or only provide images with low sampling density due to low acquisition speed. Anterior segment optical coherence tomography (OCT), as provided by Visante (Carl Zeiss Meditec AG) can scan a wider area, but the scan speed and resolution are too low.Citation9 Chapman et al used Visante OCT to evaluate the PROSE fitting and found that the mean change in central corneal thickness was only 4.3 μm after the peripheral corneal edema resolved (Champan et al IOVS 2013, 54, ARVO E-Abstract 3570). It may indicate that a higher resolution below 5 μm is needed, especially for monitoring the change of corneal thickness in each individual. A high resolution may increase the image quality and improve the capability of visualizing the epithelium and the postlens tear film. Furthermore, the scan speed is another concern; the scan speed of Visante OCT might be enough for a two-dimensional scan, but it is not suitable for a three-dimensional scan. Some other commercially available spectral domain OCT instruments have a resolution of 5 μm, but the scan width is limited because these devices have been designed primarily for imaging the retina. Currently, there is no commercial device that can be used to obtain the ocular surface shape with a wide range (over 18 mm wide) scan, and with a large depth range (5 mm) and high resolution.
Clinicians have requested a method to measure the corneal and scleral surface, which may further enable the automated fitting of the PROSE device and may facilitate the evaluation of shape changes during other procedures such as orthokeratology and corneal cross-linking in patients with keratoconus.Citation10,Citation11 The method must have a range sufficient enough to image the region of the scleral surface (up to 20 mm of scan width) where the PROSE device rests, as well as be able to show details of the corneal surface to allow evaluation of damage or disease and to design the lens shape for proper reservoir volume and vision correction. Shen et alCitation1,Citation2,Citation12 and others have imaged the surface, anterior segment, and limbal region with OCT;Citation3 however, the speed, range, and accuracy may not be sufficient. We used a unique combination of four state-of-the-art technologies to develop a high-performance spectral domain OCT (SD-OCT) system with ultra-high resolution, extended depth range, full-phase interferometry, and high-speed complementary metal-oxide semiconductor (CMOS) transistor camera detection. The aim of this study was to demonstrate the feasibility of this approach by obtaining high-speed, high-resolution images of the model ocular surface.
Methods
Instrument
An SD-OCT instrument was constructed for anterior segment imaging at the Bascom Palmer Eye Institute, University of Miami (Miami, FL, USA). shows a schematic of the instrument. In this project, two light sources were used: a Superlum Diodes model T840-HP with 840 nm center wavelength and 100 nm bandwidth (Broadlighter, T840-HP; Superlum Diodes, Ltd, Moscow, Russia) and a model T870-HP with 870 nm center wavelength and 188 nm bandwidth (T870-HP; Superlum Diodes, Ltd) with a control module and optical isolator. The theoretical axial resolution for the T840-HP is 4.7 μm (~3μm in tissue) and is 2.7 μm for the T870-HP (~2 μm in tissue). The super luminescent diode (SLD) was collimated (OZ Optics Ltd Ottawa, ON, Canada) into a Michelson-type interferometer formed by a 2 × 2 broadband single mode coupler (Model BC# 36682; OZ Optics Ltd). An inline polarization controller (Model PLC-900; Thorlabs, Inc, Newton, NJ, USA) compensated for polarization mismatch between the two interferometer arms. A piezo fiber stretcher (PZ1-SM4-APC-E-850; Optiphase, Inc, Van Nuys, CA, USA) inserted into the interferometer reference arm provided the phase modulation for the harmonic detection full-phase interferometry. A matching length of fiber (also provided by Optiphase, Inc) was inserted into the other interferometer arm to match the path length and dispersion introduced by the fiber stretcher. The power delivered to the sample was 1 mW.
Figure 1 Illustration of the SD-OCT interferometer and the custom spectrometer.
Abbreviations: SD-OCT, spectral domain optical coherence tomography; SLD, super luminescent diode; CMOS, complementary metal-oxide semiconductor; VPH, volume phase holographic.
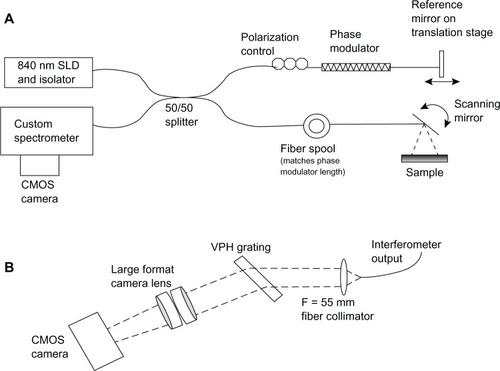
The custom spectrometer was constructed from a 55 mm focal length collimating lens, an 840 nm, 1200 lines/mm transmission volume phase holographic grating (Wasatch Photonics, Logan, UT, USA), and a large format camera lens (Schneider Apo Symmar 5.6/150; Schneider Optics, Van Nuys, CA, USA). A Basler high-speed CMOS camera (Basler sprint spL4096-140 k; Basler AG, Ahrensburg, Germany) detected the spectral output. This camera has two lines of 4096 pixels that can each be read at a line rate of 70 KHz. Since the two lines detected the same field of view, they were vertically binned prior to data transfer from the camera. The wavelength scale was calibrated using diode lasers of known frequency and confirmed by measuring the thickness of objects such as microscope cover slips with SD-OCT and comparing those measurements to caliper measurements.
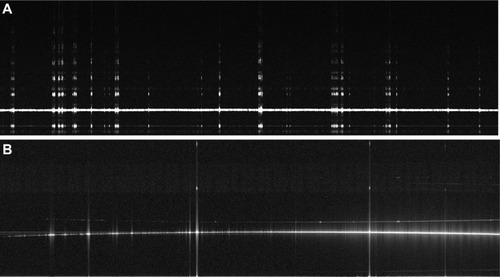
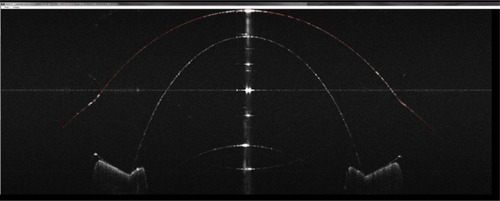
A telecentric XY scanning system for moving the light beam across the sample was designed and incorporated into the instrument (). The scanner provided up to 20 mm meridian scans at any angle with no fan distortion. illustrates this result: an 18.25 mm wide scan across a flat reflective surface taken with the fan-distortion-free telecentric scanner () is compared to a scan taken with the previous quasitelecentric scanner ().Citation2 (Bright “ghost” images above and below the surface in are caused by camera saturation due to the high reflectivity.)
Figure 2 Illustration of the true telecentric XY scanning system.
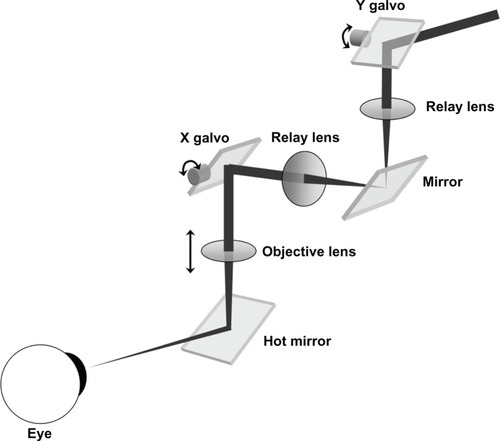
Figure 3 An 18.25 mm lateral scan across a flat surface.
Abbreviation: OCT, optical coherence tomography.
A National Instruments PCIe 1433 camera link board was used to interface with the camera using National Instruments’ LabVIEW programming language (National Instruments Corporation, Austin, TX, USA). A National Instruments PCI-6259 multifunction I/O board (National Instruments Corporation) provided the voltage waveforms to drive the fiber stretcher and the galvoscanner in synchrony with the camera.
At Southwest Sciences, we have developed and patented a method for direct acquisition of the complex spectral interferogram based on harmonic detection,Citation13–Citation18 which we have applied to both the spectral domain and swept source OCT.Citation16,Citation17 This approach has been described in detail previously.Citation16,Citation17 Briefly, an arbitrary phase modulation is applied to one interferometer arm. This can be done by modulating the path length by rapidly moving the reference mirror over a very small distance, or by some other method such as an electrooptic phase modulator or fiber optic stretcher. This allows the imaginary and real components to be detected simultaneously as the first and second harmonics of a phase-modulated interferogram. Demodulation and a complex fast Fourier transform (FFT) generate the depth profile. With this method, 70 dB artifact rejection has been demonstrated and 45–50 dB rejection is typical.Citation16,Citation17 The fastest camera-based SD-OCT harmonic detection system used in our previous work acquired spectral interferograms at 2 kHz. In this project, we tested harmonic detection performance at 70 kHz using a piezo fiber stretcher for high-speed phase modulation.Citation19
Three data acquisition programs were written in LabVIEW (National Instruments Corporation). Program 1 performed standard SD-OCT (without harmonic detection) with the acquisition of camera lines up to the maximum line rate and it processed the camera data (spectral interferograms) into two-dimensional cross-sectional images. Spectral interferograms were first converted to the frequency scale and resampled using interpolation. Cross-correlation artifacts and direct current (DC) signal (the underlying spectrum) were removed using the high speed ensemble average method of Wang and Ma.Citation20 A series of depth profiles (A-scans) were obtained along a lateral scan by moving the galvoscanner synchronously with the camera clock, creating a two-dimensional cross-sectional image (lateral position versus depth into sample). This program could obtain up to 1,000 A-scans per image and could display the image as data were acquired. This program could also save the raw data to file for postprocessing and save images to a variety of formats such as jpg, png, or tagged image file.
Program 2 performed harmonic detection SD-OCT for full-phase imaging, and consisted of separate data acquisition and image processing subprograms. Detailed mathematical descriptions of the harmonic detection method and the required data processing are given.Citation5,Citation9,Citation11 This method is computationally more intensive than standard SD-OCT because it requires digital demodulation of the data and a mathematical combination of six to eight spectral interferograms prior to the FFT. For this reason, the data acquisition program saved the raw data in a file and a separate program processed the data into images. This was necessary because processing a large number of camera lines caused the processing to fall behind the data acquisition. This second program could save up to 2,000 camera lines (spectral interferograms) to a file. The processing program displayed the images and allowed them to be saved in a variety of formats for further analysis with a segmentation algorithm.
Program 3 was a version of the harmonic detection program that acquired only 150 camera lines and processed the data into images to display onscreen as data were acquired. For this small number of camera lines, real-time image display was possible. In future work, high-speed image processing hardware, such as general purpose graphics processing units, will be implemented.Citation21,Citation22 This program was used for alignment and parameter optimization before using program 2 to collect data.
SD-OCT performance
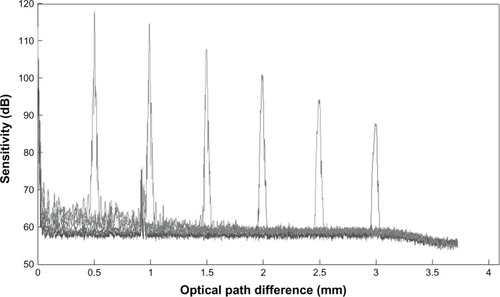
shows the signal-to-noise ratio (SNR) of the OCT system detected at different depth positions. The sensitivity decreased from 100 dB at the zero-delay plane to 42 dB at the imaging depth of 3.5 mm.
Figure 4 The sensitivity of the OCT system detected at different depth positions.
In vitro experiment
Two test objects were used to evaluate the performance of the instrument. A metal ball that is used to calibrate corneal keratometers and topographers was used as a test surface of the precisely known radius of curvature to evaluate accuracy. The radius of curvature of the metal ball is 7.918 mm. The second test object is a model eye (OEMI-7; Ocular® Instruments, Inc, Bellevue, WA, USA) with an aspheric surface. The model eye was used to evaluate accuracy and precision. Full-phase, ultra-high resolution SD-OCT scans of the test objects were obtained using the T870-HD 188 nm full-width at half-maximum bandwidth (FWHM) super luminescent diode (SLD) light source (Superlum Diodes, Ltd). A micrometer with a resolution of 1 μm was used to calibrate the scan axis. The scan width was 18.25 mm.
Image segmentation and analysis
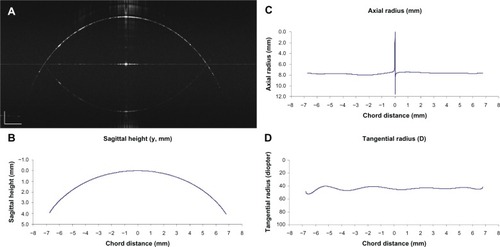
Images consisting of 2,000 evenly spaced depth profiles across an 18.25 mm meridian scan were obtained using harmonic detection. The camera was run at its highest speed (70 kHz) and there was no averaging of camera lines beyond binning the two lines of pixels on the camera. The images were constructed from the raw camera data. Images were saved in a tagged image file data format and resized according to the scan depth and width calibrations. For this project, we used a semiautomated method to detect the front surface of the images using custom software (J-OCT) written in C++ code developed at Bascom Palmer Eye Institute. Briefly, a few points were manually marked on the boundary using a computer cursor. The points were accepted when the software identified that the marked points were located at the peak of the depth scan by searching the first peak of the reflectivity profile. After these points (up to 20) were marked, the software searched all peaks on the front surface boundary to form the detected surface (red curve, ). The coordinates were saved to an Excel® (Microsoft Corporation, Redmond, WA, USA) spreadsheet for further analysis.
Figure 5 Detection of surface.
Abbreviations: CMOS, complementary metal-oxide semiconductor; SD-OCT, spectral domain optical coherence tomography; HD, harmonic detection.
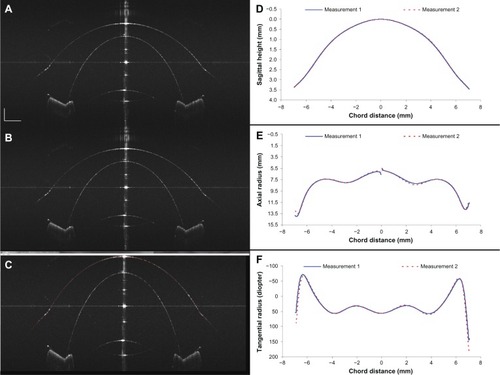
A MATLAB® (The MathWorks, Inc, Natick, MA, USA) program analyzed the surface resulting from the segmentation analysis and extracted surface shape information yielding the best fit sphere for the metal sphere and conic fit for the aspheric model eye. The results included measurements of the axial radius of the curvature of different zones (chord distances), the sagittal height as a function of zones, and the tangential radius of the curvature of zones ().
Figure 6 Analysis of detected surface of the spherical metal calibration ball.
Abbreviations: D, diopters; HD, harmonic detection; CMOS, complementary metal-oxide semiconductor; SD-OCT, spectral domain optical coherence tomography.
Results
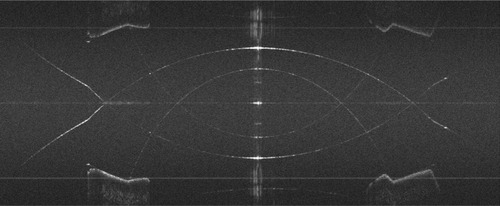
is an SD-OCT image of the model eye showing the depth range on both sides of the interferometric zero crossing. This image demonstrates the complex conjugate “mirror image” that complicates the image when full-phase interferometry is not performed. In this case, the harmonic detection demodulation parameters were intentionally set to correspond to standard SD-OCT. This artifact prevents the use of both halves of the image field unless a full-phase method is used.
Figure 7 Cross-sectional image of a model eye (horizontal meridian) showing the complex conjugate artifact that results when full-phase SD-OCT is not performed.
In the following images (–), which were used to analyze the accuracy and precision of the instrument, full-phase imaging is performed using harmonic detection. In the images presented in this report, a logarithmic intensity scale is used. No complex conjugate artifact is seen in . was obtained from a previous standard SD-OCT system with a scan depth of 7.2 mm.Citation2 Comparing the two images, the entire ocular surface image of the model eye was enhanced with the current system.
Figure 8 Model eye images.
Abbreviation: OCT, optical coherence tomography.
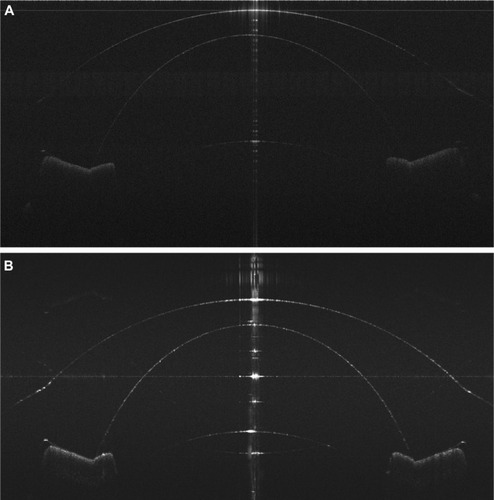
Figure 9 Measurement accuracy.
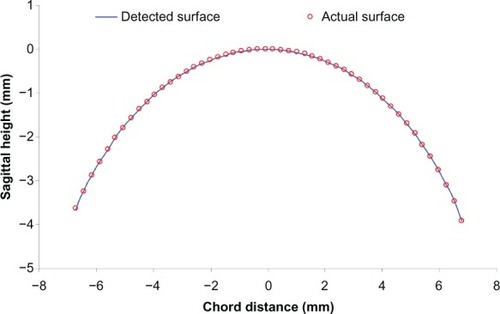
Figure 10 Precision of measuring the ocular surface.
The accuracy was computed by comparing the detected surface of the sagittal height with the known surface of the metal spherical calibration ball. The detected surface matched the actual surface very well. The mean difference between the detected surface and actual surface was 0.9 μm and the standard error was 0.7 μm. The calculated surface and known surface values were compared at 48 evenly sampled points across the surface ().
The precision of the method was tested from two repeated measurements on the model eye over the same scan meridian. The mean difference between the two measured aspheric surfaces of the model eye () was 2.0 μm. The standard error across the full surface scan was 0.1 μm. The image and curvature analysis revealed that the model eye has an aspheric central curve and changes to a second curve at approximately 12 mm in diameter. The negative curvature located at the limbal region is apparent in the tangential plot (). The locations with the maximum negative curvatures corresponded to the corneal–scleral junction angle on the human eye. The results () showed that within a 10 mm diameter zone of the center of the model eye, the radius of the curvature determined from the SD-OCT images has a conic constant that is very close to the physical value, as determined by a Zygo® Verifire™ Interferometer (Zygo Corporation, Middlefield, CT, USA), again demonstrating excellent accuracy.
Table 1 Measured model eye surface parameters compared to Zygo® Verifire™ interferometer (Zygo Corporation, Middlefield, CT, USA) measurement
Discussion
Unlike for the retina, ocular surface shape measurement by OCT requires a large scan depth range and a large scan width to image the cornea and the sclera beyond the corneal–scleral junction. The sagittal depth of the entire anterior segment is more than 5 mm and the diameter is approximately 16 mm up to the scleral zone. A long depth range is required because of the long distance between the scleral surface and the imaging objective (which is above the apex). Although Shen et al and others have imaged the surface, anterior segment, and limbal region with OCT, the speed, range, and accuracy may need to improve for imaging the entire ocular surface.Citation1–Citation3,Citation12 Two major drawbacks of SD-OCT restrict the performance of the image if the entire cornea is put in one side of the measurement range. First, the SNR dropped when the image depth increased. As shown in , the sensitivity dropped 57 dB from the zero-delay line to the maximum scan depth when using standard SD-OCT; second, the complex conjugate ambiguity in Fourier domain OCT methods resulted in two overlapped images that were symmetrical with respect to the zero plane of the interferometer.Citation23,Citation24 Thus, only one-half of the ranging depth is useful in practice, and interpreting the collected data is difficult.
To resolve the complex conjugate ambiguity and to double the theoretical depth range, several full-phase interferometry methods have been proposed.Citation13,Citation19,Citation25 The scan depth was 7.8 mm when using a full-phase technique in the present study, with the real and imaginary parts acquired simultaneously using harmonic detection.Citation5 When imaging the entire cornea and the overlying contact lens, only a depth of 2 mm near the zero-delay line at each side is needed. Therefore, the sensitivity drop is only 16 dB, which is much smaller than the decrease of sensitivity with standard SD-OCT. The region on either side of the zero-delay plane is where the signal is largest and the axial resolution is best. It is desirable to make the best use of this region by using a full-phase interferometry method when imaging structures at a greater distance from the objective; it provides additional flexibility by allowing arbitrary positioning of the reference plane (for example, moving it inside the sample). This is advantageous, allowing full use of the region where there is little signal fall-off. It is suitable for imaging the entire cornea onto the sclera or a large diameter contact lens because the position of the zero-delay line may be set to the edge of the contact lens or limbus.
However, using a phase shift technique to image the full depth of the anterior segment eye from the front surface of the cornea to the back surface of the lens is more difficult. One limitation is the limited depth of focus with only one single objective lens. If the zero-delay line was placed on the iris, the optical focus can only be set at one position – either on the central cornea or on the back surface of the lens. Thus, sufficient resolution over the full image range is impossible. An alternative choice is using dual-channel dual-focus OCT proposed by Zhou et al,Citation26 but the SNR of the system was decreased due to the attenuation of 50% of the reflected light. Another choice is using a switchable reference arm (overlapping two images when the zero-delay line was alternatively placed on the top or the bottom of the images).Citation27 The zero-delay line can be placed on the cornea in one image and then placed on the lens in the other image, and the optical focus can be set at the iris in both images; thus, sufficient resolution cover the full range of the anterior segment can be achieved.
The signal sensitivity of the whole depth was enhanced by using the switchable reference arm technique. The drawback of this technique is that it needs time to switch from one reference arm to another arm. Although the switchable time is very short, if the human eye moves during image acquisition, the two images will be different and reconstructing the images will be difficult. When the zero-delay line was placed at the edge of the contact lens or limbus, the complex conjugate artifact of the iris and lens will affect the image quality of the cornea. Therefore, the switchable reference arm technique may be not suitable for imaging a large diameter scleral contact lens or ocular surface at the same time as the anterior chamber unless a full-phase method is added.
The full-phase method used in the present study, harmonic detection, was chosen because it was easy to implement with modifications to existing software. However, it slows the image acquisition speed by a factor of 6 to 8 because it requires 6–8 camera lines for each processed depth scan. A reference beam (M scan) and transversal scanning (B scan) simultaneously is an alternative that may allow for faster image acquisition, but at the expense of decreased complex conjugate rejection.Citation25,Citation28,Citation29 A recently published method by Wu et alCitation30 that uses inherent phase shifts between depth scans may provide a faster method for image acquisition. This method is less computationally intensive than either harmonic detection or B-M mode scanning, but requires oversampling in the lateral scan direction by a factor of 8. However, over-sampled data are also required for input to the segmentation algorithm. Its complex conjugate rejection performance is similar to B-M mode scanning. The suppression (ratio of the artifact image intensity relative to the desired image intensity) is typically 40 dB at 70 kHz line rates without data averaging. With an averaging of 5 A-scans, the suppression could be improved to 50 dB.
The depth range depends on the change in the detected wavelength per camera pixel, and it can be increased by using a camera with a greater number of pixels for the same spectral bandwidth. By doubling the number of pixels for the same detected bandwidth, the depth range is essentially doubled. It is advantageous to use a CMOS instead of a CCD line scan camera because high speed is also necessary. Although CMOS devices are faster, they have higher noise floors than CCD devices. For this application, there is plenty of detected light, so the noise is not an issue. The fastest CMOS camera with the highest number of pixels that is commercially available at this time is the Basler model spL4096-140 km CMOS line scan camera (Basler AG). The effective line rate is 70 kHz. Assuming the data processing can be done fast enough, the data acquisition is limited by the camera line rate. A single, camera speed-limited, 18 mm wide meridian image consisting of 2,000 depth profiles can be obtained with the present instrument in 0.028 seconds. Although a single meridian can be obtained at a very high speed, eye movement during acquisition of the multiple meridians, which are needed to map the eye surface, is unavoidable. Implementation of an eye-tracking system may be needed.
Shen et alCitation2 had previously imaged the anterior segment of the eye using SD-OCT with an InPhenix SLD (InPhenix, Inc, Livermore, CA, USA) with a center wavelength of 840 nm and a full width at half the maximum bandwidth of 45 nm. That instrument was able to image the ocular surface shape beyond the limbus. One important approach to improving the accuracy (and precision) of surface maps obtained from SD-OCT images is to increase the axial resolution of the SD-OCT instrument. The axial resolution for the T840-HP is reduced to 4.7 μm in air and for the T870-HP is 2.7 μm in air.Citation31 Another desired improvement is to obtain better image quality in the scleral region where accuracy is poorer than in the corneal region. By extending the depth range, better imaging of structures further from the eye’s apex may be obtained. With the T840-HP light source, the theoretical depth range remains at 7 mm, while for the T870-HP it increases to 12.6 mm (the ratio of the bandwidths is 188/100). However, due to the signal drop with the scan depth, the useful depth range is limited. Using a full-phase method such as harmonic detection enables the zero-delay plane to be inside the sample, increasing the useful depth range. Finally, to image beyond the corneal–scleral junction, a wide scan range is needed. The scanner used by us in a previous study provided an 18 mm lateral scan, which was wide enough to obtain meridian images of the human eye surface in the scleral region.Citation2 However, that scanner, like most used for OCT, was quasitelecentric and caused fan distortion in the scans. A true telecentric XY scanning system for moving the light beam across the sample was designed and incorporated into the CMOS camera instrument. The scanner provided 18 mm meridian scans at any angle with no fan distortion. Previously, fan distortion was removed during image processing, which is not as accurate as having no fan distortion in the acquired data. By improving the axial resolution, the flatness of the lateral scan, and the useful depth range, the precision and accuracy of the surface maps obtained from the SD-OCT images were improved.
It should be noted that the material of the model eye was made of poly-methlymethacrylate, which may not fully represent the ocular surface in OCT imaging. The shape of the model eye may also differ from the human eye, especially in the corneal–scleral junction. Nevertheless, imaging the model eye is an accepted method for measuring the accuracy and precision of ocular imaging instruments, and we demonstrated the improvements of our current system by comparing the images obtained with the current system and with our previous long-scan depth prototype ( and ). Further studies will be needed to test our system on human eyes.
Conclusion
The CMOS camera-based SD-OCT instrument developed in the present study yielded high-quality images of the model eye, including the scleral junction. Several improvements to long-depth range SD-OCT – including ultra-high resolution, high-speed, full-phase imaging, and true telecentric scanning – greatly improved the SNR. Excellent accuracy and precision of the surfaces obtained from the images were demonstrated using a semiautomated segmentation routine. Further improvements to the instrument that will allow for fast image processing and display, as well as eye tracking along with fully automated surface detection will be further tested on human eyes.
Acknowledgments
This study was supported by research grants from the NIH 1R21EY021336, NIH Center Core Grant P30EY014801, and Research to Prevent Blindness and Department of Defense (DoD W81XWH-09-1-0675, DoD SBIR W81XWH-12-C-0074).
Disclosure
The authors report no conflicts of interest in this work.
References
- ShenMWangMRYuanYSD-OCT with prolonged scan depth for imaging the anterior segment of the eyeOphthalmic Surg Lasers Imaging201041SupplS65S6921117604
- ShenMCuiLLiMZhuDWangMRWangJExtended scan depth optical coherence tomography for evaluating ocular surface shapeJ Biomed Opt201116505600721639575
- JungwirthJBaumannBPircherMGötzingerEHitzenbergerCKExtended in vivo anterior eye-segment imaging with full-range complex spectral domain optical coherence tomographyJ Biomed Opt200914505050119895097
- CresseyAJacobsDSCarrasquilloKGManagement of vascularized limbal keratitis with prosthetic replacement of the ocular surface systemEye Contact Lens201238213714022327201
- LingJDGireAPflugfelderSCPROSE therapy used to minimize corneal trauma in patients with corneal epithelial defectsAm J Ophthalmol20131554615619, 619. e1–e2.23218704
- BaranIBradleyJAAlipourFRosenthalPLeHGJacobsDSPROSE treatment of corneal ectasiaCont Lens Anterior Eye201235522222722633003
- RathiVMMandatharaPSVaddavalliPKSrikanthDSangwanVSFluid filled scleral contact lens in pediatric patients: challenges and outcomeContact Lens Anterior Eye201235418919222459875
- GireAKwokAMarxDPPROSE treatment for lagophthalmos and exposure keratopathyOphthal Plast Reconstr Surg2013292e38e40
- MoutsourisKDapenaIHamLBalachandranCOellerichSMellesGROptical coherence tomography, Scheimpflug imaging, and slit-lamp biomicroscopy in the early detection of graft detachment after Descemet membrane endothelial keratoplastyCornea201130121369137521993458
- LianYShenMJiangJVertical and horizontal thickness profiles of the corneal epithelium and Bowman’s layer after orthokeratologyInvest Ophthalmol Vis Sci201354169169623221070
- VinciguerraRRomanoMRCamesascaFICorneal cross-linking as a treatment for keratoconus: four-year morphologic and clinical outcomes with respect to patient ageOphthalmology2013120590891623290750
- TaoAWangJChenQTopographic thickness of Bowman’s layer determined by ultra-high resolution spectral domain-optical coherence tomographyInvest Ophthalmol Vis Sci20115263901390721460260
- VakhtinABPetersonKAKaneDJResolving the complex conjugate ambiguity in Fourier-domain OCT by harmonic lock-in detection of the spectral interferogramOpt Lett20063191271127316642082
- VakhtinABPetersonKAKaneDJDemonstration of complex-conjugate-resolved harmonic Fourier-domain optical coherence tomography imaging of biological samplesAppl Opt200746183870387717538685
- VakhtinABKaneDJPetersonKASimultaneous acquisition of the real and imaginary components in Fourier domain optical coherence tomography using harmonic detectionProc SPIE20066380N1N5
- VakhtinABPetersonKAKaneDJReal-time video-rate harmonically detected Fourier domain optical coherence tomographyProc SPIE20086847R1R5
- HuangCMassickSMPetersonKAVakhtinABHigh speed, full range imaging with harmonic detection swept source optical coherence tomographyProc SPIE201075542V1V5
- VakhtinABKaneDJPetersonKAMethod and apparatus for full phase interferometry United States Patent US 7394546July12008
- VergnoleSLamoucheGDufourMLArtifact removal in Fourier-domain optical coherence tomography with a piezoelectric fiber stretcherOpt Lett200833773273418382533
- WangRKMaZA practical approach to eliminate autocorrelation artefacts for volume-rate spectral domain optical coherence tomographyPhys Med Biol200651123231323916757873
- JeongHChoNHJungULeeCKimJYKimJUltra-fast displaying Spectral Domain Optical Doppler Tomography system using a Graphics Processing UnitSensors (Basel)20121266920692922969328
- WangYOhCMOliveiraMCIslamMSOrtegaAParkBHGPU accelerated real-time multi-functional spectral-domain optical coherence tomography system at 1300 nmOpt Express20122014147971481322772175
- SchmitJCreathKExtended averaging technique for derivation of error-compensating algorithms in phase-shifting interferometryAppl Opt199534193610361921052178
- HariharanPOrebBFEijuTDigital phase-shifting interferometry: a simple error-compensating phase calculation algorithmAppl Opt198726132504250620489904
- BaumannBPircherMGötzingerEHitzenbergerCKFull range complex spectral domain optical coherence tomography without additional phase shiftersOpt Express20071520133751338719550607
- ZhouCWangJJiaoSDual channel dual focus optical coherence tomography for imaging accommodation of the eyeOpt Express200917118947895519466144
- RuggeriMUhlhornSRDeFCHoAMannsFParelJMImaging and full-length biometry of the eye during accommodation using spectral domain OCT with an optical switchBiomed Opt Express2012371506152022808424
- AnLWangRKUse of a scanner to modulate spatial interferograms for in vivo full-range Fourier-domain optical coherence tomographyOpt Lett200732233423342518059954
- LeitgebRAMichaelyRLasserTSekharSCComplex ambiguity-free Fourier domain optical coherence tomography through transverse scanningOpt Lett200732233453345518059964
- WuCTChiTTKiangYWYangCCComputation time-saving mirror image suppression method in Fourier-domain optical coherence tomographyOpt Express20122088270828322513539
- ZhuDShenMJiangHBroadband superluminescent diode-based ultrahigh resolution optical coherence tomography for ophthalmic imagingJ Biomed Opt2011161212600622191923