
Abstract
Purpose
The primary objective was to investigate if treatment with artificial tears affected the variability of keratometry measurements for subjects with dry eyes prior to cataract surgery. The secondary objectives were to investigate whether treatment with artificial tears improved refractive precision and whether subjects with non-dry eyes had better refractive precision than subjects with dry eyes.
Design
Prospective randomized controlled trial with three arms.
Patients and methods
Dry eye diagnostics according to DEWS II were performed, and subjects with dry eyes were randomized to no treatment (group A1) or treatment with artificial tears two weeks prior to cataract surgery (group A2), with the third group (Group B, non-dry eyes) as a control. Keratometry was performed twice at baseline and twice after two weeks at the time of cataract surgery with three different optical biometers. The change in mean variability of keratometry (average K and magnitude of vector differences) and percentages of outliers after two weeks versus baseline were compared for group A2. The refractive and astigmatism prediction errors were calculated eight weeks after cataract surgery and compared for all three groups.
Results
One hundred thirty-one subjects were available for analysis. There was no statistically significant difference in the mean variability of keratometry or percentages of outliers for group A2 from baseline to the time of cataract surgery. There was no statistically significant difference in refractive precision (absolute error and astigmatism prediction error) between any groups.
Conclusion
Subjects with dry eyes (treated and non-treated) achieved the same refractive precision and percentages of outliers as subjects with non-dry eyes. Treatment with artificial tears for two weeks appeared inadequate to significantly affect variability in biometric measurements for patients with dry eyes prior to cataract surgery. DEWS II criteria for DED may not be optimal in a cataract setting.
Introduction
Dry eye disease (DED) has become a widespread and notable health issue that affects millions of people worldwide. Recent studies suggest that approximately one out of every eleven people worldwide suffers from the disease.Citation1,Citation2 However, the prevalence data of DED varies significantly between studies, from 5% to 50%.Citation3 DED adversely affects the tear film.Citation4 As the precorneal tear film is the first refractive surface of the eye, instability of the tear film has been associated with reduced functional visual acuity.Citation5,Citation6 DED may affect the end results of cataract surgery because an unstable tear film might reduce the quality of keratometry measurements from reflection-based optical biometers prior to cataract surgery. Keratometric measurements are responsible for approximately 22% of errors in IOL power calculations.Citation7
The body of evidence regarding keratometry measurements and signs of dry eyes is contradictory. Epitropoulos et al found that hyperosmolarity in the tear film significantly affected the biometric measurements of the IOL Master (Carl Zeiss Meditec AG), a reflection-based optical biometer.Citation8 In addition, our research team found that hyperosmolarity and instability of the tear film significantly affected the variability of biometric measurements from the Lenstar 900 (Haag-Streit AG, Koeniz, Switzerland), also a reflection based-optical biometer (Data submitted, not yet published). Conversely, Gjerdrum et al did not find that hyperosmolarity affected biometric measurements from the Lenstar.Citation9
If it is the case that dry eyes impact biometric measurements (and consequently the calculation of IOL power), it becomes pertinent to investigate whether treatment of dry eyes can lead to improvement of these measurements.
Three studies have found statistically significant differences in preoperative biometric measurements and improved prediction error for subjects with dry eyes receiving anti-inflammatory eye drops.Citation10–12 In contrast, Jensen et al was unable to find statistically significant differences in K-value repeatability for subjects treated with artificial tears versus a non-treated control group.Citation13
The primary objective of this study was to investigate if DED treatment with artificial tears would reduce the variability in anterior keratometry measurements prior to cataract surgery from three different optical biometers: an optical low coherence reflectometry (OLCR) (Lenstar 900), a combined reflection-based and swept-source optical coherence tomography (SS-OCT) (Eyestar 900) (Haag-Streit AG, Koeniz, Switzerland) and an SS-OCT (Anterion) (Heidelberg Engineering GmbH, Heidelberg, Germany). The OLCR device and the combined reflection-based and SS-OCT device measure keratometry based on reflections from the tear film and could potentially be affected by an unstable tear film. There exist numerous treatments for DED. In the current study we chose to treat only with artificial tears because it is considered the primary treatment recommended in the DEWS II management plan for dry eye.Citation14
The secondary objectives were to investigate if DED treatment prior to cataract surgery improved the refractive predictability of IOL calculations and if the refractive predictability was better for patients with non-dry eyes versus untreated dry eyes. Refractive predictability calculations are limited to results from the Lenstar 900 biometer because the power of the IOLs used during surgery was selected based on the Lenstar 900 biometer measurements.
Methods
The results reported here are a subset of the results from a larger prospective interventional randomized controlled clinical trial with three distinct arms. Other analyses from this study included the prevalence of DED, the use of osmolarity as a diagnostic tool, and metabolomic and lipidomic analysis of tear film samples. Two articles have already been published from this project.Citation15,Citation16 The trial was prospectively registered at clinicaltrials.gov on 10th August 2020 (NCT05433428). Data were gathered in one private eye clinic located in Haugesund, Norway. The study`s participants were recruited from a pool of patients scheduled for cataract surgery by a group of ophthalmologists who were not part of the study. The recruitment and data collection phases spanned from August 2022 to May 2023. The study was approved by the Regional Committee for Medical and Health Research Ethics in Norway (Application no. 65988) and followed the tenets of the Declaration of Helsinki and good clinical practice. The inclusion criteria encompassed individuals who met the following conditions: indication for cataract surgery, capacity to provide informed consent, and capability to engage in two preoperative examinations as well as one postoperative examination. The exclusion criteria consisted of any ocular condition that might confound the study and any regular use of ocular lubricants.
The study involved a three-visit protocol. During the first study visit (baseline), all subjects signed an informed consent and underwent examinations for signs of dry eye (SDE) in accordance with the recommendations of DEWS II.Citation17 These assessments focused solely on objective signs of dry eyes, rather than symptoms. Subjects were categorized as “sign of dry eye” positive (SDE+) if they tested positive for dry eye in at least one of three objective tests. Others were classified as “sign of dry eye” negative (SDE-). See for a description of the dry eye tests used. To minimize interference from other dry eye tests, eyes were first tested for tear osmolarity, thereafter Noninvasive keratographic break-up time (NIKBUT) and finally ocular surface staining (OSS). One eye was chosen randomly as the study eye. The SDE+ subjects were randomized to receive preoperative dry eye treatment (Group A2) with artificial tears or not (Group A1).
Table 1 Dry Eye Tests
At baseline, all subjects underwent measurements with three optical biometers. At the second study visit, 2–3 weeks after baseline, ocular biometry was measured and IOL calculations were performed. Bilateral sequential cataract surgery was carried out by an experienced surgeon (KGG). The third visit, 8 weeks after surgery, included visual acuity and subjective refraction.
All groups were administered preservative-free dexamethasone (Monopex 1 mg/mL, Laboratoires Thea) and preservative-free Diclofenac (Voltaren Ophtha 1mg/mL, Laboratoires Thea). In addition, group A2 received preservative-free artificial tears (Thealoz Duo, Laboratoires Thea) six times daily two weeks prior to surgery ().
Table 2 Treatment Protocol
Keratometry measurements were repeated twice with three optical biometers, namely the Lenstar 900, Anterion, and Eyestar 900.Citation21–23 The sequence in which these optical biometers were employed was randomized for each study subject. The interval between the repeated measurements fell within the range of ten to twenty minutes. The primary objective of this study was to assess if dry eye treatment could reduce the variability of keratometry measurements. The variability was calculated as the difference in keratometry between two repeated measurements with each optical biometer. A paired sampled t-test was used for group A2 to calculate the effect of artificial tears from baseline to the time of cataract surgery. For the Lenstar 900, each acquisition comprised of five manually initiated measurements, resulting in a computation of an aggregate value by the instrument. If any of the measurements showed low quality, indicated by a red marker in the software, the test was repeated. The Anterion acquisition relied upon a single measurement. The system provided feedback on the quality of the measurement through either a green light (indicating success), a yellow light (indicating borderline performance), or a red light (indicating failure) regarding fixation, tear film, lid condition, and eye movement. If necessary, measurements were repeated until a green light was obtained for both fixation and eye movement, with acceptance of a yellow light for tear film and lid quality. The Eyestar executed a fully automated measurement procedure. The device conducted a quality assessment and, if required, initiated additional measurements to ensure accuracy and reliability.
For all groups, the biometric data from the initial Lenstar measurement during the second study visit (surgical visit) served as the basis for the IOL power selection. The Barrett Universal II formula was employed for the calculation of spherical equivalent power. In cases where the Barrett Toric formula suggested a toric IOL, subjects were given the option to select this specific type of IOL. All study participants were provided with either the SN60WF or SN6AT IOL (-both Alcon Laboratories, Inc., Fort Worth, Texas).
In this study, the primary variables were the absolute difference in average K (the average between the steepest and the flattest meridian) and the magnitude of vector difference of astigmatism between two repeated measurements during a specific visit. The vector difference of astigmatism can vary due to differences in magnitude or axis. The differences are referred to as the variability of average K or astigmatism. Secondary variables of interest included refractive prediction, uncorrected and corrected visual acuity, and subjective refraction. The refractive prediction error (RPE) was compared between groups by calculating the median absolute error (medAE). The absolute error (AE) was calculated by adjusting the mean (RPE) to zero to simulate optimal lens constants.Citation24 The RPE was calculated as the achieved spherical equivalent (SE) based on postoperative subjective refraction minus the predicted SE. Similarly, the astigmatism prediction error (APE) was calculated as the vector difference (magnitude) of the achieved minus the predicted residual cylinder refraction. The AE and APE were categorized into four range groups: AE/APE ≤ 0.25D, 0.25< AE/APE ≤ 0.5, 0.5< AE/APE≤ 0.75, and AE/APE > 0.75.
All data underwent anonymization procedures and were subsequently stored within a secure database located at Oslo Metropolitan University. Keratometry data were extracted utilizing the built-in software specific to each respective device. Subsequently, the data was organized in an Excel spreadsheet and checked for errors. For the statistical analysis, the Statistical Package for the Social Sciences (IBM, SPSS Statistics, version 14) was employed.
The Kruskal–Wallis test was used for non-parametric, ordinal data for comparison between groups. For categorical data, either Pearson`s Chi-square test or Fischer`s Exact test was applied. The paired-sample t-test was used to compare the variability of the two keratometry measurements from the same subject between devices and groups and to compare refractive predictability between groups. To test for possible environmental impact on the dry eye measurements, humidity and temperature were calculated with osmolarity, NIKBUT, and Pearson`s correlation coefficient was calculated.
A significance level (alpha) of 0.05 and a statistical power of 0.08 were used to calculate the sample size. With an anticipated standard deviation of 0.10 D between repeated measurements of average keratometry, it was determined that a minimum of 25 eyes in each group would be necessary to reliably detect a difference of 0.08 D between groups. When using an expected standard deviation of 0.4 D, a sample size of 41 eyes was determined to be necessary to detect a difference in refractive predictability of 0.25 D between the groups.Citation9
Results
A total of one hundred and thirty-five subjects were recruited. After the first study visit one subject wanted to delay surgery, one subject developed endophthalmitis in one eye after surgery, one subject had missing data due to technical problems, and one subject opted for multifocal IOLs. This left one hundred and thirty-one subjects available for analysis. Demography is presented in .
There were no statistically significant differences in age or sex between the three groups (p >0.7).
The temperature in the examination room exhibited a range of 22.5 to 25.5 degrees Celsius, while humidity levels ranged from 19% to 54%.
The correlation analysis revealed a small, but significant effect of humidity and temperature on osmolarity, with higher osmolarity measured at lower temperatures (Pearsons’s coefficient (PCC)= −0.171, p=0.047, and R² =0.03) and humidity (PCC=−0.307, p=0.01, and R²=0.09).
Table 3 Demography
Effect of Dry Eye Treatment
Variability of Keratometry
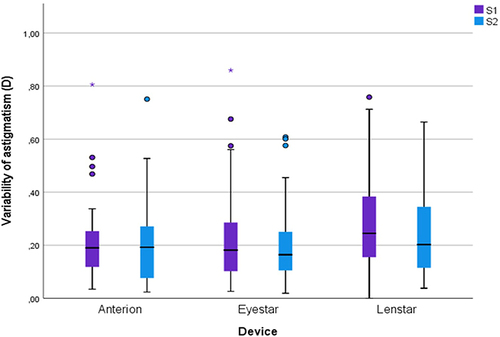
A paired-sampled t-test was conducted to analyze the effect of artificial tears on the variability of average K and the magnitude of the vector differences in astigmatism in subjects in group A2. The variabilities were compared for group A2 from baseline to the time of cataract surgery for all three biometers. There were no statistically significant differences in mean variability of average K (p> 0.1) () or vector differences in astigmatism (p>0.1) () from baseline to the time of cataract surgery calculated for any of the three optical biometers.
Figure 1 Boxplot of the variability of Average K for group A2 from baseline to the time of cataract surgery for all three optical biometers.
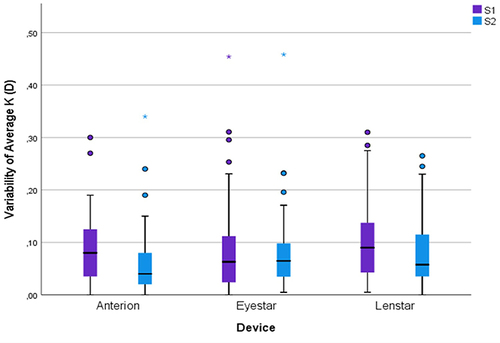
Figure 2 Boxplot of the variability of astigmatism for group A2 from baseline to the time of cataract surgery for all three optical biometers.
The percentages of eyes with variability of astigmatism of 0.25 D or higher before and after treatment were calculated for group A2 for all three optical biometers. There were no statistically significant differences (p=0.35 for Anterion, p=1 for Eyestar, and p=0.84 for Lenstar).
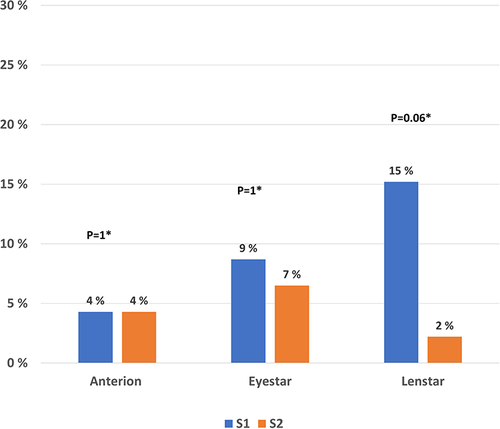
The percentages of eyes with variability of astigmatism of 0.5 D or higher before and after DED treatment were also calculated for group A2. For the Lenstar, the percentages of eyes with variability of astigmatism greater than 0.5 D were lower after than before DED treatment. However, the differences did not reach statistical significance, but it was a trend towards fewer subjects with outliers after treatment with artificial tears The results are presented in .
Figure 3 Bar chart of percentages of eyes with astigmatism of 0.5 D or higher for group A2 from baseline to the time of cataract surgery for all three optical biometers.
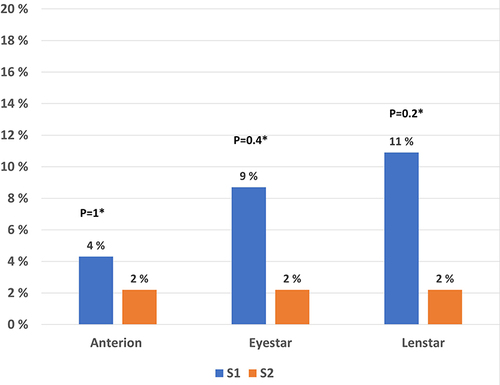
Finally, the percentages of eyes with variability of average K of 0.25 D or higher before and after treatment were calculated for group A2. For the Lenstar and Eyestar the percentages of eyes were lower after treatment, but the differences did not reach statistically significance. The results are presented in .
Figure 4 Bar chart of percentages of eyes with average K of 0.25 D or higher for group A2 from baseline to the time of cataract surgery for all three optical biometers.
Refractive Predictability
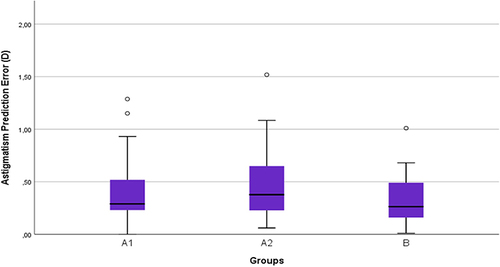
The refractive predictability was compared between untreated dry eyes (group A1) and non-dry eyes (group B) by comparing the AE and APE. None of these comparisons showed any statistically significant differences (p-value for AE 0.8 and APE 0.2). Likewise, the refractive predictability was compared between untreated dry eyes (group A1) and treated dry eyes (group A2) ( and ). There was no statistically significant difference found in any of the comparisons (p-values for AE were 0.8 and for APE were 0.2). The mean AE was 0.3 ± 0.24, 0.29 ± 0.24 and 0.31 ± 0.27 for groups A1, A2 and B, respectively. The mean for APE was for group A1 0.39 ± 0.27, group A2 0.47 ± 0.3, and for group B 0.32 ± 0.21.
Figure 5 Boxplot of AE in non-dry eyes (group (B), untreated dry eyes (group A1), and treated dry eyes (group A2).
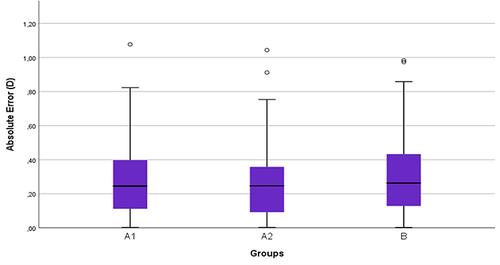
Figure 6 Boxplot of refractive astigmatism prediction error (magnitude of vector difference) in non-dry eyes (group (B), untreated dry eyes (group A1), and treated dry eyes (group A2).
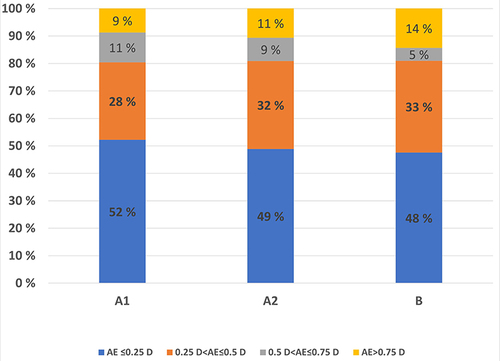
The percentages of cases within the four diopter ranges (≤ 0.25 D, 0.26 to ≤ 0.50 D, 0.51 D to ≤ 0.75 D, and ≥ 0.75 D) were calculated for both AE and APE. The results for AE are presented in . There were no statistically significant differences between the groups B and A1 and between the groups A1 and A2 (treatment) (p-value> 0.71, Fisher`s Exact Test).
Figure 7 Stacked bar chart of percentages of absolute error for the four diopter ranges within the three groups.
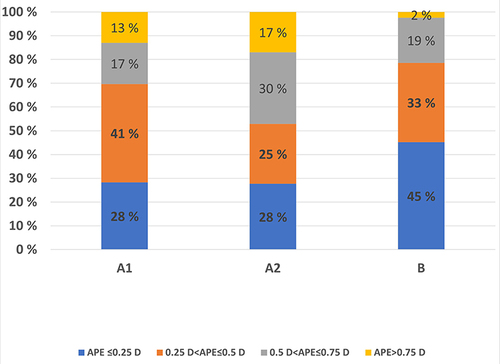
The results for the astigmatism prediction error (APE) are presented in . As for AE, there were no statistically significant differences between groups B and A1 (p>0.1) and between A1 and A2 (p > 0.1, Fisher`s Exact Test).
Figure 8 Stacked bar chart of percentages of astigmatism prediction error for the four diopter ranges within the three groups.
Discussion
The present study showed that artificial tear drops instilled for two weeks prior to cataract surgery did not statistically significantly improve the variability of keratometry measurements from baseline to the time of cataract surgery 2 weeks after. This finding is consistent with the results of Jensen et.al.Citation13 With the use of the IOLMaster 700 they did not find statistically significant differences in K- value repeatability for subjects treated with artificial tears versus a non-treated control group. However, no dry eye diagnostics were performed in that study. Artificial tears immediately right before keratometry measurements have been investigated by Roggla et.al.Citation25 The artificial tears actually increased the variability after 30 seconds and 2 minutes for subjects with dry eyes. In the present study DED subjects were treated with artificial tears only. There are other studies that are comparable to the present study. Hovanesian et al reported significantly improved preoperative measurements among subjects receiving the anti-inflammatory eye drop Lifitegrast.Citation11 After receiving Lifitegrast for 28 days, there were significantly fewer subjects with outliers of 0.25, 0.50, and 0.75 D in spherical equivalent. Additionally, Hovanesian et al found statistically significantly improved refractive precision (absolute prediction error of spherical equivalent) in another study of subjects treated with cyclosporine 0.09% for 28 days.Citation10 The absolute prediction error was 0.39 ± 0.30D and 0.33 ± 0.25D before and after treatment, respectively. While the difference was found to be statistically significant, it was relatively small. A limitation in both studies is the absence of osmolarity measurements, as only instability of the tear film (TBUT) and corneal staining were evaluated. In a study by Kim et al, they observed that subjects receiving 0.05% cyclosporine A, 0.5% loteprednol etabonate (corticosteroid), and eyelid scrubs with warm compresses over a two-week treatment period achieved improved refractive precision and fewer refractive surprises.Citation12 They found mean absolute errors of 0.38 ± 0.34D and, 0.24 ± 0.19D in the non-pretreatment and pretreatment groups, respectively. Compared to the Hovanesian et al study,Citation10 the mean differences were slightly larger. In addition, they found significantly fewer refractive surprises (defined as MAE ≥ 0.75D) in the treated group. However, it is noteworthy that this study featured three interventions, and osmolarity was not measured. The treatments in the studies of Hovanesian et al and Kim et al correspond to step two of the DEWS II treatment plan, representing a step up from the intervention employed in the present study.Citation14 In total, this suggests that a more advanced level of treatment (ie, more than artificial tears) may be necessary to stabilize the tear film before cataract surgery.Citation26
During the present study, the diagnostic criteria of DEWS II were applied to diagnose dry eye patients. Patients receiving DED treatment with artificial tears showed a tendency of lower variability of keratometry (astigmatism) with the Lenstar, but this was not statistically significant (). Therefore, it may not be expected that the treatment would significantly improve refractive predictability. Non-dry eye subjects had fewer outliers of APE>0.75D dry eye subjects, but the finding was not statistically significant. The reason for this could be that these criteria are not optimal to detect which patients are at risk for inaccurate keratometry. A previous study (Data submitted, not yet published) indicated that hyperosmolarity and instability of the tear film (positive NIKBUT) were the dry eye signs that had a significant impact on keratometry measured by reflection-based optical biometers, not ocular surface staining (OSS). Preoperative keratometry is only one of several factors that affect postoperative refractive precision. For instance, capsular bag shrinkage, IOL power manufacturing tolerance and the variability in postoperative subjective refraction may outweigh the variability of keratometry, especially if the indication for treatment was suboptimal.Citation27,Citation28 Further research is of interest to determine if DED-treatment based on hyperosmolarity and instability of the tear film (positive NIKBUT) could improve preoperative keratometry and refractive prediction.
This study was limited to a two-week treatment period, but a longer treatment period with artificial tears may have more effect on keratometry measurements. More research is needed to answer this question. It is worth mentioning that both the studies by Kim et al and the study by Hovanesian et al utilized biometers with reflection-based keratometry, the IOL Master 500 (Kim et al) and IOL Master 500/700 (IOL Master 700 is a combined reflection-based and OCT-based) (Hovanesian et.al).Citation10–12 The present study applied three different optical biometers, including one reflection-based biometer (Lenstar 900) and one partly reflection-based biometer (Eyestar) which makes the studies comparable. While the IOL Master 500/700 and Lenstar 900 use reflection-based keratometry, there exist inherent differences between them that may account for some of the divergent outcomes of the respective studies.
Improved technology among the newer reflection-based optical biometers (like Eyestar and Lenstar 900) may reduce problems with tear instability.
The are limitations to the study. First, the time between the two measurements for every device varied from 10 to 20 minutes for each subject. Increased time between the two measurements could stabilize a tear film and, therefore, affect the results. Second, there is uncertainty whether the osmolarity measured in the tear meniscus is representative of the central corneal surface,Citation4 it may be an under-estimation.Citation29 Third, differences in temperature and humidity could affect osmolarity measurements, though correlations between osmolarity and temperature/humidity were weak. Also, the R² values for temperature and humidity in relation to osmolarity were 0.03 and 0.09, respectively, which are very low. Therefore, fluctuations in temperature and humidity are unlikely to account for the variance in osmolarity. Fourth, we assumed that any toric IOL was oriented at the intended axis in the capsular bag, but this was not checked postoperatively, and therefore, the astigmatism prediction error could have been affected. Fifth, even though the subjective refraction was performed by an experienced optometrist, determining the manifest refraction is known to have some uncertainty.Citation30 Sixt, the sample size calculations of the study were based on differences in means in average Keratometry and refractive predictability, and this may limit the ability to detect statistically significant differences of outliers between the study groups.
Conclusion
Subjects with dry eyes (treated and non-treated) achieved the same refractive precision and percentages of outliers as subjects with non-dry eyes. Treatment with artificial tears for two weeks appeared inadequate to significantly affect variability in biometric measurements for patients with dry eyes prior to cataract surgery. DEWS II criteria for DED may not be optimal in a cataract setting.
Disclosure
Dr Richard Potvin reports personal fees from Alcon and Hoya, outside the submitted work. Mrs Øygunn Utheim reports grants from Norwegian Research Council. Dr Bjørn Gjerdrum reports grants from The Research council of Norway, during the conduct of the study. The authors report no other conflicts of interest in this work.
Data Sharing Statement
The raw data and the deidentified files are stored on a secure server (TSD, Tjenester for Sensitive Data) at the University of Oslo for 10 years. The raw data can be available from the Corresponding Author upon request.
References
- Papas EB. The global prevalence of dry eye disease: a Bayesian view. Ophthalmic Physiol Opt. 2021;41(6):1254–1266. doi:10.1111/opo.12888
- Schein OD, Muñoz B, Tielsch JM, Bandeen-Roche K, West S. Prevalence of dry eye among the elderly. Am J Ophthalmol. 1997;124(6):723–728. doi:10.1016/s0002-9394(14)71688-5
- Stapleton F, Alves M, Bunya VY, et al. TFOS DEWS II Epidemiology Report. Ocul Surf. 2017;15(3):334–365. doi:10.1016/j.jtos.2017.05.003
- Willcox MDP, Argüeso P, Georgiev GA, et al. TFOS DEWS II Tear Film Report. Ocul Surf. 2017;15(3):366–403. doi:10.1016/j.jtos.2017.03.006
- Rieger G. The importance of the precorneal tear film for the quality of optical imaging. Br J Ophthalmol. 1992;76(3):157–158. doi:10.1136/bjo.76.3.157
- Goto E, Yagi Y, Matsumoto Y, Tsubota K. Impaired functional visual acuity of dry eye patients. Am J Ophthalmol. 2002;133(2):181–186. doi:10.1016/s0002-9394(01)01365-4
- Olsen T. Sources of error in intraocular lens power calculation. J Cataract Refract Surg. 1992;18(2):125–129. doi:10.1016/s0886-3350(13)80917-0
- Epitropoulos AT, Matossian C, Berdy GJ, Malhotra RP, Potvin R. Effect of tear osmolarity on repeatability of keratometry for cataract surgery planning. J Cataract Refract Surg. 2015;41(8):1672–1677. doi:10.1016/j.jcrs.2015.01.016
- Gjerdrum B, Gundersen KG, Lundmark PO, Aakre BM. Repeatability of OCT-based versus scheimpflug- and reflection-based keratometry in patients with hyperosmolar and normal tear film. Clin Ophthalmol. 2020;14:3991–4003. doi:10.2147/opth.S280868
- Hovanesian JA, Berdy GJ, Epitropoulos A, Holladay JT. Effect of cyclosporine 0.09% treatment on accuracy of preoperative biometry and higher order aberrations in dry eye patients undergoing cataract surgery. Clin Ophthalmol. 2021;15:3679–3686. doi:10.2147/opth.S325659
- Hovanesian J, Epitropoulos A, Donnenfeld ED, Holladay JT. The effect of lifitegrast on refractive accuracy and symptoms in dry eye patients undergoing cataract surgery. Clin Ophthalmol. 2020;14:2709–2716. doi:10.2147/opth.S264520
- Kim J, Kim MK, Ha Y, Paik HJ, Kim DH. Improved accuracy of intraocular lens power calculation by preoperative management of dry eye disease. BMC Ophthalmol. 21(1):364. doi:10.1186/s12886-021-02129-5
- Jensen MN, Søndergaard AP, Pommerencke C, Møller F. Variations in keratometric values (K-value) after administration of three different eye drops - effects on the intraocular lens calculations in relation to cataract surgery. Acta Ophthalmol. 2020;98(6):613–617. doi:10.1111/aos.14408
- Jones L, Downie LE, Korb D, et al. TFOS DEWS II management and therapy report. Ocul Surf. 2017;15(3):575–628. doi:10.1016/j.jtos.2017.05.006
- Graae Jensen P, Gundersen M, Nilsen C, et al. Prevalence of dry eye disease among individuals scheduled for cataract surgery in a Norwegian cataract clinic. Clin Ophthalmol. 2023;17:1233–1243. doi:10.2147/opth.S407805
- Nilsen C, Graae Jensen P, Gundersen M, et al. The significance of inter-eye osmolarity difference in dry eye diagnostics. Clin Ophthalmol. 2023;17:829–835. doi:10.2147/opth.S402556
- Wolffsohn JS, Arita R, Chalmers R, et al. TFOS DEWS II diagnostic methodology report. Ocul Surf. 2017;15(3):539–574. doi:10.1016/j.jtos.2017.05.001
- Osmolarity Tests Cards. Instructions for Use. TearLab; 2016.
- Keratograph_5M user guide.pdf.
- Bron AJ, Evans VE, Smith JA. Grading of corneal and conjunctival staining in the context of other dry eye tests. Cornea. 2003;22(7):640–650. doi:10.1097/00003226-200310000-00008
- Anterion user manual.pdf.
- Eyestar 900 user manual.pdf.
- Lenstar 900 User guide pdf.
- Charalampidou S, Cassidy L, Ng E, et al. Effect on refractive outcomes after cataract surgery of intraocular lens constant personalization using the Haigis formula. J Cataract Refract Surg. 2010;36(7):1081–1089. doi:10.1016/j.jcrs.2009.12.050
- Röggla V, Leydolt C, Schartmüller D, et al. Influence of artificial tears on keratometric measurements in cataract patients. Am J Ophthalmol. 2021;221:1–8. doi:10.1016/j.ajo.2020.08.024
- Starr CE, Gupta PK, Farid M, et al. An algorithm for the preoperative diagnosis and treatment of ocular surface disorders. J Cataract Refract Surg. 2019;45(5):669–684. doi:10.1016/j.jcrs.2019.03.023
- Hill WE, Abulafia A, Wang L, Koch DD. Pursuing perfection in IOL calculations. II. Measurement foibles: measurement errors, validation criteria, IOL constants, and lane length. J Cataract Refract Surg. 2017;43(7):869–870. doi:10.1016/j.jcrs.2017.07.006
- Norrby S. Sources of error in intraocular lens power calculation. J Cataract Refract Surg. 2008;34(3):368–376. doi:10.1016/j.jcrs.2007.10.031
- Bron AJ, de Paiva CS, Chauhan SK, et al. TFOS DEWS II pathophysiology report. Ocul Surf. 2017;15(3):438–510. doi:10.1016/j.jtos.2017.05.011
- Grein HJ, Schmidt O, Ritsche A. Reproducibility of subjective refraction measurement. Ophthalmologe. 2014;111(11):1057–1064. doi:10.1007/s00347-014-3064-6