
Abstract
Purpose
The aim of this study is to compare the diagnostic performance in differentiating patients with glaucoma from those with presumed large physiological optic disc cupping (LPC), using optic nerve head hemoglobin levels (ONH Hb), as a screening method, versus the evaluation of general ophthalmologists.
Patients and Methods
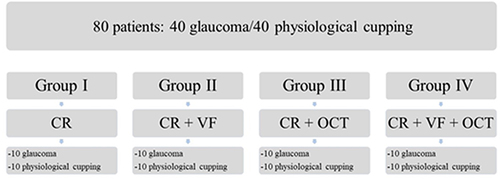
Twenty general ophthalmologists evaluated PowerPoint images of 40 patients with glaucoma and 40 presenting LPC. Presentation of patient’s exams were distributed as follows: Group 1 (GI): color retinography (CR), Group 2 (GII): CR + visual field (VF), Group 3 (GIII): CR + optical coherence tomography (OCT), Group 4 (GIV): CR + VF + OCT. The Laguna ONhE software was used to estimate ONH Hb based on CR. Main outcomes were the comparison of sensitivity and accuracy between general ophthalmologists’ evaluation and the glaucoma discriminant function (GDF) index from Laguna ONhE and also the agreement between examiners (Kappa statistics).
Results
Laguna ONhE GDF index demonstrated higher sensitivity values (GI- 90%; GII-90%; GIII-100%; GIV-100%) comparing to all groups (GI-59%; GII-86.5%; GIII-86.5%; GIV-68.5%). In GI, in which it was observed the worst accuracy result (64.8%), we found 75% for GDF. In GII, the accuracy was 81.3% and we found 55% for GDF. The highest agreement was in GII (Kappa=0.63; 95% CI=0.53–0.72), and the lowest in GI (Kappa=0.30; 95% CI=0.20–0.39).
Conclusion
Laguna ONhE software, a low-cost and non-invasive method, showed good sensitivity and great utility as a screening method in differentiating patients with glaucoma from those with LPC, compared with evaluation of general ophthalmologists.
Introduction
Glaucoma is a neuropathy characterized by damage to the optic nerve and retinal nerve fiber layer (RNFL) associated with changes in the visual field (VF).Citation1,Citation2 Its early diagnosis, adequate treatment and monitoring of progression are essential to avoid blindness.Citation3–6 Many patients are evaluated by general ophthalmologists being the access to glaucoma specialists limited, which can make the diagnosis difficult, especially in optic discs with challenging appearances.Citation7–9
In order to improve diagnostic performance, objective imaging modalities have been incorporated, such as optical coherence tomography (OCT).Citation10–13 The use of these instruments, as well as the combination of different tests, can improve the diagnostic ability of non-specialists.Citation7 However, their high cost may limit their use on a large scale.Citation14
More recently, based on the vascular dysfunction theory, studies have demonstrated low levels of estimated optic nerve head hemoglobin levels (ONH Hb) in patients with glaucoma.Citation15–21 This measurement is performed using a software (Laguna ONhE) accessing color retinography (CR), by colorimetric analysis, in a fast, non-invasive and low-cost method. Medina-Mesa et al showed that the amount of hemoglobin was significantly lower in 121 glaucomatous eyes comparing with 100 healthy patients.Citation22 Our group demonstrated significant associations between ONH Hb values and both structural and functional damage in glaucoma.Citation23
As aforementioned, early diagnosis of glaucoma can be clinically challenging for non-specialists and expensive imaging modalities are not easily available. In this context, a low-cost tool that could alert the clinician about which eyes are possibly present with glaucoma, would be clinically useful. Therefore, we aimed to compare the diagnostic ability of automated ONH Hb measurements, through the Laguna ONhE software, as a screening method, versus the performance of non-glaucoma specialists, in differentiating patients with glaucoma from those with presumed large physiological optic disc cupping (LPC).
Materials and Methods
The study protocol was approved by the institutional review board/ethics committee of the Federal University of Goiás (number: 1.779.270), adhering to the tenets of the Declaration of Helsinki. Written informed consent was obtained from all participants.
Participants
A cross-sectional study was carried-out in which glaucomatous patients and participants with presumed LPC were consecutively enrolled. Patients were included in the glaucoma group if they presented sign of glaucomatous optic neuropathy (GON) and characteristic VF defects. GON was defined as increased vertical cup/disc ratio (VCDR) >0.6 and/or VCDR asymmetry greater than 0.2 between eyes, both associated with neuroretinal rim notching or localized RNFL defects (with no evidence of any other disease that could justify these findings).Citation24 Characteristic VF defects were: glaucoma hemifield test values outside the normal limits, a probability of less than 5% demonstrated by the pattern standard deviation (PSD) index or three or more points in clusters, on the PSD plot, with a probability of less than 5%.Citation25
Participants considered with LPC were included if they had increased VCDR (>0.6), intraocular pressure (IOP) < 21 mmHg, absence of signs in the optic nerve head (ONH) or RNFL suggestive of glaucoma (neuroretinal rim notching, localized RNFL defects and disc hemorrhage) and normal VF test.Citation26,Citation27 All LPC participants had to have no evidence of functional nor structural changes during a minimum follow-up of 24 months.
In addition to the specific inclusion criteria for each group mentioned above, all participants were also required to: the best corrected visual acuity ≥ 20/30 and ability to perform VF test. The last reliable VF test was selected.
Exclusion criteria for both groups consisted of age under 18 years, intraocular surgery performed in less than 6 months (except cataract surgery) and any ocular changes that could interfere with VF, CR and/or OCT results.
Two glaucoma specialists (C.G.; L.M.), with access to all clinical data and exams, classified each participant as glaucoma or LPC. In cases of disagreement, a third investigator was used for adjudication.
Exams and Data Collection
All patients underwent the following tests: CR (Visucam Lite, Carl Zeiss Meditec, Jena, Germany), VF test-SITA standard 24–2 (Humphrey Systems, Dublin, CA) and RTVue OCT (Optovue Inc., Fremont, CA). All tests were performed by an experienced technician, during an interval of less than 7 days. Whenever both eyes were available, the right eye was arbitrarily chosen. Reliability criteria for VF test were: false positives and negatives < 33% and fixation loss < 20%.Citation28 All patients had previous experience with the VF test (> 3 previous exams). Only OCT exams with signal strength greater than 30 and with adequate centering and segmentation images were considered. The protocols used in the images of OCT were evaluations of the optic nerve head and ganglion cell complex.
Patients were randomized into 4 groups, containing an equal number of participants with glaucoma and LPC. The images were prepared using a PowerPoint presentation. Group 1 (GI) only CR images, Group 2 (GII) CR + VF, Group 3 (GIII) CR + OCT and finally Group 4 (GIV) CR + VF + OCT (). A single PowerPoint file was sent by e-mail (Microsoft Office Professional) to 20 non-glaucoma specialists. Internet-based randomization (www.randomization.com) was used to distribute the patients along the different groups and to generate the order of the images. Adequate time was guaranteed for the examiners to analyze the slides and all of them signed a consent form. An excel table was sent, containing only the patient numbers and the ophthalmologists were instructed to answer whether or not the patients had glaucoma. They were aware that in each group half of the patients (10) had glaucoma and the other half had LPC (10).
Figure 1 Study protocol fluxogram for the entire sample.
The levels of ONH Hb were measured by the Laguna ONhE software based on CR. The methodology, characteristics, as well as the reproducibility of the software were previously described in detail.Citation17,Citation29 In summary, it consists of estimating ONH Hb through a colorimetric analysis, in which areas with low levels of hemoglobin reflect better green and blue lights, while regions with high levels reflect red components.Citation17,Citation29 The highest concentration of hemoglobin is considered in the central vessels of the retina, which are used as a reference. From this, the software provides a color scale, demonstrating that areas with warm colors represent places with a higher estimated value of OHN Hb and areas with cold colors represent places with lower values, which occur in regions of lower perfusion.Citation17,Citation29 The software determines a glaucoma discriminant function (GDF) index by dividing the ONH into 24 sectors.Citation18,Citation29 GDF results may range from −100 to +100, tends to be positive in normal eyes and negative in those with glaucoma, with lower GDF values indicating worst damage.Citation30 The index also takes into account, when determining the value, whether low ONH Hb estimates occur in regions most affected by localized glaucomatous damage.Citation30 This methodology yields the GDF with a sensitivity of approximately 89% at 95% specificity.Citation17,Citation18,Citation20
Data Analysis
Descriptive analysis was used to present demographic and clinical data. Qualitative variables were analyzed by Fisher’s and chi-square tests. Shapiro–Wilk and Kolmogorov–Smirnov tests were used to determine the normal distribution. Non-parametric quantitative variables were compared using the Kruskal–Wallis test. Multiple comparison tests were performed for statistically significant differences. The study's main outcome was the comparison of sensitivity and accuracy results between general ophthalmologists’ evaluation (from each of the 4 groups) and the Laguna ONhE GDF index. Secondary study outcomes were specificity (Sp), positive predictive value (PPV) and negative predictive value (NPV) results. Analyzes were made through the OpenEpi software (Dean AG, Sullivan KM, Soe MM. Open-Source Epidemiologic Statistics for Public Health, version 3). The mean of the number of correct answers were also compared between the different groups, and Kappa statistics (k) was used to access the agreement between examiners. Statistical analysis was performed using SPSS software, version 22.0 (Statistical Package for the Social Sciences; SPSS Inc, Chicago, IL, USA) and statistical significance was set at P< 0.05.
Results
A total of 80 eyes of 80 patients were included (40 with glaucoma and 40 with LPC) and evaluated by 20 ophthalmologists, resulting in 1600 slides. Patients with LPC were significantly younger than those with glaucoma (48.5±13.8 vs 65.2±12.7 years, respectively; p<0.001). Most of the patients were women (67.5%), with no significant difference in gender distribution (p=0.61). Automated image analysis by the software was not feasible in 4 cases due to poor retinography quality (1 glaucoma patient from GIII and 3 glaucoma patients from GIV).
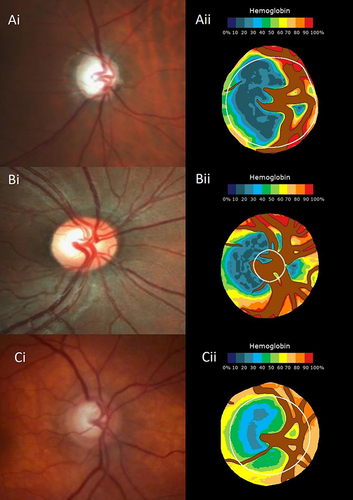
Regarding the Laguna ONhE, mean GDF values were significantly lower in eyes with glaucoma compared to those with LPC, with significant differences in GI (−36.2±25.6 vs 0.40±23.7; p=0.003), GII (−38.05 ± 31.38 vs −16.73 ± 17.81, p=0.02) and GIII (−42.72 ± 17.27 vs −24,50 ± 17.26, p=0.03). Examples of patients with and without glaucoma were shown in . We found an accuracy of 58%, Se 97.2%, Sp 25%, PPV 53.8%, NPV 90.9% for the GDF index. Having in mind, its screening performance, within group analyses revealed higher sensitivity values for the Laguna ONhE GDF (GI- 90%; GII-90%; GIII-100%; GIV-100%) comparing to all groups based on general ophthalmologists’ evaluation (GI-59%; GII-86.5%; GIII-86.5%; GIV-68.5%). In GI, in which it was observed the worst accuracy result for general ophthalmologists’ evaluation (64.8%), we found a 75% accuracy for GDF. In GII, in which it was observed the best accuracy results for general ophthalmologists (81.3%), we found a 55% accuracy for GDF. The comparisons of accuracy, Se, Sp, PPV and NPV values are provided in .
Table 1 Comparison of Accuracy, Sensitivity, Specificity, Positive Predictive Value and Negative Predictive Value in Group I, II, III, IV and the Software Laguna ONhE
Figure 2 Example of patients with glaucoma and presumed large physiological cupping.(Ai)-retinography of the optic disc of patient with glaucoma (from Group III), (Aii)- correspondent pseudo-image estimating the amount of hemoglobin (according to the colorimetric scale shown). Correct diagnosis of glaucoma, with Glaucoma Discriminant Function index (GDF) of −81.99. (Bi)- retinography of the optic disc of patient with large physiological cupping (LPC) from Group I. (Bii)- correspondent pseudo-image estimating the amount of hemoglobin, correct diagnosis of LPC, with GDF of 31.17. (Ci)- retinography of the optic disc of patient with large physiological cupping (from Group (I). (Cii)- correspondent pseudo-images estimating the amount of hemoglobin and misdiagnosis of glaucoma with GDF −57.57.
The intra-observer kappa coefficients were significantly different between the 4 groups (p<0.001). GII had the highest rate (k= 0.63, 95% CI 0.53–0.72), followed by GIII (k= 0.58, 95% CI 0.48–0.68), GIV (k=0.41, 95% CI 0.31–0.51) and GI (k=0.30. 95% CI 0.20–0.39).
Analysis of OCT revealed a VCDR of 0.89±0.13 in patients with glaucoma and 0.84±0.10 in those with LPC (p=0.002). Mean values of the optic disc area were 2.03±0.52 mm2 in patients with glaucoma and 2.17±0.46 mm2 in those with LPC (p=0.196). Disc area greater than 2 mm2 occurred in 45% of the patients with glaucoma and 62.5% in those with LPC (p=0.180). Considering the 2 groups (GII and IV) in which VF test results from glaucomatous eyes were provided, the mean of mean deviation (MD) index was −8.17±5.19 dB and mean PSD was 7.43±3.63 dB. provides the VF results in detail. Considering the 2 groups (GIII and IV) in which OCT results from glaucomatous eyes were provided (), mean average RNFL thickness was 86.55±27.09 µm.
Table 2 Comparison of Visual Field Parameters Between GII (n=10) and GIV (n=10), Among Patients with Glaucoma
Table 3 Comparison of Optical Coherence Tomography Parameters Between GIII (n=10) and GIV (n=10), Among Patients with Glaucoma
Discussion
We conducted a study comparing the estimation of ONH Hb with the performance of non-glaucoma specialists evaluating CR only and the combination of this with VF and/or OCT to distinguish glaucoma from LPC. To our knowledge, this is the first study comparing Laguna ONhE with non-specialist diagnostic performance. Having in mind its screening applicability, comparatively, we found good sensitivity results and fair accuracy with this automated CR-based analysis. This finding is strengthened by the fact that not only the study population was mostly comprised of eyes with mild to moderate glaucoma, but also that our controls had large cupping, resulting in a more challenging diagnostic scenario.
Optic disc clinical evaluation, even by specialists, shows low agreement, which can be explained in part by the different anatomical variations.Citation7,Citation31–34 In this study, the group in which only retinography was available (GI) presented the worst diagnostic performance and poor agreement among non-specialists (k=0.30). Accuracy was better when VF and/or OCT was added to the CR analysis.Citation35–39 Comparing the ability of general ophthalmologists to differentiate glaucomatous from normal eyes, Vessani et al have shown that OCT results overcomes physicians’ subjective assessment of the ONH using stereophotos.Citation7
Previous studies have evaluated the diagnostic performance of the Laguna ONhE software.Citation18,Citation20,Citation21 De la Rosa et al showed that GDF had an area under the curve (AUC) 0.97, with a sensitivity of 89%, comparing patients with glaucoma and controls.Citation18 In this study, hemoglobin levels showed a good correlation with the cup to disc ratio of OCT (0.71).Citation18 Meneses et al demonstrated a good accuracy of hemoglobin measurements in differentiating healthy individuals from eyes with mild glaucoma, with GDF index showing a Se of almost 80%.Citation40 Estimated hemoglobin levels were higher in almost all sectors (21/24) comparing patients with glaucoma and controls (p<0.05).Citation40 Our study demonstrated a more realistic clinical scenario, in which all participants had a suspicious ONH appearance. We believe it was a more challenging situation for both the physicians and the software itself than the conventional diagnostic studies, in which all control eyes usually have small cupping (physiological appearance). Our findings not only suggest a good screening applicability for the software itself, but also that it provides greater sensitivity results than general ophthalmologists’ evaluation.
Considering structure-functional correlations in glaucoma, our group has previously shown a significant linear correlation between hemoglobin levels and OCT parameters and a significant nonlinear correlation between GDF and VF values.Citation23 Analyzing the GDF pattern in different glaucoma stages, we documented that the GDF values decay may precede VF changes overtime. Other studies also showed good agreement between ONH Hb and both OCT and VF, based on Octopus and Easyfield perimeters.Citation20–22,Citation41 Mendez-Hernandez et al comparing control with suspected and diagnosed glaucoma patients, found an area under the receiver operating characteristic curve of 0.80 for OCT retinal nerve fiber layer thickness and 0.78 for GDF (p=0.59).Citation20
It is important to discuss our main clinical implications. It is crucial to facilitate the early diagnosis of glaucoma by non-specialist. In this context, different devices have been used to evaluate the vascular dysfunction, such as echo doppler, oxygen concentration measurement in the ONH and OCT angiography.Citation42–45 The Laguna ONhE software can potentially be an easy, non-invasive and low-cost tool. Based on its good sensitivity, good NPV and fair accuracy results, even in this challenging study population, the software could add on daily practice, as a screening method. Eyes with suspicious ONH appearance presenting with an abnormal GDF result would then deserve an evaluation by a glaucoma specialist or undergo further ancillary exams to confirm or rule-out the glaucoma diagnosis. On the other hand, most cases with negative results would likely not require such investigation. It should be noted the low specificity values presented by the software in our study. Conversely, in a study in a different population, Mendez-Hernandez et al found much better specificity results for the GDF index (over 70%).Citation20 As aforementioned, this fact is likely related to the optic disc appearance of our controls. For instance, Prata et al demonstrated that OCT parameters had a limited diagnostic ability when controls had a suspicious ONH appearance, instead of a small physiological cupping.Citation46 Another reason could be the decrease in specificity in eyes with larger optic discs. In our study, 62.5% of the individuals in the LPC group had medium to large discs. Corroborating these results, some studies showed that the diagnostic performance of OCT measurement deteriorates as the optic disc size enlarges.Citation47–50
Some specific limitations of our study should be addressed. First, the distribution of patients into the groups did not take into account the level of glaucomatous damage, which may have interfered with the performance of non-specialists, knowing that the diagnostic sensitivity increases with the greater severity of the disease.Citation35,Citation47–49 Second, all examiners were aware that 50% of the patients in each group had glaucoma. This fact may have interfered with diagnostic accuracy. Besides that, the diagnostic performance in the last group may have been influenced by examiners fatigue. However, it should be noted that no time limit was imposed for the analyses and it could be performed in the sequence preferred by each ophthalmologist. Third, the study diagnostic scenario does not resemble a real life scenario, as examiners did not have access to patients’ clinical history, longitudinal assessments, or the possibility of comparison with the contralateral eye. Furthermore, we must mention the possibility that other factors could interfere with hemoglobin levels. But, on the other hand, several studies since 2013 have demonstrated low levels of ONH Hb in glaucoma patients. The indices provided by the software proved to be different between control and glaucoma patients, reproducible and with good structure-structure and structure-function correlation.Citation18,Citation20–23,Citation29,Citation30,Citation40,Citation41 Finally, the results should not be extrapolated to other populations.
Conclusion
Laguna ONhE software, a low-cost and non-invasive method, showed good sensitivity and great utility as a screening method in differentiating patients with glaucoma from those with LPC, compared with evaluation of general ophthalmologists. Future studies are needed to evaluate the performance of the software in the longitudinal follow-up of individuals with suspected or diagnosed glaucoma.
Disclosure
Dr Augusto Paranhos Jr reports grants from Topcon, outside the submitted work. Prof. Dr. Tiago Prata reports non-financial support from Retinalize, during the conduct of the study. The authors report no other conflicts of interest in this work.
Additional information
Funding
References
- Weinreb RN, Aung T, Medeiros FA. The pathophysiology and treatment of glaucoma: a review. JAMA. 2014;311(18):1901–1911. doi:10.1001/jama.2014.3192
- Jonas JB, Aung T, Bourne RR, Bron AM, Ritch R, Panda-Jonas S. Glaucoma. Lancet. 2017;390(10108):2183–2193. doi:10.1016/S0140-6736(17)31469-1
- Tham YC, Li X, Wong TY, Quigley HA, Aung T, Cheng CY. Global prevalence of glaucoma and projections of glaucoma burden through 2040: a systematic review and meta-analysis. Ophthalmology. 2014;121(11):2081–2090. doi:10.1016/j.ophtha.2014.05.013
- Kingman S. Glaucoma is second leading cause of blindness globally. Bull World Health Organ. 2004;82(11):888.
- Weinreb RN, Tee Khaw P. Primary open-angle glaucoma. Lancet. 2004;363(9422):1711–1720. doi:10.1016/S0140-6736(04)16257-0
- Peters D, Bengtsson B, Heijl A. Factors associated with lifetime risk of open-angle glaucoma blindness. Acta Ophthalmol. 2014;92(5):421–425. doi:10.1111/aos.12203
- Vessani RM, Moritz R, Batis L, Zagui RB, Bernardoni S, Susanna R. Comparison of quantitative imaging devices and subjective optic nerve head assessment by general ophthalmologists to differentiate normal from glaucomatous eyes. J Glaucoma. 2009;18(3):253–261. doi:10.1097/IJG.0b013e31818153da
- Hwang YH, Kim YY, Jin SY, Na JH, Kim HK, Sohn YH. Errors in neuroretinal rim measurement by Cirrus high-definition optical coherence tomography in myopic eyes. Br J Ophthalmol. 2012;96(11):1386–1390. doi:10.1136/bjophthalmol-2012-301713
- Song AP, Wu XY, Wang JR, Liu W, Sun Y, Yu T. Measurement of retinal thickness in macular region of high myopic eyes using spectral domain OCT. Int J Ophthalmol. 2013;7(1):122–127. doi:10.3980/j.issn.2222-3959.2014.01.23
- Gracitelli CPB, Moreno PA, Leite MT, Prata TS. Identification of the most accurate spectral-domain optical coherence tomography parameters in eyes with early high-tension and low-tension glaucoma. J Glaucoma. 2016;25(10):854–859. doi:10.1097/IJG.0000000000000406
- Gracitelli CP, Abe RY, Medeiros FA. spectral-domain optical coherence tomography for glaucoma diagnosis. Open Ophthalmol J. 2015;9(1):68–77. doi:10.2174/1874364101509010068
- Prata TS, Lopes FS, Prado VG, et al. In vivo analysis of glaucoma-related features within the optic nerve head using enhanced depth imaging optical coherence tomography. PLoS One. 2017;12(7):1–10. doi:10.1371/journal.pone.0180128
- Leite MT, Rao HL, Zangwill LM, Weinreb RN, Medeiros FA. Comparison of the diagnostic accuracies of the spectralis, cirrus, and RTVUE optical coherence tomography devices in glaucoma. Ophthalmology. 2011;118(7):1334–1339. doi:10.1016/j.ophtha.2010.11.029
- Olson J, Sharp P, Goatman K, et al. Improving the economic value of photographic screening for optical coherence tomography-detectable macular oedema: a prospective, multicentre, UK study. Health Technol Assess. 2013;17(51):1–141. doi:10.3310/hta17510
- Jia Y, Morrison JC, Tokayer J, et al. Quantitative OCT angiography of optic nerve head blood flow. Biomed Opt Express. 2012;3(12):3127. doi:10.1364/boe.3.003127
- Jia Y, Wei E, Wang X, et al. Optical coherence tomography angiography of optic disc perfusion in glaucoma. Ophthalmology. 2014;121(7):1322–1332. doi:10.1016/j.ophtha.2014.01.021
- Mendez-Hernandez C, Wang S, Arribas-Pardo P, et al. Diagnostic validity of optic nerve head colorimetric assessment and optical coherence tomography angiography in patients with glaucoma. Br J Ophthalmol. 2021;105(7):957–963. doi:10.1136/bjophthalmol-2020-316455
- de la Rosa MG, Gonzalez-Hernandez M, Sigut J, et al. Measuring hemoglobin levels in the optic nerve head: comparisons with other structural and functional parameters of glaucoma. Invest Ophthalmol Vis Sc. 2013;54(1):482–489. doi:10.1167/iovs.12-10761
- Tezel G, Yang X, Luo C, et al. Hemoglobin expression and regulation in glaucoma: insights into retinal ganglion cell oxygenation. Invest Ophthalmol Vis Sc. 2010;51(2):907–919. doi:10.1167/iovs.09-4014
- Rosa MG, Mendez-hernandez C, Rodriguez-u I, Arribas-pardo P, Garcia-feijoo J. Glaucoma diagnostic capacity of optic nerve head haemoglobin measures compared with spectral domain OCT and HRT III confocal tomography. Acta Ophthalmol. 2016;94(7):697–704. doi:10.1111/aos.13050
- Gonzalez-hernandez M, Saavedra JS, Gonzalez M, Rosa D. Relationship between retinal nerve fiber layer thickness and hemoglobin present in the optic nerve head in glaucoma. J Ophthalmol. 2017;2017:1–10. doi:10.1155/2017/2340236
- Medina-Mesa E, Gonzalez-Hernandez M, Sigut J, et al. Estimating the amount of hemoglobin in the neuroretinal rim using color images and oct. Curr Eye Res. 2016;41(6):798–805. doi:10.3109/02713683.2015.1062112
- Rocha JAG, Dias DT, Lemos MBC, et al. Optic nerve head hemoglobin levels in glaucoma: a structural and functional correlation study. J Ophthalmol. 2021;7:1–8. doi:10.1155/2021/9916102
- Lopes FSS, Dorairaj S, Junqueira DLM, Furlanetto RL, Biteli LG, Prata TS. Analysis of neuroretinal rim distribution and vascular pattern in eyes with presumed large physiological cupping: a comparative study. BMC Ophthalmol. 2014;14(1):1–5. doi:10.1186/1471-2415-14-72
- Susanna R, Vessani RM, Hoddap F, Anderson P. Staging Glaucoma Patient: why and How? Open Ophthalmol J. 2009;3(1):59–64. doi:10.2174/1874364100903010059
- Swanson MW. The 975th and 995th percentile of vertical cup disc ratio in the United States. Optom Vis Sci. 2011;88(1):86–92. doi:10.1097/OPX.0b013e3181fc3638
- Foster PJ, Buhrmann R, Quigley HA, Johnson GJ. The definition and classification of glaucoma in prevalence surveys. Br J Ophthalmol. 2002;86(2):238–243. doi:10.1136/bjo.86.2.238
- Anderson D. Automated Static Perimetry. 2 ed. ed. St Louis: Mosby; 1999:363.
- Mendez-hernandez C, Garcia-feijoo J, Arribas-pardo P, Saenz-frances F, Rodriguez-un I. Reproducibility of optic nerve head hemoglobin measures. J Glaucoma. 2016;25(4):348–354. doi:10.1097/IJG.0000000000000160
- de la Rosa MG. Measuring hemoglobin levels in the optic nerve head for glaucoma management. Glaucoma Imaging. 2016;54:265–279.
- Varma R, Steinmann WC, Scott IU. Expert agreement in evaluating the optic disc for glaucoma. Ophthalmology. 1992;99(2):215–221. doi:10.1016/S0161-6420(92)31990-6
- Colicchio D, Terenzi AO, Rocha JG. Comparison of Fundus Biomicroscopy Examination of the Optic Nerve Head with and without Mydriasis. Ophthalmic Res. 2019;63(1):8–12. doi:10.1159/000500980
- Breusegem C, Fieuws S, Stalmans I, Zeyen T. Agreement and accuracy of non-expert ophthalmologists in assessing glaucomatous changes in serial stereo. Ophthalmology. 2011;118(4):742–746. doi:10.1016/j.ophtha.2010.08.019
- Abrams LS, Scott IU, Spaeth GL, Quigley HA, Varma R. Agreement among optometrists, ophthalmologists, and residents in evaluating the optic disc for glaucoma. Ophthalmology. 1994;101(10):1662–1667. doi:10.1016/S0161-6420(94)31118-3
- Mills RP, Budenz DL, Lee PP, et al. Categorizing the stage of glaucoma from pre-diagnosis to end-stage disease. Am J Ophthalmol. 2006;141(1):24–30. doi:10.1016/j.ajo.2005.07.044
- Medeiros FA, Zangwill LM, Bowd C, Weinreb RN. Comparison of the GDx VCC scanning laser polarimeter, hrt ii confocal scanning laser ophthalmoscope, and stratus oct optical Coherence tomograph for the detection of glaucoma. Arch Ophthalmol. 2004;122(6):827–837. doi:10.1001/archopht.122.6.827
- Blumberg DM, De Moraes CG, Liebmann JM, et al. Technology and the glaucoma suspect. Invest Ophthalmol Vis Sci. 2016;57(9):80–85. doi:10.1167/iovs.15-18931
- Bowd C, Zangwill LM, Berry CC, et al. Detecting early glaucoma by assessment of retinal nerve fiber layer thickness and visual function. Invest Ophthalmol Vis Sci. 2001;42(9):1993–2003.
- Kim KE, Oh S, Jeoung JW, et al. Spectral-domain optical coherence tomography in manifest glaucoma: its additive role in structural diagnosis. Am J Ophthalmol. 2016;171:18–26. doi:10.1016/j.ajo.2016.08.017
- Meneses LSD, Ciarlini LR, Ayub G, Vasconcellos JPC, Costa VP. Discrimination between healthy eyes and those with mild glaucoma damage using hemoglobin measurements of the optic nerve head. J Glaucoma. 2022;31(7):567–573. doi:10.1097/IJG.0000000000002026
- Pena-Betancor C, Gonzalez-Hernandez M, Fumero-Batista F, et al. Estimation of the relative amount of hemoglobin in the cup and neuroretinal rim using stereoscopic color fundus images. Invest Ophthalmol Vis Sci. 2015;56(3):1562–1568. doi:10.1167/iovs.14-15592
- Pasquale LR. Vascular and autonomic dysregulation in primary open-angle glaucoma. Curr Opin Ophthalmol. 2016;27(2):94–101. doi:10.1097/ICU.0000000000000245
- Nicolela MT. Clinical clues of vascular dysregulation and its association with glaucoma. Can J Ophthalmol. 2008;43(3):337–341. doi:10.3129/i08-063
- Rao HL, Pradhan ZS, Suh MH, Moghimi S, Mansouri K, Weinreb RN. Optical coherence tomography angiography in glaucoma. J Glaucoma. 2020;29(4):312–321. doi:10.1097/IJG.0000000000001463
- Bojikian KD, Chen PP, Wen JC. Optical coherence tomography angiography in glaucoma. Curr Opin Ophthalmol. 2020;30(2):110–116. doi:10.1097/ICU.0000000000000554
- Prata TS, Dorairaj S, Trancoso L, et al. Eyes with large disc cupping and normal intraocular pressure: using optical coherence tomography to discriminate those with and without glaucoma. Med Hypothesis, Discov Innov Ophthalmol J. 2014;3(3):91–98.
- Zangwill LM, Jain S, Racette L, et al. The effect of disc size and severity of disease on the diagnostic accuracy of the Heidelberg retina tomograph glaucoma probability score. Invest Ophthalmol Vis Sci. 2007;48(6):2653–2660. doi:10.1167/iovs.06-1314
- Hoesl LM, Mardin CY, Horn FK, Juenemann AGM, Laemmer R. Influence of glaucomatous damage and optic disc size on glaucoma detection by scanning laser tomography. J Glaucoma. 2009;18(5):385–389. doi:10.1097/IJG.0b013e3181845ffd
- Rao HL, Leite MT, Weinreb RN, et al. Effect of disease severity and optic disc size on diagnostic accuracy of rtvue spectral domain optical coherence tomograph in glaucoma. Invest Ophthalmol Vis Sci. 2011;52(3):1290–1296. doi:10.1167/iovs.10-5546
- Lima VC, Castro DP, Castro LC, et al. Influence of optic disc size on the diagnostic performance of macular ganglion cell complex and peripapillary retinal nerve fiber layer analyses in glaucoma. Clin Ophthalmol. 2011;5:1333–1337. doi:10.2147/OPTH.S20893