
Abstract
Purpose
Any new intraocular lens (IOL) on the market claims to outperform competitors. We aimed to estimate the modulation transfer function (MTF) for different defocus of a novel refractive enhanced depth of focus (EDoF) IOL and the simulated visual acuity over this range of vision. Further, we analyzed the wavefront pattern produced by this IOL to reveal the function of the IOL’s optics.
Methods
For the novel TECNIS® PureSee® (ZEN00V) IOL, through frequency and through focus MTF were recorded on the optical bench (ISO-2 Cornea 0.28 µm, 546 nm). MTFa and the simulated visual acuity were calculated for different defocus. Apertures of 3 mm and 4.5 mm were applied. Higher order aberrations of the IOLs’ optics were recorded and analyzed.
Results
PureSee® IOL demonstrated a considerable depth of focus of about 1.7 D at the spectacle plane and a continuous simulated visual acuity over this range of defocus. For the 4.5 mm aperture, near focus depth was reduced, yet far distance MTF was even better. Higher order aberrations revealed increased primary and secondary spherical aberrations.
Conclusion
Optical bench results suggest that the new ZEN00V matches the clinical criteria of an EDoF IOL by an increased range of vision and is far distance dominant for an enlarged pupil. This behaviour seems to be due to subtle power changes in the central optics that produce a complex modification of wavefront.
Introduction
In modern refractive cataract surgery, a patient‘s request for spectacle independence after surgery is usually addressed by implanting multifocal intraocular lenses (IOLs) with different extent of multifocality. This will enable the patient to benefit from a good visual acuity from far to near distance, but will always produce photic phenomena such as halos and glare to some extent.Citation1
Enhanced depth of focus (EDoF) IOLs were introduced to the market in 2016 to cope with partly extensive dysphotopsia encountered with classical multifocal IOLs.Citation2–4 However, the range of vision of an EDoF IOL will usually cover far to intermediate distance only.
To define the term of “Enhanced Depth of Focus”, the American Academy of Ophthalmology Task Force had published a consensus statement in 2017.Citation5 For specific, standardized evaluation in studies, EDoF IOLs and control groups have to include at least 100 subjects with comparable monocular best corrected distance visual acuity. The monocular depth of focus of the EDoF group has to be 0.5 D greater than the depth of focus for the monofocal group at logMAR 0.2. The mean monocular distance corrected intermediate visual acuity of the EDoF group in photopic conditions at a distance of 66 cm, 6 months after surgery, has to be superior than that of the monofocal group. And 50% of the eyes in the EDoF group have to show a distance corrected intermediate visual acuity with ETDRS (Early Treatment Diabetic Retinopathy Study) charts of at least logMAR 0.2 at a distance of 66 cm.
Today, there are diffractive and refractive EDoF IOLs available. Halos and glare typically are more prevailing in diffractive optics. In addition to refractive EDoF IOLs with differently arranged symmetrical or asymmetrical near segments, a new class of wavefront modifying refractive IOLs was introduced very recently.Citation6,Citation7 Each of these IOLs aims to outperform the competitors considering range of vision, quality of vision and lack of dysphotopsia. The most recent wavefront modifying EDoF IOL is the TECNIS® PureSee® IOL, model ZEN00V, by Johnson&Johnson Vision, introduced in 2023, which we could evaluate on the optical bench due to limited availability. For this IOL, the manufacturer claims a pupil independency.
The aim of our analysis was to estimate the modulation transfer function (MTF) of this IOL for different defocus as an indicator for the range of vision provided by this optics. Further, to analyze the wavefront pattern produced by this IOL to reveal the function of this IOL’s optics. We aimed to bring these results in relation with the analysis of two other refractive, wavefront modifying EDoF IOLs, the LuxSmart IOL (Bausch & Lomb) and the AcrySof® IQ Vivity® (Alcon), assessed by our team with the same settings.Citation8 Whereas for these two IOLs, the optical function is disclosed,Citation9,Citation10 for the PureSee® IOL, the manufacturer only conveys some sophisticated power changes in the central optics without any further details.
Furthermore, we wanted to compare the MTF results with the diffractive EDoF IOL of the same platform, the TECNIS® Symfony® IOL, also assessed with the same settings.Citation11
Finally, we aimed to address the calculated simulated visual acuity over the defocus range with regard to clinical context.
Our results will provide the clinician with important and valuable insights in the optical function of these IOLs to better decide which specific IOL to choose for an individual patient.
Materials and Methods
We evaluated a TECNIS® PureSee® IOL, model ZEN00V, with a nominal power of 22 diopters. This IOL has a 6 mm optics, is made of hydrophobic acrylic with a proprietary violet light filter and a refractive index of 1.47 (35 °C). The complex aspheric design to extend the range of vision is applied to the posterior surface and is not macroscopic evident. Frosted haptics should prevent rotation in the capsular bag and a sharp posterior edge is applied to prevent early capsular opacification.
Measurements
Measurements were done by one experienced specialist at TRIOPTICS GmbH, Wedel, Germany, according to our instructions ensuring an independent and non-biased investigation.
For the MTF, the OptiSpheric® IOL PRO 2 imaging test benchCitation12 was used that comes with a direct imaging setup. Power measurements can be done with an accuracy of 0.3%.
The setting corresponded to the European ISO 11979 standard. We obtained certificates of each measurement.
An in situ eye model with NaCl (n = 1.337) and a temperature of 35 °C was used to simulate a human eye. Measurements were done with green light (546 nm) to be comparable to most studies in literature. An ISO-2 glass cornea was used to sufficiently match most clinical situations. The ISO-2 cornea had a spherical aberration of +0.28 µm for an aperture of 5.15 mm +/+ 0.1 mm. Apertures of 3 mm (ISO-standard) and 4.5 mm in the IOL plane were applied to simulate a photopic and a mesopic pupil of an elder patient. For both sizes of aperture, the through frequency modulation transfer function, derived from a crosshair target in sagittal and tangential meridians, was measured at different levels of defocus (defocus curve as an assessment of defocus tolerance of the IOL). We averaged the sagittal and tangential values of the modulation transfer function because for rotational symmetric IOLs, both values are nearly identical. Each value displayed consisted of 5 single measurements, and the mean was thus calculated out of 10 single measurements. MTF is measured with an accuracy of ±2%. For each curve, the area under the MTF curve (MTFa) was generated by calculating the integral between 0 and 50 lp/mm. The MTFa was then displayed against defocus to obtain an optical bench defocus curve. Based on MTFa, simulated visual acuity (VA) was calculated by the formula , with a = 5.17 and c = −0.25.Citation13
A through focus scan was performed at 50 lp/mm for both apertures to evaluate pupil dependency of the IOL optics.
Spatial frequency is displayed in linepairs per millimeter (lp/mm). In ISO 11979–2:2014, the nodal point is defined by 17 mm. Therefore, spatial frequency can be calculated in cycles/degree by 0.297*lp/mm, at least for an average eye.
To evaluate the higher order aberrations produced by the IOL, measurements were performed with the WaveMaster® IOL 2 device test bench,Citation14 a high resolution Shack-Hartmann sensor in reverse projection setup with a dynamic range up to 2000 lambda (λ), an accuracy of λ/20 (RMS), a lateral resolution of 138 × 138 microlenses and a reproducibility of λ/200 (RMS) ().
Figure 1 WaveMaster® IOL 2 test setup.
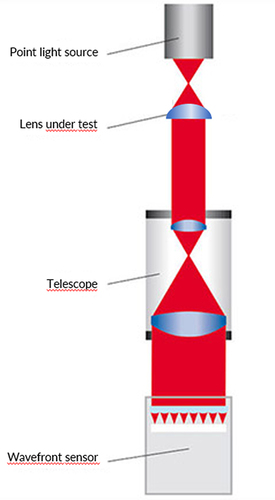
This device complies to international standards. Measurements were done with a wavelength of 546 nm (ISO) in NaCl (n = 1.337) to best match with aqueous and at room temperature with an in-situ model eye according to ISO 11979. Diameter of the circular mask used was 4.51 mm (maximum), corresponding to standard settings and clinically to a mesopic pupil size. The sample IOL was illuminated by a point laser light source produced by a collimator. The image of the IOL aperture is projected to a wavefront sensor, a micro lens array placed in front of a CCD camera. Each focus spot position shift of the individual microlens of the wavefront sensor’s array is measured and the resulting wavefront profile map is calculated and displayed. Zernike polynomials up to 10th order could be determined. Fitting peak-to-valley (PV) and root mean square (RMS) will eliminate residual artifacts like material errors. However, in order to reveal fit errors, raw data were also obtained. Local fit deviations of the wavefront could indicate that we have to deal with a more complex optics. The same would apply for an atypical wavefront pattern.
A meridional power profile was deducted from the measured wavefront data in detail by a special mathematical procedure. The modelling was done by the software Ansys Zemax OpticStudio. The mean meridional wavefront was calculated from the measured wavefront (optical path deviation (OPD) = f(r)). From that data, a 3D wavefront was built (OPD = f(x, y)) and applied to an aberration neutral model IOL with a nominal power of 22 D, according to the sample IOL. The resulting radial power profile of the optics was then calculated for a parallel light incidence.
Results
Modulation Transfer Function
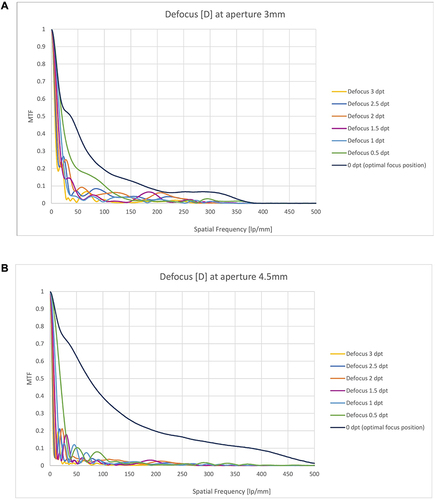
Far point through frequency MTF ( and ) demonstrated comparable curves for both apertures with even better MTF for larger apertures. MTF at 3 mm aperture was 0.410 at 50 lp/mm and 0.193 at 100 lp/mm, and even larger for the 4.5 mm aperture with 0.621 (50 lp/mm) and 0.393 (100 lp/mm). With defocus, through frequency MTF decreased, revealing a shallow bump at −1.5 to −2.5 D of defocus for the 3 mm aperture. For the 4.5 mm aperture, only minor defocus tolerance could be demonstrated.
Figure 2 (A and B) Through frequency MTF of PureSee® IOL. Through frequency MTF with different defocus, 3 mm aperture (A) and 4.5 aperture (B), with special interest for MTF between 0 and 100 lp/mm.
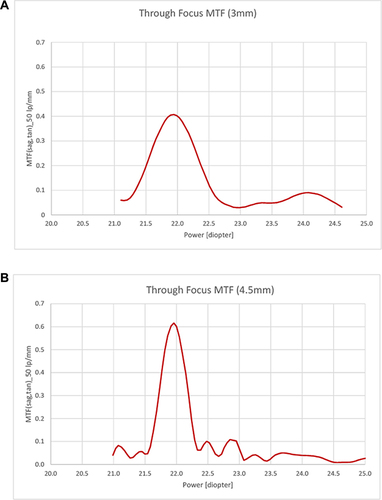
Through focus MTF at 50 lp/mm ( and ) revealed a peak at the secondary (near) focus with a depth of focus of 2.2 D for the 3 mm aperture. For the large aperture of 4.5 mm, no clear peak at near focus could be distinguished, though signals of about 0.1 were present at 22.9 D. MTF at the primary peak was even larger than for the 3 mm aperture.
Figure 3 (A and B) Through focus MTF of PureSee® IOL. Through focus MTF at 50 lp/mm for an aperture of 3 mm (A) and 4.5 mm (B).
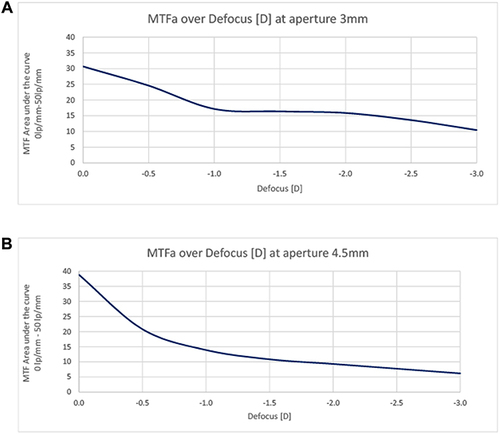
The area under the modulation transfer function curve (MTFa) of PureSee® for a defocus range from 0 D to −3 D and an aperture of 3 mm is shown in , and for the 4.5 mm aperture in .
Figure 4 (A and B) MTFa of PureSee® IOL. Area under the modulation transfer function curve (MTFa) at defocus 0 D to −3 D, for an aperture of 3 mm (A) and 4.5 mm (B).
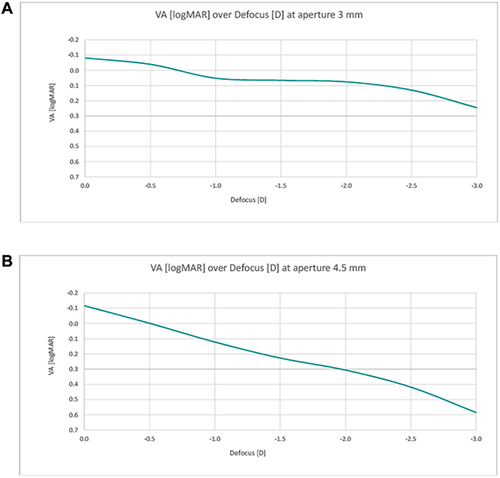
The corresponding simulated visual acuity for both apertures and at different defocus is presented in and . For the 3 mm aperture, a near continuous range of vision was detected with a simulated visual acuity better than 0.1 logMAR (Snellen 0.8) until a defocus of −2.25 D, and better than 0.2 logMAR (Snellen 0.63) even until defocus of −2.75 D. For the 4.5 mm aperture, simulated visual acuity decreased nearly linearly with defocus and fell below 0.2 logMAR with defocus of about −1.3 D already.
Figure 5 (A and B) Simulated visual acuity. Simulated visual acuity for 3 mm aperture (A) and 4.5 aperture (B) at defocus 0 D to −3 D.
Higher Order Aberrations
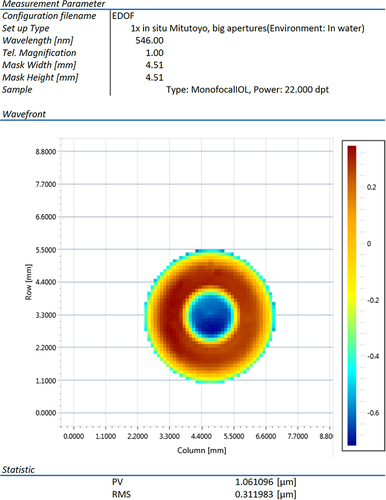
The wavefront map of PureSee® is displayed in . The higher order aberrations obtained () reveal that the only significant Zernike polynomials are an increased spherical aberration (Z 4–0) of −0.66 µm and a secondary spherical aberration (Z 6–0) of 0.20 µm. Peak-to-valley (PV) was 1.06 µm, whereas the fitted PV was 1.25 µm. Measured and fitted RMS was 0.31 µm.
Table 1 Higher Order Aberrations (Zernike Polynomials) Obtained for TECNIS® PureSee® IOL. Significant Zernike Coefficients are Found to Be Primary and Secondary Spherical Aberration (>0.2 µm)
Figure 6 2D Wavefront mapping (Shack-Hartmann) of TECNIS® PureSee® IOL.
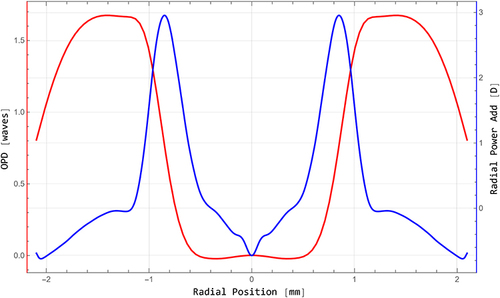
The wavefront profile was analyzed further in detail by a special mathematical procedure (). The meridional profile (red) shows some flattening in the centre and at the paracentral peaks. The blue curve reflects the radial power profile of the PureSee® optics deducted from the measured wavefront data. The nominal power would be found in the very centre, surrounded by a steeply sloping annular zone of about 3 D power.
Figure 7 Detailed, meridionally averaged wavefront (red) and calculated power (blue) profile of PureSee® IOL (Shack-Hartmann Sensor). The central dip represents an artifact caused by wavefront reconstruction.
Discussion
The wavefront pattern we could obtain from PureSee® IOL shows an increase in negative spherical aberration (SA) Z 4–0 combined with an increase in positive secondary spherical aberration Z 6–0 which will increase the depth of focus of an optics, in agreement with the literature.Citation10,Citation15 This represents the result of an assessment by a state-of-the-art Shack-Hartmann wavefront sensor. This device could not provide any detailed localized discrepancies between raw data and fitted data and cannot detect detailed localized optical steps. By comparing raw data and fitted data, there were no hints of artifacts like IOL surface impurity, material errors, malpositioning in the IOL tray or other inaccuracy of the measurement. The specially extracted, meridionally averaged wavefront profile is in accordance with an addition of increased primary and secondary SA with opposite sign. The subtle flattening of the curve in the centre and at the paracentral peaks could be due to an additional interaction of some optical effects not detectable by standard modal wavefront measurements. A recent reportCitation16 argues that a modal wavefront map would not sufficiently reflect and completely describe the optical function of some IOLs that might be designed with subtle, local zonal power steps within the central zone of the IOL. A localized central increase in power obviously is the key to produce the depth of focus. Our radial power curve showing a central annular zone of about a 3 D power increase results from mathematical modelling based on the measured wavefront data. Zonal and modal wavefront measurements may slightly differ. A direct measurement of the radial power distribution of the IOL could give somewhat more precise and slightly different values. In any case, with the measuring tools available today, increased spherical aberration and thus depth of focus of the PureSee® optics is evident.
All the measurements done refer to the IOL plane which means a factor of about 0.75 for the spectacle plane. We could confirm a considerable depth of focus of 2.2 D in the IOL plane (which means about 1.7 D in the spectacle plane) by means of through focus MTF measurements for a smaller aperture. This is expected to meet the clinical criteria of an EDoF IOL by the American Academy of Ophthalmology Task Force consensus.Citation5 The defocus curve of the MTFa, the most distinct optical bench criteria for the defocus tolerance of an IOL, and the calculated simulated visual acuity of PureSee® IOL for the smaller aperture of 3 mm also met the depth of focus criteria required for a so-called EDoF IOL. Calculated visual acuity was roughly similar to other refractive EDoF IOLs on the market.Citation7 For a larger aperture of 4.5 mm, only a reduced near focus depth could be detected. Our results thus could not confirm the pupil independency claimed by the manufacturer for this IOL. For a larger aperture, light distribution obviously favours far distance while defocus significantly decreases. This, however, fits with the demands of most tasks in daily life because this optics' design will enable a good mesopic distance visual acuity and probably reduce photic phenomena. An improved reading capability will be expected given pupillary near reaction. Reading in mesopic conditions, however, might be difficult. Compared with LuxSmart® IOL under the same settings,Citation8 distance vision of PureSee® IOL is favoured against intermediate vision as is the case for Vivity® IOL which roughly shows the same pattern of light distribution as PureSee® IOL but is tailored somewhat more towards intermediate vision even for larger pupils. Both these competitor IOLs showed slightly lower MTF values at their primary focus. We measured higher MTF values at their near focus than for PureSee® IOL but less range of power between the primary and the secondary peak at far and near focus (1.7 D and 1.32 D, respectively, 3 mm aperture). LuxSmart® showed a higher peak at its secondary focus compared to the primary focus for the 3 mm aperture, and equal peaks for the 4.5 mm aperture. For this comparison, our setting with the ISO-2 cornea (0.28 µm) was in favour of the TECNIS® IOL with an aberration correcting platform of −0.27 µm, compared with an aberration correction of −0.2 for Alcon Vivity® and an aberration neutral platform for LuxSmart®. It has to be considered that the corneal spherical aberration in the population is largerly dependent of pupil size and the mean corneal spherical aberration of +0.27 µm reported in literatureCitation17,Citation18 is valid for a 6 mm pupil only.
The diffractive TECNIS® Symfony® IOL, with the same TECNIS® platform as the PureSee® IOL, demonstrates a similar through frequency MTF at the far distance and a clear peak at intermediate focus for both aperture sizes on the optical bench.Citation2,Citation11,Citation19 This bifocal behaviour of Symfony® IOL is different from the continuous defocus capability reported by patients and by clinical studies.Citation20,Citation21 Also PureSee® IOL may behave differently in clinical assessments that are mandatory henceforward. First clinical reports have been published recently.Citation22,Citation23 The authors stated that the PureSee® IOL demonstrated high quality distance vision and dysphotopsia and contrast sensitivity comparable to a monofocal IOL, even in the presence of refractive error.
Optical bench measurements generally cannot simply be transferred to clinical settings. Any measurement of IOL wavefront aberrations on an optical bench is done with a central laser light beam. Wavefront results will depend on the light wavelength used and especially on the aperture. Additionally, there is an impact of the acrylic material’s dispersion and IOL thickness on the wavefront. MTF measurements have similar limits with the selected cornea, wavelength and aperture as the main factor. The green light used does not reflect the situation in clinical studies. Though polychromatic light would always produce some chromatic aberrations interfering with the results obtained. Therefore, optical bench measurements are a valuable and very important supplement of clinical investigations that largely lack standardized settings due to different individual corneal aberrations of the study population, total aberrations, pupil sizes, light conditions and other settings.
Conclusion
Our optical bench assessment of the novel PureSee® (ZEN00V) IOL confirms a convincing depth of focus for a smaller pupil and a reduced depth of focus for a large pupil. Compared to other refractive, wavefront modifying EDoF IOLs on the market, a robust visual acuity for far distance, independent of pupil size, seems to be the main feature of this IOL.
Author Contributions
All authors (RS, AFB) made a significant contribution to the work reported, whether that is in the conception, study design, execution, acquisition of data, analysis and interpretation; took part in drafting, revising or critically reviewing the article; gave final approval of the version to be published; have agreed on the journal to which the article has been submitted; and agree to be accountable for all aspects of the work.
Disclosure
All authors report no conflicts of interest in this work.
Acknowledgments
We would like to thank the company Trioptics (Wedel, Germany) which carried out all measurements according to highest scientific standards and ISO guidelines and provided us with official certificates for all measurements (Nov. 2023).
Data Sharing Statement
All data analyzed in this study are included in this article. Further inquiries can be directed to the corresponding author.
Additional information
Funding
References
- De Silva SR, Evans JR, Kirthi V, Ziaei M, Leyland M. Multifocal versus monofocal intraocular lenses after cataract extraction. Cochrane Database Syst Rev. 2016;12(12):CD003169. doi:10.1002/14651858.CD003169.pub4
- Weeber HA, Meijer ST, Piers PA. Extending the range of vision using diffractive intraocular lens technology. J Cataract Refract Surg. 2015;41(12):2746–2754. doi:10.1016/j.jcrs.2015.07.034
- Cochener B; Concerto Study Group. Clinical outcomes of a new extended range of vision intraocular lens: international multicenter concerto study. J Cataract Refract Surg. 2016;42(9):1268–1275. doi:10.1016/j.jcrs.2016.06.033
- Takabatake R, Takahashi M, Yoshimoto T, et al. Cases of replacing diffractive bifocal intraocular lens with extended depth of focus intraocular lens due to waxy vision. PLoS One. 2021;16(10):e0259470. PMID: 34714884; PMCID: PMC8555820. doi:10.1371/journal.pone.0259470
- MacRae S, Holladay JT, Glasser A, et al. Special report: American Academy of ophthalmology task force consensus statement for extended depth of focus intraocular lenses. Ophthalmology. 2017;124(1):139–141. doi:10.1016/j.ophtha.2016.09.039
- Schmid R, Borkenstein AF. Analysis of higher order aberrations in recently developed wavefront-shaped IOLs. Graefes Arch Clin Exp Ophthalmol. 2022;260(2):609–620. PMID: 34370067. doi:10.1007/s00417-021-05362-2
- Baur ID, Yan W, Auffarth GU, Khoramnia R, Łabuz G. Optical quality and higher order aberrations of refractive extended depth of focus intraocular lenses. J Refract Surg. 2023;39(10):668–674. PMID: 37824300. doi:10.3928/1081597X-20230831-01
- Schmid R, Fuchs C, Luedtke H, Borkenstein AF. Depth of focus of four novel extended range of vision intraocular lenses. Europ J Ophthalmol. 2022;13:11206721221125081. PMID: 36112834. doi:10.1177/11206721221125081
- Food and Drug Administration. Summary of safety and effectiveness data. AcrySofTM IQ VivityTM extended vision intraocular lens. PMA P930014/S126; 2020. Available from: https://www.accessdata.fda.gov/cdrh_docs/pdf/P930014S126B.pdf. Accessed Oct 02, 2021.
- Benard Y, Lopez-Gil N, Legras R. Optimizing the subjective depth-of-focus with combinations of fourth- and sixth-order spherical aberration. Vision Res. 2011;51(23–24):2471–2477. doi:10.1016/j.visres.2011.10.003
- Schmid R, Luedtke H, Borkenstein AF. Enhanced depth-of-focus intraocular lenses: latest wavefront-shaped optics versus diffractive optics. Optom Vis Sci. 2022;99(4):335–341. doi:10.1097/OPX.0000000000001894
- Trioptics GmbH. Available from: https://trioptics.com/products/optispheric-focal-length-and-radius-measurement/. Accessed Nov 18, 2023.
- Vega F, Millán MS, Garzón N, Altemir I, Poyales F, Larrosa JM. Visual acuity of pseudophakic patients predicted from in-vitro measurements of intraocular lenses with different design. Biomed Opt Express. 2018;9(10):4893–4906. PMID: 30319910. doi:10.1364/BOE.9.004893
- Trioptics GmbH. Available from: https://trioptics.com.sg/wavemaster-iol-2/. Assessed Nov 18, 2023.
- Yi F, Iskander DR, Collins M. Depth of focus and visual acuity with primary and secondary spherical aberration. Vision Res. 2011;51(14):1648–1658. doi:10.1016/j.visres.2011.05.006
- Yoon G, Bang S, Jung HW, Kim MJ, Jun JH, Pantanelli S. Comparison of modal and zonal wavefront measurements of refractive extended depth of focus intraocular lenses. Biomed Opt Express. 2024;15(3):1618–1629. PMID: 38495697. doi:10.1364/BOE.513529
- Holladay JT, Piers PA, Koranyi G, van der Mooren M, Norrby NE. A new intraocular lens design to reduce spherical aberration of pseudophakic eyes. J Refract Surg. 2002;18(6):683–691. PMID: 12458861. doi:10.3928/1081-597X-20021101-04
- Tabernero J, Piers P, Benito A, Redondo M, Artal P. Predicting the optical performance of eyes implanted with IOLs to correct spherical aberration. Invest Ophthalmol Vis Sci. 2006;47(10):4651–4658. doi:10.1167/iovs.06-0444
- Son HS, Labuz G, Khoramnia R, Merz P, Yildirim TM, Auffarth GU. Ray propagation imaging and optical quality evaluation of different intraocular lens models. PLoS One. 2020;15(2):e0228342. doi:10.1371/journal.pone.0228342
- Ang RE, Picache GCS, Rivera MCR, Lopez LRL, Cruz EM. A comparative evaluation of visual, refractive, and patient-reported outcomes of three extended depth of focus (EDOF) intraocular lenses. Clin Ophthalmol. 2020;14:2339–2351. PMID: 32921975. doi:10.2147/OPTH.S255285
- Reinhard T, Maier P, Böhringer D, et al. Comparison of two extended depth of focus intraocular lenses with a monofocal lens: a multi-centre randomised trial. Graefes Arch Clin Exp Ophthalmol. 2021;259(2):431–442. PMID: 32915276. doi:10.1007/s00417-020-04868-5
- Black DA, Bala C, Alarcon A, Vilupuru S. Tolerance to refractive error with a new extended depth of focus intraocular lens. Eye. 2024;38(Suppl 1):15–20. PMID: 38580742. doi:10.1038/s41433-024-03040-1
- Corbett D, Black D, Roberts TV, et al. Quality of vision clinical outcomes for a new fully-refractive extended depth of focus Intraocular Lens. Eye. 2024;38(Suppl 1):9–14. PMID: 38580741. doi:10.1038/s41433-024-03039-8