Abstract
Background
The purpose of this paper is to report the 3-month findings of the Prospective Retinal and Optic Nerve Vitrectomy Evaluation (PROVE) study.
Methods
Eighty eyes of 40 participants undergoing vitrectomy were enrolled. Participants underwent baseline evaluation of the study (surgical) and fellow (control) eye that included: intraocular pressure, central corneal thickness, gonioscopy, cup-to-disc ratio measurement, color fundus and optic disc photography, automated perimetry, and optical coherence tomography of the macula and optic nerve. Evaluation was repeated at 3 months. Main outcome measures were changes in macula and retinal nerve fiber layer (RNFL) thickness and intraocular pressure.
Results
All participants completed follow-up. Mean cup-to-disc ratio of study and fellow eyes at baseline was 0.43 ± 0.2 and 0.46 ± 0.2, respectively, and 13% of participants had undiagnosed narrow angles. There was no significant change in intraocular pressure, cup-to-disc ratio, or pattern standard deviation in study eyes compared with baseline or fellow eyes at 3 months. Vision improved in all study eyes at 3 months compared with baseline (P = 0.013), but remained significantly worse than fellow eyes (P < 0.001). Central subfield and temporal peripapillary RNFL thickness were significantly greater in eyes with epiretinal membrane (P < 0.05), and resolution after surgery correlated with visual improvement (P < 0.05).
Conclusion
The 3-month results do not indicate any increased risk for open-angle glaucoma but suggest that a relatively high percentage of eyes may be at risk of angle closure glaucoma. Temporal RNFL thickness and central subfield were increased in eyes with epiretinal membrane, and resolution correlated with degree of visual recovery.
Introduction
Since the introduction of vitrectomy in 1971 by Machemer et al,Citation1 this procedure has become the third most frequently performed ophthalmic surgery after cataract and excimer laser refractive surgery. Approximately 225,000 vitrectomies are performed annually in the United States and indications continue to expand. Known long-term complications are relatively few, and include cataract formation, retinal tear, retinal detachment, and proliferative vitreoretinopathy.Citation2–Citation5 However, as with any relatively new technology, continued monitoring is necessary to detect less frequent and longer-term complications.
To our knowledge, there are no well-designed, prospective, controlled studies evaluating long-term anatomic and functional changes after vitrectomy surgery. Several recent retrospective studies have analyzed the association of open-angle glaucoma with vitrectomy.Citation6–Citation9 Other reported complications include visual field defects and retinal photo and chemical toxicity (indocyanine green).Citation10,Citation11 There is also debate regarding whether vitrectomy and/or induction of a posterior vitreous detachment accelerates or delays progression of age-related macular degeneration,Citation12 diabetic retinopathy,Citation13 and other retinal disorders. Equally important, recent advances in noninvasive imaging such as spectral-domain optical coherence tomography (SD-OCT)Citation14 and fundus autofluorescence,Citation15 may now allow greater detection and characterization of subtle macular and nerve fiber layer alterations.
The Prospective Retinal and Optic Nerve Vitrectomy Evaluation (PROVE) study is a prospective, controlled, 5-year longitudinal investigation designed to determine anatomic and functional alterations after vitrectomy surgery in a consecutive cohort of patients undergoing elective surgery at the Vanderbilt Eye Institute. The intent of the study is to address more rigorously several important questions regarding long-term consequences of vitrectomy surgery for common vitreoretinal disorders (epiretinal membrane, macular hole, vitreous opacities). Herein, we report the 3-month observations of our study cohort.
Materials and methods
The PROVE study was approved by the Vanderbilt University institutional review board, complied with the Health Insurance Portability and Accountability Act, and was performed in accordance with the ethical standards laid down in the 1964 Declaration of Helsinki. All subjects gave informed consent before enrollment. Consecutive enrollment took place at the Vanderbilt Eye Institute between April 2010 and February 2012. The study is registered at clinicaltrials.gov (identifier NCT01162356).
Eighty eyes of 40 patients undergoing unilateral vitrectomy surgery were enrolled. Inclusion criteria included ≥18 years of age, planned vitrectomy for visually significant unilateral epiretinal membrane, macular hole, or vitreous opacities due to syneresis and/or complete posterior detachment, and the ability to comply with testing and long-term follow-up. Exclusion criteria included any media opacity that would interfere with imaging, history of glaucoma, uveitis, trauma, use of aqueous suppressants for ocular hypertension, history of advanced retinal disease (exudative age-related macular degeneration, diabetic macular edema) that would interfere with retinal thickness measurements, and history of previous vitrectomy in either eye or postoperative complications requiring repeat vitrectomy surgery within 3 months. Patients with disease in the fellow control eye that, in the opinion of the investigator, was likely to warrant future vitrectomy surgery were also excluded.
The primary objective of the PROVE study was to determine the incidence of and associated risk factors for retinal nerve fiber layer (RNFL) and macular changes after vitrectomy surgery. Secondary objectives included: characterization of long-term functional consequences of RNFL and macular changes with regard to central and peripheral visual field defects and determination of the incidence of open angle glaucoma or increased intraocular pressure.
Patient characteristics, including age, gender, medication use, and lens status, were recorded. All patients underwent comprehensive baseline testing of both their study (surgical) and fellow (control) eye within 4 weeks before their surgery. Testing consisted of a complete ocular examination by a fellowship-trained vitreoretinal surgeon (SJK, EFC, FMR, AA, JCL), glaucoma evaluation by a fellowship-trained glaucoma specialist (JAK, RWK, KMJ), fundus and optic nerve photography, fundus autofluorescence, visual field testing, and macula and optic nerve SD-OCT.
Glaucoma evaluation
The baseline glaucoma evaluation was performed in a masked fashion with the glaucoma specialist having no knowledge of the patient’s history, indication for surgery, or which eye was to be operated on. The glaucoma evaluation included best-corrected visual acuity (BCVA), three intraocular pressure (IOP) measurements by two independent methods (Goldmann applanation and Tono-Pen®, Reichert, Depew, NY, USA), gonioscopy, central corneal thickness measurement by pachymetry (DGH Technology Inc, Exton, PA, USA), and clinical assessment of cup-to-disc ratio. BCVA was measured using Snellen charts. All information was recorded on a data sheet with the time of day and archived separately from the patient’s medical record. Follow-up evaluations were performed by the same glaucoma specialist who was masked to previous test results and every effort was made to ensure that follow-up evaluations were performed at the same time of day. All patients were evaluated initially by a glaucoma specialist before dilation and visual field testing. All remaining testing and grading of cup-to-disc ratio was performed after pharmacologic dilation with 2.5% phenylephrine and 1% tropicamide.
Photography
Color optic nerve (30 degrees) and fundus photographs of the macula (50 degrees) were taken of the study and fellow eye by experienced photographers (Zeiss 450+ fundus camera, Carl Zeiss Meditec, Dublin CA, USA, and OIS WinStation version 10.3, Ophthalmic Imaging Systems, Sacramento, CA, USA).
Autofluorescence
Fundus autofluorescence imaging of the macula with an excitation filter of 580 nm (bandwidth 500–610 nm) and barrier filter of 695 nm (bandwidth 675–715 nm) was also performed. Quality control was performed at the time of imaging.
Visual fields
Visual fields were assessed before dilation utilizing the 24–2 static white-on-white Swedish Interactive Thresholding Algorithm test program (SITA Fast; Humphrey visual analyzer, Carl Zeiss Meditec). A field test was defined as reliable when the summation of fixation losses, and false-positive and false-negative rates was less than 33%. Visual field parameters including mean deviation, pattern standard deviation, and glaucoma hemifield test results were recorded.
Optical coherence tomography
SD-OCT images of both eyes were generated with the Cirrus OCT (Carl Zeiss Meditec) in accordance with the manufacturer’s instructions and are described in detail elsewhere.Citation16 In brief, the retinal map algorithm produced a circular plot in which the central subfield formed the center, with a diameter of 1 mm. Two concentric zones were mapped: inner, with a width of 2 mm; and outer, with a width of 3 mm. For the purposes of this study, the central subfield (CSF) and the four quadrants of the inner concentric zone (superior, nasal, inferior, temporal) were analyzed. Total macular volume was measured in millimeters cubed. The numeric values for these parameters were obtained directly from the retinal map algorithm. Scans were evaluated for decentration and artifacts. Macular change analysis was available to determine the amount of change between baseline and subsequent study visits.
An optic disc cube scan protocol was used to measure RNFL thickness in a 6 × 6 mm2 area, consisting of 200 × 200 axial scans (pixels) at the optic disc region. The center of the optic nerve was automatically detected and a circle (3.46 mm diameter) centered over this point was utilized to obtain standardized measurements. Two hundred and fifty-six A scans were performed along this circle and the RNFL thickness at each pixel was measured and a thickness map was generated. Scan quality scores ≥7 were acceptable. Average and four quadrant measurements of the peripapillary RNFL were used in the statistical analysis. The cup volume was measured in millimeters cubed.
Surgery
All vitrectomy surgeries were performed using a 23-gauge or 25-gauge three-port pars plana approach and video-recorded. Intraoperative use of indocyanine green, gauge of vitrectomy instrumentation, intraocular tamponade (air, perfluoropropane, hexafluoride), and all other intraoperative procedures were at the discretion of the primary surgeon.
Follow-up testing
All testing as described above () was completed for all 40 participants at 3 months after surgery. All additional testing, care, or consultation was at the discretion of the treating retina specialist or any other eye care provider that the patient was regularly seeing.
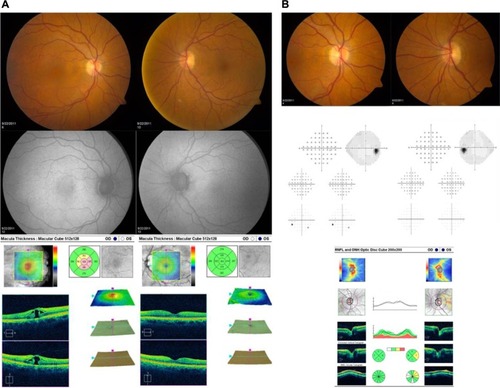
Figure 1 Representative images and test results for a patient with macular hole in the right eye and normal left eye are shown. (A) Optic nerve photographs, automated visual field test results, and SD-OCT of the optic nerve. (B) Fundus photographs, fundus autofluorescence, and SD-OCT of the macula
Sample size calculation
Assuming an approximately 15% and 5% rate of loss in mean RNFL thickness (with standard deviation of 15%) among study and fellow (control) eyes, respectively, over 2 years, one-sided inference of mean analysis resulted in a sample size requirement of 36 patients to allow for adequate power with an α set at 0.05 and a β set at 0.80. Anticipating a 10% loss to follow-up, the enrollment goal was set for 40 patients.
Statistical analysis
Descriptive statistics including mean and standard deviation were calculated for case characteristics. The cohort was analyzed as a whole and also stratified based on surgical indication and lens status. Statistical software was used to analyze the data and generate tables and figures (GraphPad Software, La Jolla, CA, USA, and Microsoft Excel Software, Microsoft, Redmond, WA, USA). Snellen visual acuity was converted to logarithm of the minimal angle of resolution (logMAR) for statistical analysis. Comparisons of continuous variables among subgroups were performed using the Student’s t-test and contingency testing was performed using Fisher’s Exact test. P-values < 0.05 were considered to be of statistical significance.
Results
A total of 45 patients were initially recruited but four patients ultimately declined to participate or were not eligible for inclusion, and one other was excluded after requiring repeat vitrectomy surgery for vitreous hemorrhage within 3 months. Consequently, 80 eyes of 40 patients were enrolled and all 40 participants completed 3-month follow-up. The mean cohort age at baseline was 67 ± 6 years. Surgical indications included 21 epiretinal membranes, 14 macular holes, and five vitreous opacities. Baseline and 3-month ocular characteristics of the study eye and fellow control eye are shown in . Visual acuity significantly improved in all study eyes at 3 months compared with baseline (P = 0.013), but remained significantly worse than fellow eyes (P < 0.001). There were no observed changes from baseline or differences between study and fellow eyes with respect to IOP, central corneal thickness, or cup-to-disc ratio. Five patients were diagnosed with either bilateral narrow or occludable angles on baseline glaucoma screening, necessitating preoperative laser peripheral iridectomy in one patient. No acute rises in IOP (>30 mmHg) were observed postoperatively in any of these eyes.
Table 1 Mean results at baseline and at 3 months
Baseline macular SD-OCT results are summarized in and are grouped by surgical indication. All mean baseline macular thickness measurements (central, superior, nasal, inferior, and temporal) were significantly greater in study eyes compared with fellow control eyes among epiretinal membranes and macular holes. Macular volume measurements were also significantly higher in study eyes compared with fellow control eyes among epiretinal membrane eyes. At 3 months, CSF decreased on average 80 μm in study eyes (P < 0.001), but still remained significantly thicker in eyes with epiretinal membrane when compared with their respective fellow control eyes (P < 0.001, ). Improvement in visual acuity in eyes with epiretinal membrane significantly correlated with decreased CSF (r = 0.69, P = 0.003), but not changes in macular volume or integrity of the external limiting membrane, inner segment/outer segment (IS/OS) junction, or cone outer segment line ().
Figure 2 Mean central subfield thickness (CSF) in eyes with epiretinal membrane at baseline and 3 months after surgery
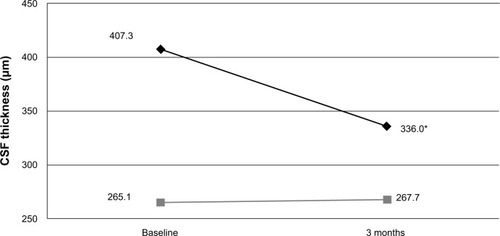
Figure 3 Scatter plot showing the change in central subfield thickness in eyes with epiretinal membrane from baseline on the y-axis versus change in vision in logarithm of the minimum angle of resolution (logMAR) units from baseline on the x-axis (r = 0.69; P < 0.001). The diagonal line represents the best-fitted linear regression. Negative values for central subfield thickness and logMAR vision indicate reduction in thickness and improvement in vision from baseline, respectively
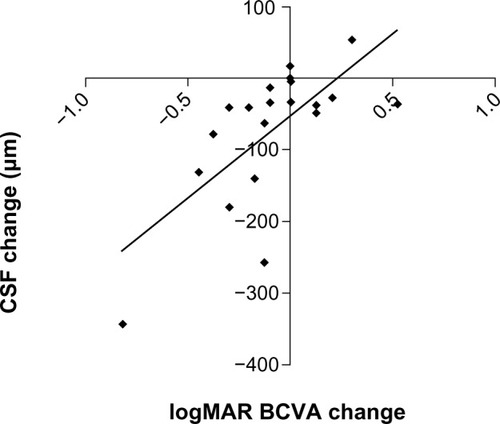
Table 2 Baseline macular SD-OCT characteristics
Among baseline RNFL thickness parameters (average, superior, nasal, inferior, temporal), mean temporal RNFL thickness was significantly greater in study eyes with epiretinal membrane (85 ± 22 μm) compared with their respective fellow control eyes (71 ± 14 μm, P < 0.05). At 3 months, average RNFL thickness decreased by approximately 3 μm overall in study eyes from baseline (P = 0.03, ), but temporal RNFL thickness decreased by almost 15 μm from baseline in eyes with epiretinal membrane (P = 0.04, ). Improvement in visual acuity in eyes with epiretinal membrane significantly correlated with decreased temporal RNFL thickness (r = 0.56, P = 0.007, ).
Figure 4 Scatter plot showing the change in T-RNFL thickness in eyes with epiretinal membrane from baseline on the y-axis versus change in vision in logMAR units from baseline on the x-axis (r = 0.56; P = 0.007). The diagonal line represents the best-fitted linear regression
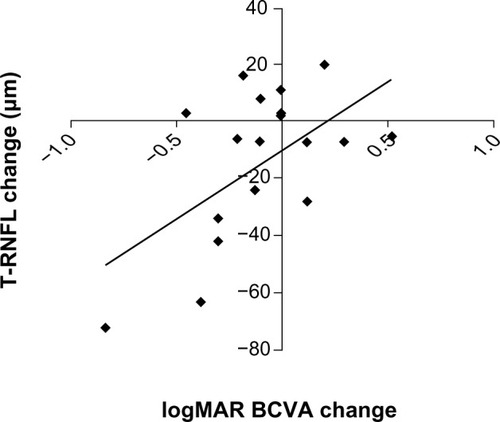
Table 3 Retinal nerve fiber layer thickness in eyes with epiretinal membrane at 3 months
Baseline mean deviation on Humphrey visual field was −2.75 ± 2.4 in study eyes and −1.0 ± 1.9 in fellow control eyes (P < 0.05) which significantly improved in the study eyes to −1.61 ± 2.2 at 3 months (P = 0.02). There were no observed changes from baseline or differences between study eyes and fellow eyes with respect to pattern standard deviation. Baseline Humphrey visual field tests were reliable in all but one study eye (3%) and three fellow control eyes (8%) and the baseline glaucoma hemifield test result was outside normal limits for seven (18%) study eyes and seven (18%) fellow control eyes. The glaucoma hemifield test changed in several eyes at 3 months (12 improved and 10 worsened), but similar changes were noted in fellow eyes that did not undergo surgery (13 improved and six worsened).
All surgeries were performed at a single location by one of five vitreoretinal surgeons assisted by fellows-in-training. Microincisional vitrectomy surgery was employed in all cases (23 with 25-gauge; 17 with 23-gauge). Intraoperative complications included three eyes (8%) with peripheral retinal tears treated with either endolaser or cryopexy. In addition, one optic nerve and one retinal contusion were documented in separate cases. Intraoperative staining with triamcinolone, indocyanine green, or both, was used in 13, nine, and 12 eyes, respectively. Air-fluid exchange (partial or total) was performed in 36 eyes (90%). Endotamponade agents (sulfur hexafluoride, perfluoropropane) were used in 10 and two eyes, respectively (two epiretinal membranes and 10 macular holes).
Discussion
The XLII Edward Jackson Memorial Lecture presented data supporting a causal relationship between vitrectomy surgery and open-angle glaucoma hypothesized to occur via oxidative stress exacerbated by removal of the crystalline lens.Citation6 Several subsequent studies have attempted to confirm this association, but all these retrospective studies lacked baseline evaluations to exclude pre-existing glaucoma and appropriate controls to account for natural history.Citation7–Citation9 The PROVE study was designed specifically to address the limitations of these prior studies.Citation17
Our cohort consisted of a consecutive sampling of adults evaluated by fellowship-trained vitreoretinal and glaucoma specialists and scheduled for elective surgery for common vitreoretinal conditions. While there were no significant differences at baseline between study and fellow eyes with respect to IOP, central corneal thickness, and cup-to-disc ratio, the overall mean cup-to-disc ratio (0.45) of both eyes was higher than anticipated given the predominance of Caucasian patients (93%) in our study and the absence of previously diagnosed ocular hypertension or glaucoma. In comparison, the mean cup-to-disc ratio was 0.36 for the predominantly Caucasian subgroup in the prospective Ocular Hypertension Study.Citation18 To our knowledge, we are the first to report on mean cup-to-disc ratio in patients undergoing vitrectomy and this observation may explain a predisposition towards diagnosing glaucoma in this cohort independent of surgery.
Due to the lack of previous published information, we were surprised that 13% (five of 40) of our study participants were diagnosed with either narrow or occludable angles on their initial glaucoma evaluation despite previous examinations by both retinal specialists and comprehensive ophthalmologists. Acute angle closure after vitreoretinal surgery is a serious and well-known complication that more commonly follows macular hole surgery,Citation19 which predisposes to angle closure because of posterior positive pressure (air or gas tamponade) in combination with prolonged prone positioning and cycloplegic dilation.Citation20 Our five patients, therefore, may have been at a substantially increased risk of unobserved episodic rises in postoperative IOP and subsequent RNFL damage. Our finding suggests that routine gonioscopy in patients undergoing macular hole surgery may be beneficial.
Although there is no universally accepted means of diagnosing open-angle glaucoma, IOP is a commonly used and well-established risk factor and was therefore rigorously assessed by both Tono-Pen (performed by technicians) and Goldmann applanation (performed by glaucoma specialists). Despite adequate power to detect very small changes, there were no observed differences in IOP among study eyes compared with baseline or with fellow eyes at 3 months. Furthermore, there were no observed increases in cup-to-disc ratio, pattern standard deviation, or reduction (>10%) in RNFL that would suggest an increased risk of open-angle glaucoma.
Macular thickness measurements of the fellow eyes in our cohort were consistent with published normative OCT data,Citation21 and support our intention to enroll patients with unilateral pathology in order to use the fellow eye as a matched control. Not surprisingly, mean macular thickness measurements in epiretinal membrane and macular hole study eyes were significantly greater than in fellow eyes, but there was no difference observed between study eyes and fellow eyes with vitreous opacities. Local tractional forces on the macula in eyes with epiretinal membrane and the presence of vitreomacular traction in eyes with macular hole explain the increased thickness observed. Our 3-month results demonstrate a significant correlation between decreasing central subfield and improved visual acuity outcomes in eyes with epiretinal membrane as previously reported.Citation22 Despite detailed preoperative and postoperative analysis of the IS/OS junction, external limiting membrane, and cone outer segment line, we were unable to establish that any of these anatomic landmarks predicted visual acuity improvement.
In designing the PROVE study, there was compelling evidence to incorporate recent advances in peripapillary RNFL measurements by SD-OCT.Citation23 Quigley and Sommer reported that 12%–63% of optic nerve fibers can be lost before glaucomatous visual field defects are detected by routine kinetic perimetry,Citation24 and several recent studies have confirmed that serial SD-OCT RNFL measurements can reliably determine changes of 10% or greater and that relatively small percent changes in peripapillary RNFL may be a reliable indicator of glaucoma.Citation25 In our cohort, we observed that the mean temporal peripapillary RNFL thickness was significantly greater in eyes with epiretinal membrane (), presumably due to direct mechanical traction on the papillomacular bundle resulting in tenting and elevation of nerve fibers. Importantly, we observed a significant correlation between resolution of increased temporal RNFL thickness and visual acuity improvement in eyes with epiretinal membrane. This relationship has not been previously reported to our knowledge and may be an useful indicator to predict and monitor visual recovery in these eyes.
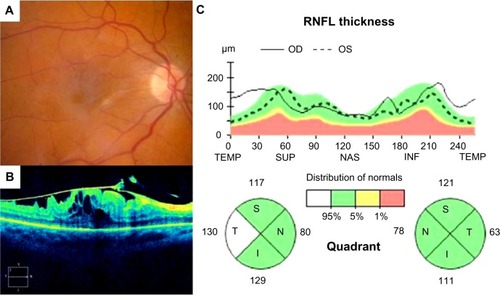
Figure 5 Fundus photograph (A), SD-OCT image of the macula (B) and SD-OCT optic nerve analysis (C) illustrating thickened T-RNFL in a patient with epiretinal membrane of the macula in the right eye compared with the fellow control eye. Note that the T-RNFL measures 130 μm in the eye with epiretinal membrane compared with 63 μm in the normal left eye
Increased temporal RNFL thickness may also explain some of the residual visual impairment experienced in patients with epiretinal membrane despite resolution of cystoid changes and return of normal macular architecture (intact IS/OS junction, external limiting membrane, cone outer segment line) after surgery. Recent advances in imaging have increased our understanding and appreciation of the vitreoretinal interface and its association with optic nerve disorders. The posterior vitreous strongly adheres around the optic nerve and vitreopapillary traction is a recognized cause of optic nerve disease.Citation26 Given our awareness of vitreopapillary traction as a potential cause of axonal injury, it is reasonable to presume that prolonged mechanical traction on the nerve fiber layer may also result in axonal injury via shearing forces and/or microvascular damage. Therefore, in addition to photoreceptor damage and cystoid changes, RNFL injury may also explain persisting visual disturbances in some eyes with epiretinal membrane.
As with all prospective studies, our results should be interpreted with caution. Foremost, our cohort may not be representative of other populations. In addition, a relatively small number of eyes were enrolled in the PROVE study overall. Nonetheless, our comparative analysis with matched fellow eyes gives us considerable statistical power to detect small differences. For example, our study is adequately powered to detect a 10% difference in RNFL thickness and a 0.3 mmHg difference in IOP between study and fellow eyes. Despite the study’s limitations, we would like to emphasize the strengths of the PROVE study, which include its rigorous design, investigation of a timely and unaddressed topic, and utilization of advanced imaging modalities to improve the sensitivity and validity of our findings. Furthermore, the longitudinal nature of the study may provide answers to several other questions regarding the influence of the vitreoretinal interface on chronic retinal disorders.
In conclusion, the early results of the PROVE study do not indicate any increased risk of open-angle glaucoma in eyes after vitrectomy, but suggest that a relatively high percentage of patients in this population may be at risk of angle closure glaucoma. Both temporal RNFL thickness and central subfield were significantly increased in eyes with epiretinal membrane, and resolution correlated with degree of visual recovery. Continued longitudinal follow-up of this cohort may provide important information on anatomic and functional outcomes that may have direct implications for the prevention and treatment of post-vitrectomy complications.
Acknowledgments
This work was supported by an unrestricted grant from Research to Prevent Blindness to the Vanderbilt University School of Medicine Department of Ophthalmology and Visual Sciences.
Disclosure
The authors report no conflicts of interest in this work.
References
- MachemerRBuettnerHNortonEWParelJMVitrectomy: a pars plana approachTrans Am Acad Ophthalmol Otolaryngol1971758138205566980
- NovakMARiceTAMichelsRGAuerCThe crystalline lens after vitrectomy for diabetic retinopathyOphthalmology198491148014846521988
- ScartozziRBessaASGuptaOPRegilloCDIntraoperative sclerotomy-related retinal breaks for macular surgery, 20- vs 25-gauge vitrectomy systemsAm J Ophthalmol200714315515617188054
- RizzoSBeltingCGenovesi-EbertFdi BartoloEIncidence of retinal detachment after small-incision, sutureless pars plana vitrectomy compared with conventional 20-gauge vitrectomy in macular hole and epiretinal membrane surgeryRetina2010301065107120616684
- [No authors listed]Vitrectomy with silicone oil or sulfur hexafluoride gas in eyes with severe proliferative vitreoretinopathy: results of a randomized clinical trial. Silicone Study Report 1Arch Ophthalmol19921107707791596224
- ChangSLXII Edward Jackson Lecture: open angle glaucoma after vitrectomyAm J Ophthalmol20061411033104316765671
- LukFOKwokAKLaiTYLamDSPresence of crystalline lens as a protective factor for the late development of open angle glaucoma after vitrectomyRetina20092921822418936722
- YuALBrummeislWSchaumbergerMKampikAWelge-LussenUVitrectomy does not increase the risk of open-angle glaucoma or ocular hypertension – a 5-year follow-upGraefes Arch Clin Exp Ophthalmol20102481407101420490533
- LalezaryMKimSJJiramongkolchaiKRecchiaFMAgarwalASternbergPJrLong-term trends in intraocular pressure after pars plana vitrectomyRetina20113167968521178658
- YanHDhurjonLChowDRWilliamsDChenJCVisual field defect after pars plana vitrectomyOphthalmology1998105161216169754165
- GrisantiSAltvaterAPetersSSafety parameters for indocyanine green in vitreoretinal surgeryDev Ophthalmol200842436818535380
- RollerABMahajanVBBoldtHCAbramoffMDRussellSRFolkJCEffects of vitrectomy on age-related macular degenerationOphthalmology20101171381138620176401
- LewisHAbramsGHBlumenkranzMSCampoRVVitrectomy for diabetic macular traction and edema associated with posterior hyaloidal tractionOphthalmology1992997537591594222
- InoueMMoritaSWatanabeYInner segment/outer segment junction assessed by spectral-domain optical coherence tomography in patients with idiopathic epiretinal membraneAm J Ophthalmol201015083483920719295
- ShiragamiCShiragaFNittaEFukudaKYamajiHCorrelation of increased fundus autofluorescence signals at closed macula with visual prognosis after successful macular hole surgeryRetina20123228128821909053
- GabrieleMLWollsteinGIshikawaHOptical coherence tomography: history, current status, and laboratory workInvest Ophthalmol Vis Sci2011522425243621493951
- ThompsonJTDoes vitrectomy increase the risk of glaucoma?Retina2011311007100821499188
- GordonMOKassMAThe Ocular Hypertension Treatment Study: design and baseline description of the participantsArch Ophthalmol199911757358310326953
- BansalASalmonJFMalhotraRPatelCKRosenPDelayed acute angle closure after macular-hole surgeryEye20031777978112928696
- HanDPLewisHLambrouFHJrMielerWFHartzAMechanism of intraocular pressure elevation after pars plana vitrectomyOphthalmology198996135713622780005
- LiuTHuAYKainesAYuFSchwartzSDHubschmanJPA pilot study of normative data for macular thickness and volume measurements using cirrus high-definition optical coherence tomographyRetina2011311944195021499190
- KimSJMartinDFHubbardGBIncidence of post-vitrectomy macular edema using optical coherence tomographyOphthalmology20091161531153719501405
- SungKRKimDYParkSBKookMSComparison of retinal nerve fiber layer thickness measured by Cirrus HD and Stratus optical coherence tomographyOphthalmology20091161264127019427696
- QuigleyHASommerAHow to use nerve fiber layer examination in the management of glaucomaTrans Am Ophthalmol Soc1987852542723447335
- LinSCSinghKJampelHDAmerican Academy of Ophthalmology; Ophthalmic Technology Assessment Committee Glaucoma Panel. Optic nerve head and retinal nerve fiber layer analysis: a report by the American Academy of OphthalmologyOphthalmology20071141937194917908595
- NomuraYTamakiYYanagiYVitreopapillary traction diagnosed by spectral domain optical coherence tomographyOphthalmic Surg Lasers Imaging201041SupplS74S7621117606