
 ?Mathematical formulae have been encoded as MathML and are displayed in this HTML version using MathJax in order to improve their display. Uncheck the box to turn MathJax off. This feature requires Javascript. Click on a formula to zoom.
Abstract
Background
The purpose of this study was to examine retinal recovery processes to pographically by the application of three flash sequences with specific interstimulus intervals.
Methods
Twelve healthy subjects underwent multifocal electroretinography with a light-emitting diode stimulator. Every flash sequence consisted of three flashes with 25 msec between the first and the second flash and 35 msec between the second and the third flash. The interval between the third and the first flash of the next step was 85 msec. The interstimulus interval-dependent amplitude reductions of the multifocal electroretinographic response for these three intervals yielded three data points that were used to determine the complete curve of the recovery kinetics.
Results
Amplitude reductions were higher with shorter interstimulus intervals. The mean half-life periods of the recovery kinetics for the different concentric rings and all subjects were: ring 1, 29.3±5.9 msec; ring 2, 24.2±6.4 msec; ring 3, 23±4.1 msec; ring 4, 23.1±4.6 msec; and ring 5, 22.3±4.4 msec. The differences between the first and all other rings were statistically significant (P<0.05).
Conclusion
The kinetics of the amplitude recovery after short interstimulus intervals showed a spatial distribution, with faster recovery toward the macular periphery.
Introduction
Responses on electroretinography (ERG) show diminished amplitudes when preceded by a sufficiently short time lag after a first response. The amplitude reduction increases with shortening of the interstimulus interval (ISI).Citation1,Citation2 Full recovery of the true scotopic rod-dependent response requires an ISI of at least several seconds depending on the stimulus conditions.Citation2,Citation3 The recovery of the cone-dependent system can be studied in detail under photopic conditions using a very short ISI; for example, Skrandies and Raile described a recovery of photopic ERG amplitudes earlier than 100 msec.Citation4 Applying this knowledge to the clinical diagnosis of retinal pathology, a topographical analysis of retinal recovery processes would be helpful, firstly to determine if there are local differences in amplitude recovery across the retina, and secondly to test if specific retinal pathologies lead to locally detectable disturbances in amplitude recovery. The multifocal ERG technique, which enables topographical analysis of central retinal function, uses cathode ray tube or liquid crystal display monitors with fixed frame frequencies for stimulation. The rigid default frame length does not allow stimulation settings that would make it possible to estimate amplitude recovery kinetics in a detailed manner. Light-emitting diode (LED) stimulators have been used previously to record multifocal ERGs, and can be driven with variable frame rates and generate dark and bright steps of the desired duration.Citation5 The aim of this study was to examine the topography of retinal refractory processes using multifocal ERG with LED stimulation.
Materials and methods
The photopic response amplitudes of the second flash after a short ISI have recovery kinetics that can be described by an exponential function with saturation after an ISI of sufficient length.Citation4 To determine and describe the characteristics of such kinetics without needing to test a multitude of different ISI, we used a model proposed by Bartz-Schmidt et al for scotopic Ganzfeld ERGs.Citation6 The retina is stimulated with a triple-flash procedure, whereby the first flash is followed by a second flash after a short ISI of 25 msec, followed by a third flash after a medium ISI of 35 msec, and the first flash comes after a sufficient duration to stimulate a maximal amplitude of 85 msec. Based on the data for these three ISI and corresponding amplitudes, and using the above-mentioned mathematical model to determine the function of the amplitude recovery kinetics, the half-life of the function was calculated using Origin 6.0 software (OriginLab Corporation, Northampton, MA, USA) for the average response of each concentric ring:
where b(t) represents the amplitude for each time point of the recovery curve, bmax is the maximal amplitude after an infinite dark interval, dt represents a time constant, and t1/2 represents the half-life of the recovery curve, ie, the time necessary for 50% recovery compared with maximal amplitude. The t1/2 results for concentric rings were compared using the paired Wilcoxon signed-rank test.
The retina was stimulated using an LED stimulator (Stasche and Finger GmbH, Brandenburg, Germany) driven by a frame frequency of 100 Hz, resulting in a frame length of 10 msec. The luminance of the dark step was 0.2 cd/m2 and that of the light step was 264 cd/m2 (tested with a Minolta luminance meter; Konica Minolta, Inc., Tokyo, Japan). The LED emitted a bright yellow light with a wavelength of 570–590 nm. Eye safety was not tested.
The recordings were performed according to International Society for Clinical Electrophysiology of Vision guidelines.Citation7 Each subject’s pupils were dilated using phenylephrine 5% and tropicamide 1% eye drops. Contact lens electrodes (ERG-Jet™; Universo S.A., Lausanne, Switzerland) were used. Fixation was not monitored, but amplitude-dependent automatic artifact rejection was used. Recordings were done monocularly, refraction was corrected, if necessary. The stimulus covered the central 60 degrees of the visual field. The size of the stimulation hexagons decreased toward the center to compensate the higher central photoreceptor density and to obtain a consistent signal to noise ratio across the tested field. The distortion factor was 4. Therefore, amplitude densities (response amplitudes divided by the area of the corresponding stimulation hexagon [nV/deg2]) were used for the quantitative analysis as recommended by the International Society for Clinical Electrophysiology of Vision standard. Within the light frame itself, the portion of the light phase could be chosen and was set to 5 msec. Thus, with a frame sequence of 1001000100000000 for each step of the M-sequence, the result was an ISI of 25 msec, 35 msec, and 85 msec. The M-sequence had a length of 2Citation12 steps resulting in a test duration of 8×86 seconds.
A pilot study was performed in six subjects using a frame frequency of 60 Hz with double flashes and an ISI of 16.7 (ISI 17), 33.3, 50, and 67 msec. Filter settings were at 5–100 Hz. After obtaining informed consent and following the tenets of the Declaration of Helsinki, 12 healthy subjects of mean age 25±3 years were examined using the three-flash procedure with a field resolution of 61 hexagons. The t1/2 of the recovery kinetics was determined for the potentials of five concentric rings of the stimulus. The peaks for the recorded waveforms were identified by one investigator as local minima (arising from the descending leg of the preceding response) and maxima.
To determine the optimal ISI for the triple-flash paradigm, the minimal ISI required to obtain a maximal amplitude (equal to a response after an infinite dark interval) had to be determined. For this purpose, six subjects were examined using twin flash sequences with ISI of 17, 33, 50, and 67 msec. The 12 subjects in the main study and the six subjects in the pilot study overlapped. The Kolmogorov-Smirnov test (IBM® SPSS® Statistics for Windows software; IBM Corp., Armonk, NY, USA) revealed that our data were normally distributed. The standard deviation was calculated as:
where
is the mean.
Results
shows the mean sum responses for both eyes in all subjects of the pilot study. Whereas no clear second peak in the sum responses is visible at an ISI of 17 msec, the response at 33 msec appears to be reduced, while the responses at 50 msec and 67 msec show no marked difference in amplitude compared with the first flash. Respective comparison of the amplitudes for the 33 msec and 50 msec responses with the amplitude of the first response and ring averages using a paired Student’s t-test was significant for the 33 msec responses in all subjects but not significant for the 50 msec responses. shows that the 33 msec responses are significantly smaller than the first responses, but that the amplitudes have already recovered after an ISI of 50 msec. We concluded that an interval of 85 msec after the third flash (and before each first flash) was sufficient to obtain a maximal amplitude and that the intervals of 25 msec and 35 msec would lie in the ascending part of the amplitude recovery curve.
Figure 1 Summed responses for multifocal electroretinographic recordings with twin-flash application showing amplitude recovery of the second flash with increasing ISIs of 17, 33, 50, and 67 msec.
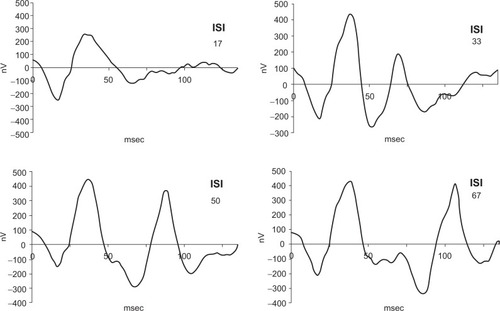
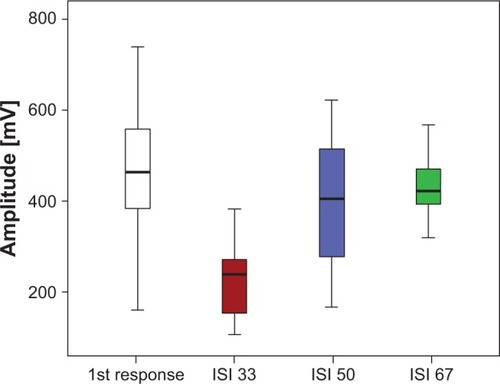
Figure 2 Mean response amplitudes of the second flashes with twin flash application after ISI of 33 msec (red), 50 msec (blue), and 67 msec (green) in relation to the first flash responses (white). The ISI 33 responses are significantly smaller than the first responses, with no significant difference seen between the first and ISI 50 and ISI 67 responses.
shows the multifocal ERG result for one subject using the triple-flash stimulus. Because of the long duration of each single step (160 msec) and a lower resulting total number of M-sequence steps (n=212), the responses appear somewhat noisier than the responses from regular multifocal ERG recordings with 61 hexagons. On the other hand, the single step of the triple-flash procedure should have a better signal to noise ratio than a regular multifocal ERG step because it contains responses to three flashes, which means a higher amount of signal. We did not quantify the actual signal to noise ratios, but practice showed that the curve properties were clear enough to identify the peaks and determine the amplitudes. An amplitude-dependent artifact rejection algorithm was used to reduce noise.
Figure 3 Multifocal electroretinographic result for a normal subject with triple-flash stimulation with three peaks in each response. The largest first peak is the response after an interval of >85 msec, the second peak after 25 msec, and the third after 35 msec.
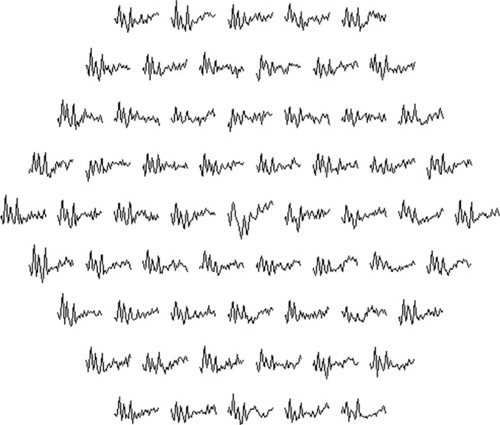
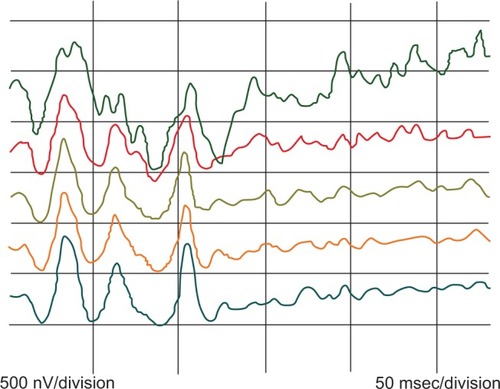
The responses show three peaks, the first of which (P85), with a preceding interval of at least 85 msec, is the largest. The second peak (P25) after an ISI of 25 msec is the smallest and the last peak (P35) after an ISI of 35 msec is of medium amplitude. shows the ring averages for the same subject. From the average responses on the left, it can be seen that there is a tendency for consecutive peaks, especially P25, to show increasing amplitude with increasing eccentricity, and thus a tendency to recover earlier from the preceding flash.
Figure 4 Ring analysis for the same subject. Green, ring 1; red, ring 2; brown, ring 3; orange, ring 4; and blue, ring 5.
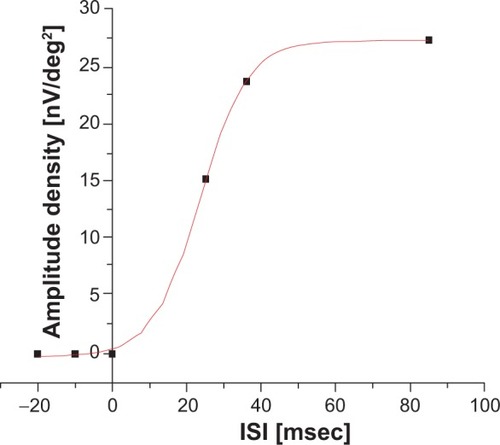
The recovery kinetics for the subject described above are shown in . The three dots at 25 msec, 35 msec, and 85 msec represent the amplitude densities measured for the P25, P35, and P85 peaks, respectively, in ring 3. Under the logical assumption that an infinitely small ISI would lead to an amplitude of 0 and not a negative amplitude, a corresponding point was set at 0 msec. Further points with an amplitude of 0 were added in the negative part of the ordinate. These were necessary for a correct sigmoidal fit of the recovery curve. Otherwise, our mathematical model would have yielded negative amplitudes with a small ISI in a major part of the calculations.
Figure 5 Amplitude recovery kinetics based on the measured interstimulus interval of ring 3 for the same subject.
Mean amplitude densities for the concentric ring responses at the three stimulated peaks are displayed in . The mean half-lives for the different concentric rings and all subjects were: ring 1, 29.3±5.9 msec; ring 2, 24.2±6.4 msec; ring 3, 23±4.1 msec; ring 4, 23.1±4.6 msec; and ring 5, 22.3±4.4 msec. The differences between the first and other rings were statistically significant (P<0.05, ). There were no significant differences between rings 2, 3, 4, and 5.
Figure 6 Half-lives of the amplitude recovery kinetics showing more rapid recovery peripherally.
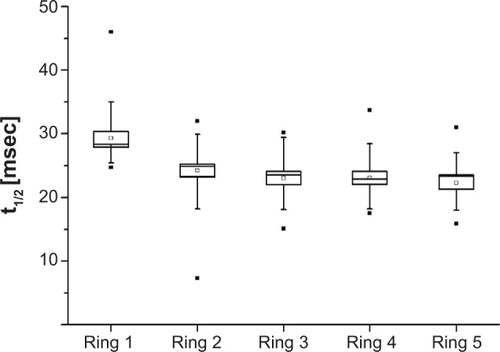
Table 1 Mean amplitude densities and standard deviations for concentric ring responses at the three stimulated peaks of P85, P25, and P35 (nV/deg2)
Discussion
Different theories exist about the reason for the reduction in amplitude seen with repeated scotopic ERGs. Early publications suggested active postexcitatory inhibition of the rod system because, even when recorded under scotopic circumstances (dark adaptation, low flash intensities), the second response seemed to have photopic contributions in short ISI: Burian and Spivey reported more rapid amplitude recovery at higher flash intensities,Citation1 Elenius described a refractory period of several hundred milliseconds in patients with achromatopsia,Citation2 and Gliem et al found smaller second peaks with longer dark adaptation using an ISI of 120 msec.Citation8 Therefore, the recording of double-flash ERG under scotopic conditions has been shown to be sensitive in several macular disorders.Citation8,Citation9
Another obvious explanation is a light-adapting photochemical process being involved in the first flash (bleaching of rhodopsin).Citation10 Arden et al concluded that, when using repetitive light flashes, suppression of ERG amplitude was independent of the light period and that this suppression was a neural rather than a photochemical process.Citation11 This conclusion has been supported by others who have located this process to the middle retinal layers with special focus on amacrine cells,Citation12 which seem to modify and stabilize retinal output.Citation13 Studies of retinal adaptation processes seem to support the idea that a combination of photochemical and neuronal mechanisms is involved in refractory processes in the retina.Citation14,Citation15
Previous studies have suggested that the decrease in amplitude after a short ISI is due to local metabolic processes in the retina and that, during recovery, the ERG response at any given moment reflects the balance between supply and demand of energy.Citation7
The results of this study show that recovery in amplitude of the multifocal ERG response is slowest in the center of the macula and becomes more rapid toward the periphery. A possible explanation for this phenomenon could be the structural tendency toward underperfusion and hypoxia in the central fovea.Citation16 The foveal photoreceptor density is the highest across the whole retina,Citation17 photoreceptors consume more oxygen than any other cell type,Citation18 and the fact that each foveal cone gives input to several proximal neurons in a nonconvergent manner even increases the density of energy-demanding cells. The central foveal oxygen demand is so high that in macaques, photoreceptors consume the complete choroidal supply and are dependent on supplement from the retinal vessels in special conditions.Citation19 Despite this fact, there is an avascular foveal zone, which seems to be not simply an adaptation of the vasculature to foveal depression but a concession to optimize the optics, rather, the cellular architecture in the foveal depression adapts to the insufficient blood supply. Provis concludes that, in the adult macula, oxygen supply and consumption are “on a knife-edge”, a phenomenon that must be held liable for the fact that the complications of age-related macular degeneration mostly occur in the center of the macula.Citation16 The relative metabolic stress is highest centrally and decreases in a concentric manner toward the periphery. We conclude from the similar pattern of retinal refractory times in our study that, in photopic ERGs, after depletion of retinal metabolic resources following a first flash, the unfavorable energy supply in the central fovea could explain the slightly prolonged amplitude recovery times compared with the neighboring periphery. A possible way to test this theory in future studies could be to correlate amplitude recovery distributions using new methods of topographical perfusion analysis that have been described recently.Citation20
A centripetal delay of multifocal ERG peak times, similar to our observed distribution of recovery half-lives, is known.Citation21 Whereas nasotemporal latency differences have been attributed to inner retinal activity, to our knowledge, the concentric latency delays have not been explained.Citation22 One possible way to test if our supposed physiological explanation of the amplitude recovery topography also explains the concentric latency delays would be to compare intersubject variations of the topography of both phenomena.
An interesting issue is the relationship between the results of the analysis of higher order kernels in multifocal ERG with our results in particular or with Ganzfeld double-flash ERG experiments in general. Higher order kernels represent the interactions between responses generated by different stimulation steps (base periods) of the M-sequence (consecutive base periods in the case of the first slice of the second order kernel [SOK], which has received the most attention, or base periods that are further apart).Citation23 The SOK “response” is generated by the mathematical difference of a (reduced) response that was preceded by a light step and a full response with no preceding light step, and thus should be affected by the same factors that affect the recovery kinetics of cone ERGs, as have been investigated in the present study and in photopic Ganzfeld experiments.
SOK responses have been attributed to retinal non-linearities at the level of the optic nerve head,Citation24 the inner retina,Citation25,Citation26 the inner plexiform layer,Citation27 or the outer plexiform layer,Citation28 and in this respect are explained similarly to the neuronal theory for refractory processes in scotopic ERGs. A characteristic topography of SOK responses, such as the typical amplitude density distribution in the first order kernel response, has not been described to our knowledge (a SOK response peak can be located in the nasal retina in some cases).Citation29 In particular, the centrifugal faster amplitude recovery that we have found cannot be confirmed by SOK results. A possible explanation could be that the kernel analysis can describe the retinal recovery kinetics only in a limited way because it is restricted to ISI that are a multiple of the base period, which in turn is determined by the monitor frame frequency. Another point may be the fact that the SOK response not only represents simple amplitude reduction but also the mathematical difference of the complete waveforms, and could therefore be influenced by factors other than the half-life periods obtained here.
The significance of this study is that the theory regarding a relative oxygen deficit in the central macula on anatomical observation is confirmed by a functional finding for the first time. Assuming that amplitude recovery reflects the balance of oxygen supply and demand, the multifocal triple-flash ERG could add diagnostic information in a number of macular vascular diseases, such as diabetic retinopathy and vessel occlusion, as well as in rare disorders such as foveal telangiectasia.
In conclusion, topographical analysis of retinal recovery processes using LED stimulation with a triple-flash paradigm revealed delayed central recovery compared with the peripheral macula. The presumed reason for this phenomenon is the unfavorable relationship between energy demand and supply in the central macula. More research is needed to determine if this test procedure can yield additional information regarding the diagnosis and treatment of macular disorders.
Disclosure
The authors report no conflicts of interest in this work.
References
- BurianHMSpiveyBEThe effect of twin flashes and of repetitive light stimuli on the human electroretinogramAm J Ophthalmol195948Part 227428613806108
- EleniusVRecovery of retinal function from suppression caused by flashes of light. Electroretinogram measurements in totally color-blind eyesArch Ophthalmol1967782972995298707
- GjotterbergMDouble flash human electroretinogram with special reference to the oscillatory potentials and the early phase of dark adaptation: a normative studyActa Ophthalmol1974522913044406860
- SkrandiesWRaileACortical and retinal refractory periods in the human visual systemInt J Neurosci1989441851952562053
- SmithDCKeatingDParksSEvansALAn instrument to investigate temporal processing mechanisms with the multifocal ERGJ Med Eng Technol20022614715112396329
- Bartz-SchmidtKUBrunnerREsserPLukeCWalterPSickelWThe triple flash electroretinogram and its significance in macular diseases. B-wave recovery as a diagnostic toolGraefes Arch Clin Exp Ophthalmol19962346046118897051
- HoodDCBachMBrigellMISCEV guidelines for clinical multifocal electroretinography (2007 edition)Doc Ophthalmol200811611117972125
- GliemHMollerDEKietzmannGThe double flash ERG in diabetic retinopathyActa Ophthalmol (Copenh)1973518594 German4739680
- MitsuyuMHondaYNegiAApplication of twin flash stimuli for some mascular diseases isolation of local responses by twin flashesActa Ophthalmol1980586886967211257
- AdrianEDThe electric response of the human eyeJ Physiol19451048410416991672
- ArdenGGranitRPonteFPhase of suppression following each retinal b-wave in flickerJ Neurophysiol19602330531413794108
- AlgverePWestbeckSHuman ERG in response to double flashes of light during the course of dark adaptation: a Fourier analysis of the oscillatory potentialsVision Res1972121952145033684
- SchneiderTZrennerEDouble-flash responses in different retinal layersOphthalmic Res1987191931993696695
- DowlingJEWaldGVitamin A deficiency and night blindnessProc Natl Acad Sci U S A19584464866116590255
- RushtonWAPowellDSEarly phase of dark-adaptationVision Res197212108310935043564
- ProvisJMDevelopment of the primate retinal vasculatureProg Retin Eye Res20012079982111587918
- CurcioCASloanKRKalinaREHendricksonAEHuman photoreceptor topographyJ Comp Neurol19902924975232324310
- YuDYCringleSJOxygen distribution and consumption within the retina in vascularised and a vascular retinas and in animal models of retinal diseaseProg Retin Eye Res20012017520811173251
- AhmedJBraunRDDunnRJrLinsenmeierRAOxygen distribution in the macaque retinaInvest Ophthalmol Vis Sci1993345165218449672
- NelsonDAKrupskySPollackASpecial report: noninvasive multi-parameter functional optical imaging of the eyeOphthalmic Surg Lasers Imaging200536576615688972
- SutterEETranDThe field topography of ERG components in man. I. The photopic luminance responseVision Res1992324334461604830
- HoodDCAssessing retinal function with the multifocal techniqueProg Retin Eye Res20001960764610925245
- SutterEThe interpretation of multifocal binary kernelsDoc Ophthalmol2000100497511142749
- SutterEEBearseMAJrThe optic nerve head component of the human ERGVision Res19993941943610341974
- PalmowskiAMSutterEEBearseMAJrFungWMapping of retinal function in diabetic retinopathy using the multifocal electroretinogramInvest Ophthalmol Vis Sci199738258625969375578
- RazDPerlmanIPercicotCLLambrouGNOfriRFunctional damage to inner and outer retinal cells in experimental glaucomaInvest Ophthalmol Vis Sci2003443675368412882823
- HasegawaSOhshimaAHayakawaYTakagiMAbeHMultifocal electroretinograms in patients with branch retinal artery occlusionInvest Ophthalmol Vis Sci20014229830411133882
- HoodDCGreensteinVFrishmanLIdentifying inner retinal contributions to the human multifocal ERGVision Res1999392285229110343810
- LangrovaHZrennerEKurtenbachASeeligerMWAge-related changes in retinal functional topographyInvest Ophthalmol Vis Sci2008495024503218539946