Abstract
Purpose
To evaluate and compare the abilities of enhanced depth imaging (EDI) and high-penetration optical coherence tomography (HP-OCT) to visualize the deep optic nerve head (ONH) and deep parapapillary structures.
Methods
Horizontal and vertical optic nerve images were obtained using EDI-OCT and HP-OCT, during the same visit, from 24 eyes of 12 patients with glaucoma. Three graders, using a three-point grading system, independently graded the visibility of the deep ONH structures (prelaminar tissue surface, anterior laminar surface, posterior laminar border, and laminar pores) and deep parapapillary structures (intrascleral vessels, cerebrospinal fluid space, and parapapillary choroid). The differences in the visibility scores between the EDI-OCT and the HP-OCT images and among the image locations were analyzed statistically. The agreement in scoring among the graders also was analyzed.
Results
The visibility of three ONH structures, the anterior laminar surface, posterior laminar border, and laminar pores, was significantly better with EDI-OCT (P = 0.0010, P < 0.0001, and P = 0.0141, respectively). In contrast, the visibility of all parapapillary structures was significantly better with HP-OCT (P < 0.0001, P = 0.0176, and P < 0.0001, respectively). The visibility scores were better in the vertical images compared with the horizontal images and were best in the temporal quadrants. The intergrader agreement was moderate for all parameters examined.
Conclusion
Both EDI-OCT and HP-OCT are useful for evaluating the deep ONH and parapapillary structures. The visibility scores of the deep ONH structures were better with EDI-OCT, in contrast to the better visibility scores of the deep parapapillary structures with HP-OCT. Both systems should be chosen depending on the target tissue to observe.
Introduction
Glaucoma is an optic neuropathy, structurally characterized by an enlarged cupping of the optic nerve head (ONH) and thinning of the parapapillary retinal nerve fiber layer (RNFL). Novel imaging techniques, such as optical coherence tomography (OCT), have enabled qualitative and quantitative assessments of structural damage in the ONH and the RNFL.Citation1 Measuring the topographic parameters of the ONH surface and the parapapillary RNFL thickness with spectral-domain OCT (SD-OCT) has been shown to be an especially reliable method for detecting the onset and the progression of glaucoma.Citation2
In addition to imaging of the shallow ONH structures and RNFL, evaluation of the deep ONH and the deep parapapillary structures, such as the lamina cribrosa, vascular structures, and the parapapillary choroid, are critically important for glaucoma. The lamina cribrosa is considered to be the primary site of axonal damage in glaucoma.Citation3–Citation5 Impaired blood supply and dysfunctional blood flow regulation to the ONH are considered to be significant risk factors for glaucoma.Citation6–Citation8 These reports emphasize the necessity of evaluating the deep ONH structures in eyes with glaucoma. However, conventional SD-OCT devices, which use wavelengths around 800 nm have limited ability to visualize these important ocular structures.Citation9 In conventional SD-OCT images, the decrease in sensitivity with increasing depth of samples makes it challenging to image deep structures. Scatter and absorption of light through the overlying tissues also decrease the signal strength of the deeper structures, in SD-OCT images.
Two different imaging techniques, enhanced depth imaging OCT (EDI OCT) and high-penetration (HP)-OCT,Citation10,Citation11 have been developed to enhance the visualization of these deeper structures. EDI OCT enhances the visualization of deeper structures by intentionally positioning an SD-OCT device closer to the eye than in normal practice. By doing so, the deeper portions of the sample come closer to the “zero-delay” line, where the SD-OCT has highest sensitivity.Citation10 On the other hand, HP-OCT uses a long-wavelength light source, of 1 micron (near infrared light), that is less vulnerable to light scattering. This longer-wavelength light has the ability to penetrate more deeply into tissue compared with the short-wavelength light used in conventional SD-OCT devices.Citation11,Citation12 There are several reports that have shown successful visualization of the deep ONH and/or parapapillary structures using either EDI OCTCitation13–Citation15 or OCT with long-wavelength light.Citation16,Citation17 However, to the best of our knowledge, EDI OCT and HP-OCT have not been compared directly in terms of ONH imaging.
The aim of the current study was to compare the relative abilities of EDI OCT and HP-OCT in visualizing the deep ONH and parapapillary structures.
Materials and methods
Consecutive patients with open-angle glaucoma were recruited from the Glaucoma Clinic at the Osaka University Hospital, Japan. Open-angle glaucoma was defined as the presence of glaucomatous optic nerve damage (localized or diffuse neuroretinal rim thinning and/or RNFL defect) and an associated visual field defect, with an open angle confirmed on gonioscopy. Exclusion criteria included the existence of any other ocular or neurologic disorder that could cause visual field defects and a history of intraocular surgery except for cataract extraction. All subjects underwent comprehensive ophthalmic examinations, including measurement of the best-corrected visual acuity, Goldmann applanation tonometry, slit-lamp biomicroscopy, gonioscopy, dilated fundus examination, OCT, and standard automated perimetry, using the Humphrey® Visual Field Analyzer IIi 750 (Carl Zeiss Meditec, Jena, Germany) and integrated 30-2 Swedish Interactive Threshold Algorithm (SITA) software program.
The use of a prototype HP-OCT and the protocol of this study were approved by the institutional review board of the Osaka University Hospital. Each participant provided written, informed consent before they were included. All study procedures adhered to the tenets of the Declaration of Helsinki for research involving human subjects.
EDI OCT
For the EDI OCT, a Spectralis® SD-OCT device (Spectralis HRA + OCT version 5.4.7.0, Heidelberg Engineering GmbH, Heidelberg, Germany) was used. The device had an maximum output power of 1.2 mW and a scan speed of 40,000 A-scans/second and the axial and transverse resolutions were 3.9 μm and 6 μm, respectively. The OCT device was positioned sufficiently close to the eye to create an inverted image near the top of the display. The image was adequately separated from the top of the display so as to avoid any image ambiguity caused by image folding with respect to 0 depth. Horizontal and vertical line scans were obtained with the “high resolution” mode, at a scanning angle of 20 degrees. Scans were placed at the center of the ONH with reference to fundus photographs. Each cross-sectional B-scan was averaged from 100 frames, to reduce speckle noise. Only those images whose quality scores exceeded 15 were processed. The EDI OCT images were exported from the OCT device and inverted before the images were scored.
Prototype high-penetration OCT
A prototype swept-source HP-OCT device (Topcon Corp, Tokyo, Japan) was used to image the ONH and the parapapillary area. This device is based on swept-source OCT technology and has a scanning speed of 100,000 A-scans/second. The center wavelength of the probe beam was 1,060 nm. The OCT power delivered to the sample was 0.9 mW, and the axial and transverse resolutions were 8 μm and 20 μm, respectively. This long-wavelength probe enables deep penetration to the choroid – the detailed profile of this instrument has been described elsewhere.Citation11,Citation12 Twelve radial 6 mm line scans were obtained from each eye. The scans were placed on the same location as the EDI OCT, by referring to fundus photographs. Both horizontal and vertical line scans were used for the comparison with the EDI OCT. Up to 32 images were taken in the same location and were averaged later to improve image quality.
Grading of OCT images
The OCT images were evaluated for the visibility of the deep ONH structures (prelaminar tissue surface, anterior laminar border, posterior laminar border, and laminar pores) and the deep parapapillary structures (intrascleral vessels, cerebrospinal fluid [CSF] space, and parapapillary choroid). Each landmark was identified based on morphologic features described in previous publications.Citation11,Citation12,Citation17–Citation19 The prelaminar tissue surface was seen as a border between the low reflective vitreous cavity and the optic nerve tissue. The lamina cribrosa was identified as a horizontally oriented, highly reflective signal below the optic disc. The laminar pore was identified as the vertically oriented, continuous low-reflective area within the lamina cribrosa. Intrascleral vessels were seen as areas of continuous low reflectivity within the sclera. The CSF space was identified as a low-reflective space below the sclera, surrounding the optic nerve. The choroid was defined as the layer between the highly reflective Bruch’s membrane and the sclera.
Three experienced ophthalmologists, each having at least 5 years of experience with ophthalmic OCT imaging, independently graded the visibility. The graders used a three-point scoring system in which a score of 1 indicated “good” visibility, a score of 2 indicated “moderate” visibility, and a score of 3 indicated “no visibility.” The visibility of the structure was flagged as “good” if more than two-thirds of its surface within the range of the image could be delineated. The visibility was fagged as “no visibility” if the grader could not identify any part of the structure. The visibility was scored as “moderate” when the visibility of the structure was between “no visibility” and “good.” The visibility of the deep ONH structures were graded separately in the horizontal and vertical images, and the visibility of the deep parapapillary structures were graded separately, in four quadrants (superior, inferior, temporal, and nasal).
Statistical analysis
The Wilcoxon signed-rank test was used to evaluate the differences in the visibility of the identified structures on the EDI OCT and HP-OCT images. Fleiss’ modified kappa coefficient was used to analyze the interobserver agreement in scoring. The differences in visibility scores among the different locations also were evaluated. The differences in the visibility of the deep ONH structures between the horizontal and vertical images were analyzed using the Wilcoxon signed-rank test. The visibility of the deep parapapillary structures among the quadrants was compared using the Kruskal–Wallis rank sum test. All statistical analyses were performed using the commercially available software JMP® version 8.0 (SAS Institute Inc., Cary, NC, USA). P-values < 0.05 were considered statistically significant.
Results
Patient demographic data
This study initially involved 13 subjects. Of these, one subject was excluded because of poor cooperation during image acquisition. The 24 eyes of the remaining 12 subjects (seven women, five men) were enrolled. The age (mean ± standard deviation) of the participants was 54.6 ± 14.4 years. The average visual field mean deviation was −10.48 ± 6.99 dB. The mean spherical equivalent refractive error was −5.71 ± 3.31 D. The mean intraocular pressure was 13.6 ± 2.3 mmHg. Twenty-two eyes were phakic, and two eyes were pseudophakic.
Interobserver agreement in grading
The interobserver agreement was moderate. Fleiss’ modified kappa coefficient values for the overall, EDI OCT, and HP-OCT interobserver agreements were 0.5517, 0.5405, and 0.5602, respectively.
Visibility of the structures
The prelaminar tissue surface could be easily identified with both EDI OCT and HP-OCT, in all eyes examined (). The mean visibility score for the prelaminar tissue surface was 1.04 in the EDI images and was 1.02 in the HP-OCT images, and these were not significantly different from each other ().
Figure 1 (A) Vertical EDI OCT and (B) HP-OCT images of the deep optic nerve head and deep peripapillary structures.
Abbreviations: EDI OCT, enhanced-depth imaging optical coherence tomography; HP-OCT, high-penetration optical coherence tomography.
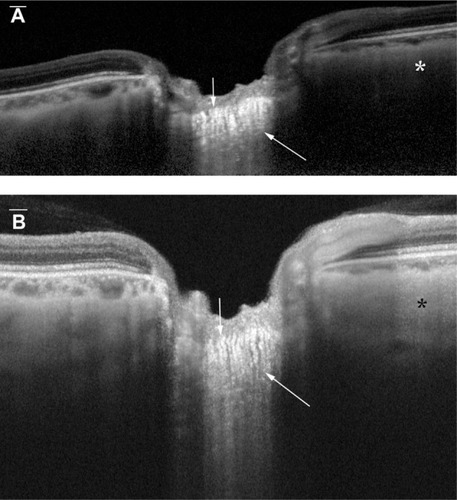
Figure 2 Representative HP-OCT image showing scleral vessels.
Abbreviation: HP-OCT, high-penetration optical coherence tomography.
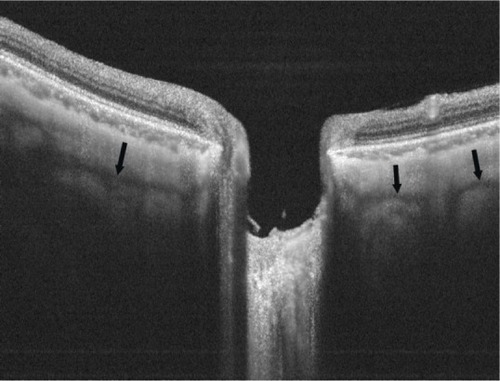
Table 1 Mean subjective visibility scores with EDI OCT and HP-OCT, for deep the ONH and parapapillary structures
Both the EDI OCT and HP-OCT also provided excellent visualization of the anterior laminar border. The mean visibility score for the anterior laminar border was significantly better in the EDI OCT images (1.33) than in the HP-OCT images (1.52). The posterior laminar border was generally more difficult to identify than was the anterior laminar border. The mean visibility score for the posterior laminar border was also significantly better in the EDI OCT images (2.10) than in the HP-OCT images (2.62). The laminar pores were identified as low reflective areas surrounded by highly reflective striations within the lamina cribrosa in some eyes. The mean visibility score for the laminar pore was also significantly better in the EDI OCT images (1.99) than it was in the HP-OCT images (2.13).
On the other hand, the HP-OCT images had a significantly better mean visibility score for the intrascleral vessels (2.26) () than did the EDI OCT images (2.82). The mean visibility score for the choroid was also significantly better in the HP-OCT images (1.02) compared with the EDI OCT images (1.47), although the choroid was generally well visualized in most of the eyes by both instruments. Both instruments provided similarly poor visualization of the CSF space (2.93 with the EDI OCT vs 2.87 with the HP-OCT) around the ONH, in this series.
The scan location also influenced the visibility. The visualization of some of the deep ONH structures (ie, the anterior laminar border and laminar pores with the EDI OCT, and the laminar pores with the HP-OCT) was significantly better in the vertical images compared with horizontal images (P = 0.0476, P < 0.0001, and P < 0.0001, respectively) (). For parapapillary structures, the visibility of the intrascleral vessels, the CSF space, and the choroid was significantly better in the temporal quadrants than in other locations with EDI OCT (P < 0.0001, P < 0.0001, and P < 0.0001, respectively). In the HP-OCT images, the visibility of the scleral vessels and of the CSF space was best in the temporal quadrant (P = 0.0009 and P < 0.0001, respectively) ().
Figure 3 Mean visibility scores of the deep peripapillary structures, by quadrant.
Abbreviations: CSF, cerebrospinal fluid; EDI OCT, enhanced-depth imaging optical coherence tomography; HP-OCT, high-penetration optical coherence tomography.
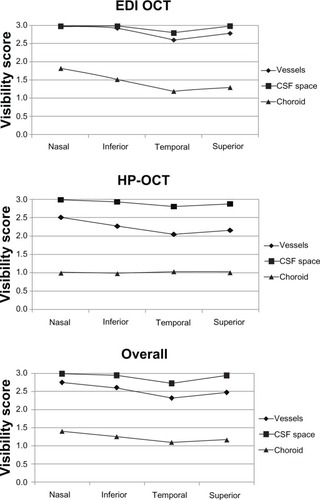
Table 2 Mean visibility scores of the deep ONH structures in horizontal and vertical images using EDI OCT, HP-OCT, and overall
Discussion
Despite its importance, detailed in vivo evaluations of the deep ONH structures have long been challenging because of the unsatisfactory visualization of the deep structures provided by conventional time-domain or SD-OCT instruments. Recent research has shown that EDI OCT has highly improved the visualization of the deep ONH structures.Citation13,Citation20 Studies using EDI OCT have revealed the substantial involvement of the deep ONH structures in glaucoma pathophysiology, including the thinning,Citation13,Citation14,Citation18 distortion,Citation21 and defects of the lamina cribrosa seen in glaucomatous eyes.Citation14,Citation22
HP-OCT is another emerging innovative technology for imaging the deep ONH structures and is potentially more suitable than EDI OCT for imaging deeper tissues, in that HP-OCT utilizes longer-wavelength light and consequently, has higher tissue penetration. HP-OCT has been shown to be useful in imaging deep parapapillary structures, such as the parapapillary choroid and the CSF space.Citation11,Citation12,Citation17 There are several reports that showed the crucial importance of the deep parapapillary structures, such as the parapapillary vessels, the parapapillary choroid, and the CSF space, in glaucoma. The ONH and the parapapillary choroid both receive their vascular supply from the short posterior ciliary arteries.Citation23 Decreased perfusion pressure and choroidal thickness have been reported in experimental glaucoma in monkeys.Citation6 Spaide reported a higher incidence of glaucoma in patients with age-related choroidal atrophy.Citation24 Ren et al reported an abnormally low CSF pressure in patients with normal-tension glaucoma.Citation25 We previously reported that the choroidal thickness was significantly thinner in glaucomatous myopic eyes compared with healthy myopic eyes.Citation26 In a nonmyopic population, a thinner choroid in glaucomatous eyes was also reported.Citation27
Taken together, both EDI OCT and HP-OCT can play important roles in clinical practice and research in glaucoma. However, EDI OCT and HP-OCT have not previously been directly compared.
The current results indicated that both EDI OCT and HP-OCT are useful for evaluating the deep ONH and the deep parapapillary structures. Both technologies provided excellent visualization of the prelaminar tissue surface, the anterior laminar border, and the parapapillary choroid, in all eyes studied. To the best of our knowledge, this is the first report to show the usefulness of HP-OCT for evaluating the deep ONH structures and the first to directly compare the performances of EDI OCT and HP-OCT in evaluating the deep ONH and parapapillary structures.
Although both instruments showed favorable results in imaging both the deep ONH and the deep parapapillary structures, there was a distinct difference in the imaging properties between the instruments. The difference can be explained by the difference between the EDI OCT and HP-OCT in the strategies used to enhance the visualization of deep structures. The EDI OCT enhances visualization by placing the deep structures closer to the zero delay, the most tightly focused area of the illumination. On the other hand, the HP-OCT enhances visualization by using longer-wavelength light to reduce light scatter.
In this study, the mean visibility scores for the choroid and the intrascleral vessels were significantly better in HP-OCT images compared with those in the EDI OCT images. This can be attributed to the difference in the wavelengths of light used in these two instruments.
Using longer-wavelength light, the HP-OCT images are less susceptible to scattering by the choroid and the sclera and to absorptions by the retinal pigment epithelium and the choroid than are OCT instruments, which use a shorter-wavelength light.Citation11 In the current study, the deep parapapillary structures were sometimes shadowed by strong light scatter or by light absorption by the overlying tissue in the EDI OCT images. The longer-wavelength light used in the HP-OCT showed a better ability to penetrate through the overlying retinal pigment epithelium to reach the deep parapapillary tissue.
In contrast, the mean visibility scores for both the anterior and the posterior laminar borders were better with the EDI OCT. The signal strengths of the deep ONH structures in the HP-OCT images were comparable with or even stronger than those in the EDI OCT images. In the HP-OCT images, however, low image contrast between the lamina cribrosa and the prelaminar or retrolaminar tissue sometimes complicated the identification of the laminar borders. Both OCT systems incorporate an image averaging algorithm to improve image contrast. Image averaging can improve image quality by reducing speckle noise, which is the cause of a grainy or textured appearance of the structures that complicates the delineation of tissue surfaces. On the other hand, image averaging can also be disadvantageous, by increasing motion artifacts, because it takes longer time to acquire more images. In our study eyes, image averaging substantially improved the image contrast, and thus, the advantageous effect of image averaging exceeded the disadvantage of causing possible motion artifacts. Our prototype HP-OCT provided averaging of up to 32 B-scans, whereas the EDI OCT allowed up to 100 B-scans. The higher image contrast of the EDI OCT may be, at least in part, attributable to the image averaging.
However, based on the current results, we cannot conclude that EDI OCT is superior to HP-OCT for imaging the lamina cribrosa. We identified the border of the lamina cribrosa with reference to the difference in signal intensity. However, it is often difficult to discriminate whether the difference in signal intensity is due to a true difference in reflectivity or merely a result of declining signal strength, particularly with respect to the posterior border. In addition, there has been no histological proof that the border between high signal and low signal corresponds to the posterior laminar border. Thus, histologic confirmation is necessary to compare the ability of EDI OCT versus HP-OCT, in imaging deep ONH structures.
There was a regional difference in visibility, in both the EDI OCT and the HP-OCT images. The deep ONH structures were more clearly visualized in the vertical images than in the horizontal images. This difference can be attributed to the influence of disc tilting. In eyes with horizontally tilted discs, the peripheral deep ONH structures were not imaged, due to signal attenuation by the overlying retina and choroid. No eye in the study population had a vertically tilted disc. The deep parapapillary structures were most clearly visualized in the temporal quadrant, possibly because the overlying retina is thinnest there.
In this study, we compared EDI OCT with HP-OCT, using subjective grading systems. Objective assessments are often considered to be more precise than subjective judgments. However, there is no established method to objectively assess the visibility of either the deep ONH structures or the deep parapapillary structures. Signal strength or penetration depth can be used to objectively examine the performance of imaging instruments.Citation13 However, comparing the signal strength or penetration depth of EDI OCT with that of HP-OCT does not necessarily reflect the ability to visualize specific structures. Another potential weakness of this study is the possible difference in scan locations between instruments – although we used fundus photographs to place the scan position at the same location, we cannot exclude the possibility of a small difference in the scan location between the instruments. However, with regard to the structures for which the significant difference in visibility was observed between instruments, the difference between EDI OCT and HP-OCT was consistent across different scan locations (ie, horizontal vs vertical or among quadrants). This leads us to assume that a small difference in scan location is not likely to critically affect the results. Another limitation of our study was the “moderate” agreement among graders. However, the difference in visibility scores between the EDI OCT and HP-OCT was also consistent among the graders. Thus, we assume that this moderate agreement is not likely to have biased the comparison between the EDI OCT and HP-OCT in visualizing the deep ONH and parapapillary structures.
Conclusion
EDI OCT and HP-OCT are useful for visualizing the deep ONH and deep parapapillary structures. However, these instruments have distinctive imaging properties. Thus, combining the advantages of both instruments is the best approach. These techniques are potentially useful for diagnosing glaucoma and understanding previously unidentified pathogeneses of glaucoma.
Acknowledgments
The authors thank Dr Masahiro Akiba (Topcon Corp, Tokyo, Japan) for providing the prototype HP-OCT and for technical support.
Disclosure
Atsuya Miki is a consultant for NIDEK. Yasushi Ikuno and Kohji Nishida were provided research support from Tomey. The authors report no other conflicts of interest.
References
- GreenfieldDSOptic nerve and retinal nerve fiber layer analyzers in glaucomaCurr Opin Ophthalmol2002132687611880718
- SaviniGCarbonelliMBarboniPSpectral-domain optical coherence tomography for the diagnosis and follow-up of glaucomaCurr Opin Ophthalmol201122211512321307774
- MincklerDSBuntAHJohansonGWOrthograde and retrograde axoplasmic transport during acute ocular hypertension in the monkeyInvest Ophthalmol Vis Sci197716542644167096
- QuigleyHAAddicksEMGreenWRMaumeneeAEOptic nerve damage in human glaucoma. II. The site of injury and susceptibility to damageArch Ophthalmol19819946356496164357
- BellezzaAJRintalanCJThompsonHWDownsJCHartRTBurgoyneCFDeformation of the lamina cribrosa and anterior scleral canal wall in early experimental glaucomaInvest Ophthalmol Vis Sci200344262363712556392
- HayrehSSPosterior ciliary artery circulation in health and disease: the Weisenfeld lectureInvest Ophthalmol Vis Sci2004453749757 74814985286
- LeskeMCOcular perfusion pressure and glaucoma: clinical trial and epidemiologic findingsCurr Opin Ophthalmol2009202737819240538
- CaprioliJColemanALBlood Flow in Glaucoma DiscussionBlood pressure, perfusion pressure, and glaucomaAm J Ophthalmol2010149570471220399924
- GeitzenauerWHitzenbergerCKSchmidt-ErfurthUMRetinal optical coherence tomography: past, present and future perspectivesBr J Ophthalmol201195217117720675732
- SpaideRFKoizumiHPozzoniMCEnhanced depth imaging spectral-domain optical coherence tomographyAm J Ophthalmol2008146449650018639219
- YasunoYHongYMakitaSIn vivo high-contrast imaging of deep posterior eye by 1-microm swept source optical coherence tomography and scattering optical coherence angiographyOpt Express200715106121613919546917
- IkunoYKawaguchiKNouchiTYasunoYChoroidal thickness in healthy Japanese subjectsInvest Ophthalmol Vis Sci20105142173217619892874
- LeeEJKimTWWeinrebRNParkKHKimSHKimDMVisualization of the lamina cribrosa using enhanced depth imaging spectral-domain optical coherence tomographyAm J Ophthalmol2011152187.e195.e121570046
- ParkHYJeonSHParkCKEnhanced depth imaging detects lamina cribrosa thickness differences in normal tension glaucoma and primary open-angle glaucomaOphthalmology20121191102022015382
- ParkSCDe MoraesCGTengCCTelloCLiebmannJMRitchREnhanced depth imaging optical coherence tomography of deep optic nerve complex structures in glaucomaOphthalmology201211913921978593
- SrinivasanVJAdlerDCChenYUltrahigh-speed optical coherence tomography for three-dimensional and en face imaging of the retina and optic nerve headInvest Ophthalmol Vis Sci200849115103511018658089
- Ohno-MatsuiKAkibaMMoriyamaMIshibashiTTokoroTSpaideRFImaging retrobulbar subarachnoid space around optic nerve by swept-source optical coherence tomography in eyes with pathologic myopiaInvest Ophthalmol Vis Sci201152139644965022076987
- YangHQiJHardinCSpectral-domain optical coherence tomography enhanced depth imaging of the normal and glaucomatous nonhuman primate optic nerve headInvest Ophthalmol Vis Sci201253139440522159003
- InoueRHangaiMKoteraYThree-dimensional high-speed optical coherence tomography imaging of lamina cribrosa in glaucomaOphthalmology2009116221422219091413
- StrouthidisNGGrimmJWilliamsGACullGAWilsonDJBurgoyneCFA comparison of optic nerve head morphology viewed by spectral domain optical coherence tomography and by serial histologyInvest Ophthalmol Vis Sci20105131464147419875649
- LeeEJKimTWWeinrebRNThree-dimensional evaluation of the lamina cribrosa using spectral-domain optical coherence tomography in glaucomaInvest Ophthalmol Vis Sci201253119820422167102
- KiumehrSParkSCSyrilDIn vivo evaluation of focal lamina cribrosa defects in glaucomaArch Ophthalmol2012130555255922232364
- BurgoyneCFMorrisonJCThe anatomy and pathophysiology of the optic nerve head in glaucomaJ Glaucoma2001105 Suppl 1S16S1811890263
- SpaideRFAge-related choroidal atrophyAm J Ophthalmol2009147580181019232561
- RenRJonasJBTianGCerebrospinal fluid pressure in glaucoma: a prospective studyOphthalmology2010117225926619969367
- UsuiSIkunoYMikiAMatsushitaKYasunoYNishidaKEvaluation of the choroidal thickness using high-penetration optical coherence tomography with long wavelength in highly myopic normaltension glaucomaAm J Ophthalmol2012153110.e116.e121864827
- RobertsKFArtesPHO’LearyNPeripapillary choroidal thickness in healthy controls and patients with focal, diffuse, and sclerotic glaucomatous optic disc damageArch Ophthalmol2012130898098622491392