Abstract
Purpose
To assess the difference in retinal nerve fiber layer (RNFL) and optic disc algorithms between glaucomatous and normal Arab subjects using optical coherence tomography (OCT).
Methods
RNFL thickness and optic disc parameters were obtained in 65 patients aged 50.1 ± 7.7 years. Percentage differences in all parameters were calculated and analyzed between groups.
Results
The mean RNFL thickness around the disc and at all quadrants was significantly thinner in glaucomatous eyes than in normal eyes (P < 0.01). The greatest decrease in RNFL thickness was observed at the inferior (39.5%) and superior (39.3%) quadrants and at 1 o’clock (43%) and 5 o’clock (40%) hour sectors. Significant differences were observed between glaucomatous and control eyes in all disc parameters (P < 0.005) assessed. The disc area, cup area, mean cup/disc ratio, and vertical and horizontal cup/disc ratios were significantly larger (P < 0.01), whereas the vertical integrated rim area, horizontal integrated rim width, and rim area were significantly smaller (P < 0.001) in glaucomatous eyes than in normal eyes.
Conclusion
Stratus OCT is still a valuable tool in the diagnosis of early glaucoma changes and, as such, its use should be encouraged in glaucoma clinics in Saudi Arabia. The best OCT parameters for detecting early glaucoma change were RNFL thickness in the inferior, superior, and 1 o’clock hour sector; the cup area; and the vertical integrated rim area of the optic disc.
Introduction
Glaucoma is the second-leading cause of blindness worldwide, accounting for around 12.3% of total blinding casesCitation1 and estimated to affect about 66.8 million people.Citation2 Among the population aged 40 years and above, the prevalence could increase from 2.65% in 2010 to 2.86% in 2020.Citation3 In our region, glaucoma contributes to about 11% of total blinding causes, ranking as the second-biggest regional cause of blindness after cataract (49%),Citation4 and with fewer than 50% of the patients being aware of their disease, it is a worrying situation.Citation2,Citation3 In one study, it was reported that 44.5% of the glaucoma patients in the country had no prior knowledge of their condition, and 11.3% of them were bilaterally legally blind.Citation5 The global burden of glaucoma is heavy, and it is even heavier in Saudi Arabia because of the high rate of consanguinity and its contribution to eye anomalies.Citation1,Citation4–Citation6 The total blindness in around 4% of patients in the country is related to time and method of diagnosis.Citation7 Understanding the pattern and the associated characteristics of glaucoma is an essential and crucial step for early diagnosis and proper management of the disease.
Evaluation of the retinal nerve fiber layer (RNFL) and optic disc are fundamental for diagnosing and managing glaucoma. Evaluation of these areas is currently the standard procedure for detection of early glaucomatous retinal damage, as well as monitoring the progression of the disease.Citation8 However, with the high intra- and interobserver variability associated with the subjective technique, new imaging techniques have been introduced in the early detection, management, and monitoring of glaucomatous damage.Citation9
Optical coherence tomography (OCT) is one of the promising technologies capable of discriminating between glaucomatous and healthy eyes using various algorithms.Citation8–Citation15 Despite the recent introduction of spectral domain OCT, Stratus OCT 3000 (Carl Zeiss Meditec, Inc, Dublin, CA, USA) is one of the new generation of instruments with improved capabilities. The number of measurements per scan was increased up to 768 A-scans per image, and the axial resolution improved from 100 μ to 10 μ, in order to enhance the ease of use of the instrument. In addition, the Stratus OCT also incorporates 18 different protocols that are used for image acquisition, and an algorithm to assess the optic nerve head (ONH). It is also equipped with multiple RNFL and ONH asymmetry parameters that are used for detection of glaucoma.
Surprisingly, OCT is yet to find its place in the diagnosis and management of glaucoma in ophthalmology clinics in Saudi Arabia, despite its worldwide applications in this subset of patients. The study was therefore set out to assess the differences in both algorithm parameters of Stratus OCT in normal and glaucomatous eyes so as to evaluate their potential usefulness in identifying individuals with glaucoma in the region. The results will provide a baseline for comparison of the glaucomatous changes observed in other populations using both algorithms of the OCT with those observed in the Arab population.
Subjects and methods
This was a prospective controlled study conducted at the hospital of the King Saud University, Riyadh, Kingdom of Saudi Arabia. The university’s institutional research ethics review board approved the study, and all participants gave a written informed consent prior to enrolment. Eligible participants were randomly recruited from patients visiting the hospital for regular eye check or management of their ocular conditions. The study adhered to the tenets of the Declaration of Helsinki (1975) as revised in Edinburgh in 2000.
A total of 65 patients (36 glaucoma and 29 normal patients) aged 50.1 ± 7.7 years (range 40–67 years) met the following criteria: age ≥40 years, visual acuity ≥20/40, spherical refractive error between −6 and +6 diopters (D), astigmatism ≤3 D, an open angle, good-quality OCT images, and reliable visual field indices obtained from the Program 32 dynamic strategy (Octopus 101 automated perimeter, Haag-Streit AG, Koeniz, Switzerland). Visual field results needed to be reproducible in at least two consecutive examinations, with false-positive and false-catch trials under 15%. All images were taken by an experienced examiner. Normal eyes had a Goldmann applanation tonometer intraocular pressure (IOP) >8 mmHg but <18 mmHg measured on at least three different days before the time of OCT examination. Glaucoma patients had Goldmann applanation tonometer IOP >21 mmHg on at least three different occasions and a glaucomatous visual field (Program 32 dynamic test result showing a cluster of four or more contiguous points on the corrected comparison plot and a probability value of <5% confirmed on at least one visual field).
Patients were excluded if they had other intraocular or neurologic diseases that affected the RNFL, optic disc, or visual field; secondary causes of increased IOP; nonglaucomatous disc abnormalities; corneal opacities; advanced cataract; or a history of ophthalmic surgery. One eye of each patient was enrolled. If both eyes met the inclusion criteria, one eye was randomly selected.
Examination procedure
All patients underwent a complete ophthalmic examination, including medical and family history, visual acuity measurement, tonometry, slit-lamp examination of the anterior and posterior segments, and the Program 32 dynamic strategy.
The Stratus OCT was used for ocular imaging in subjects after dilation with one drop of tropicamide 1%. Cross-sectional images from the macula, ONH, and peripapillary regions were obtained in all patients on the same visit by one examiner, who was masked from other test results of the subjects.
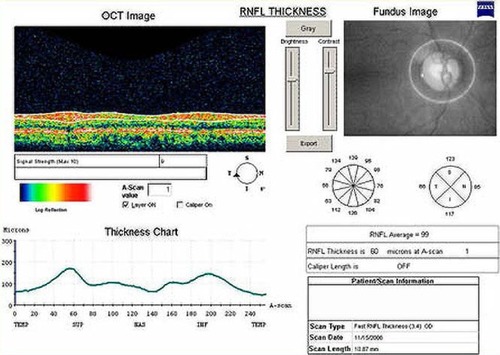
The RNFL thickness was obtained by the Stratus OCT using a near infrared low-coherence diode laser (840 nm) and a Michelson-type interferometer.Citation16,Citation17 Three images consisting of 256 A-scans along a 3.4 mm diameter circular ring around the optic disc were acquired over 1.92 seconds for each patient. A good-quality image was defined as one with generalized signal distribution, a reflectance signal from either RNFL or retinal pigment epithelium (RPE) strong enough to identify either layer, and no missing parts caused by eye movement. Left eye data were converted into right eye format, and all data were exported into a personal computer. Peripapillary RNFL thickness parameters were automatically calculated by the software, including average thickness (360°); temporal (316°–45°), superior (46°–135°), nasal (136°–225°), and inferior (226°–315°) quadrant thickness; and thickness in each one of the 12 clock hour (30°) segments, with the 3 o’clock, 6 o’clock, 9 o’clock, and 12 o’clock position indicating the nasal, inferior, temporal, and superior region, respectively, as shown in .
Figure 1 The retinal nerve fiber layer (RNFL) thickness analysis of a 48-year-old normal male from the Stratus optical coherence tomography (OCT). Video image of optic disc (top right), RNFL normative database map (middle right), and RNFL profile (top left). The Stratus OCT did not indicate an abnormal classification based on a normative database map (middle right versus down left).
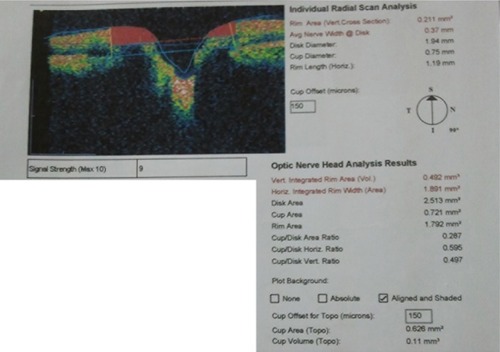
The fast optic disc algorithm performs six 4 mm radial linear scans in 1.92 seconds. For each scan, the A-scan detects the anterior surface of the RNFL and the RPE. Then, the disc margin is automatically identified in the Stratus OCT by detecting the top and inner edges of RPE on each side of the optic disc. A line is then joined and measured as the disc diameter. The reference plane (the cup offset) was then determined by tracing a line parallel to the disc diameter with an anterior offset of 150 μm. This is then used to calculate all the fast optic disc parameters. The region above the reference plane is defined as the rim and below as the cup (). There are two output displays, the individual radial scan analysis and the ONH analysis, as shown in . From both analyses the rim area, average nerve width at disc, disc diameter, cup diameter, rim length, vertical integrated rim area (VIRA), horizontal integrated rim width (HIRW), disc area, cup area, rim area, cup/disc (C/D) area ratio, horizontal C/D ratio, and vertical C/D ratio were calculated. To ensure the good quality of RNFL images, a minimum of five scans were taken and the best three were chosen for this study, excluding those scans with bad centering, artifacts, RNFL discontinuity, or RNFL misalignment. In all measurements, the internal fixation point was used. Disc images were included only when precise centering was present and after revision of the automatically placed disc limit positions. The disc margins were manually corrected by the operator when the automatically placed disc limit positions were not placed in direct contact with the edge of the RPE. Eyes in which the RPE border was not sufficiently precise were excluded from the study.
Figure 2 An example of the graphic output of the fast optic disc algorithm showing the optic cup area dimensions, optic disc, and neuroretinal rim. Five parameters are derived from this scan: rim area, average nerve width at disc, disc diameter, cup diameter, and rim length.
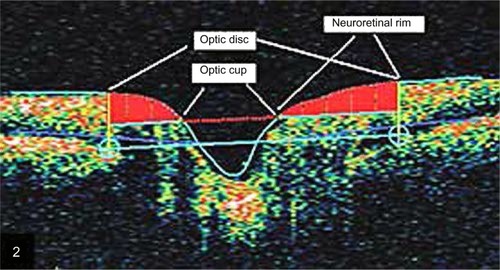
Figure 3 Orientation of the six linear scans of the individual radial scan analysis from the optic disc algorithm of Stratus optical coherence tomography.
Statistical analyses were performed using Graphpad Instat for Windows, version 3.00 (GraphPad Software, Inc, La Jolla, CA, USA). A value of P < 0.05 was considered statistically significant, and with 62 subjects the study had a power of 80%. The effect of age on the structural parameters was analyzed in both group eyes by using the Pearson–Spearman correlation test. Unpaired t-test and χ2 test were used for between-group comparison. A line graph of twelve 30° clock hour sector thicknesses in RNFL as a function of mean thicknesses (normal and glaucomatous eyes) was also plotted as well as the percentage difference ([glaucoma − control/normal] × 100%) in thickness between group eyes. Within each group, the mean RNFL thicknesses were also compared between quadrants using the Kruskal–Wallis test for nonparametric variables.
Results
The demographic data of all patients and the results of unpaired t-test comparison between-group demographics have been represented in . The mean ages of patients with glaucoma (51.9 ± 8.5 years), and normal patients (47.7 ± 6.0 years) were not statistically significantly different (P = 0.12), thereby controlling any age-related effects on analysis. Average spherical equivalent ± standard deviation (SD) refractive error was −0.3 ± 1.0 D for normal eyes, and −0.5 ± 1.9 D for glaucomatous eyes (P = 0.57). The average RNFL thickness was not statistically significantly associated with age of normal (R2 = 0.001, P = 0.86) and glaucomatous (R2 = 0.002, P = 0.79) patients. Also, the mean RNFL thicknesses measured at the four quadrants were not statistically significantly associated with age of both groups. The R2 values (P-values) for the mean RNFL thicknesses at the four quadrants in normal patients were temporal 0.10 (P = 0.09), nasal 0.07 (P = 0.16), superior 0.03 (P = 0.39), and inferior 0.02 (P = 0.44). None of the optic nerve parameters (the rim area, average nerve width at disc, disc diameter, cup diameter, rim length, VIRA, HIRW, disc area, cup area, C/D area ratio, horizontal C/D ratio, and vertical C/D ratio) was significantly associated with age of normal (R2 < 0.10, P > 0.05; for all) and glaucomatous (R2 < 0.14, P > 0.05; for all) patients.
Table 1 Demographic characteristics of the study sample (65 patients [36 glaucoma and 29 normal patients])
Intergroup comparison of fast RNFL algorithm
is the result of unpaired t-test analysis of inter-group differences in all measured parameters of the subjects examined. The percentage difference was also shown. The mean RNFL thickness, the RNFL thickness at all clock hour sectors (1–12 o’clock), and the RNFL thickness at all four quadrants were statistically significantly (P < 0.01) thinner in glaucomatous eyes than in normal eyes. The mean differences ± SD in RNFL thickness at the superior, inferior, temporal, and nasal quadrants were 49.4 ± 3.3 μm, 50.0 ± 10.5 μm, 23.3 ± 2.1 μm, and 26.6 ± 4.0 μm, respectively. The greatest percentage changes in RNFL thickness were observed at the inferior (39.5%) and superior (39.3%) quadrants. A plot of RNFL thickness variation across the twelve clock hour sector in both groups () showed that the greatest percentage reductions in RNFL thickness in the glaucomatous eyes in relation to the normal eyes occurred at the 1 o’clock (43%) and 5 o’clock (40%) sectors.
Figure 4 Mean retinal nerve fiber layer (RNFL) thickness measured at each clock hour sector in normal and glaucomatous eyes, and the percentage change that occurred in the glaucomatous eyes in relation to normal eyes. Differences in thickness were statistically significant at all clock hour sectors (P < 0.0001).
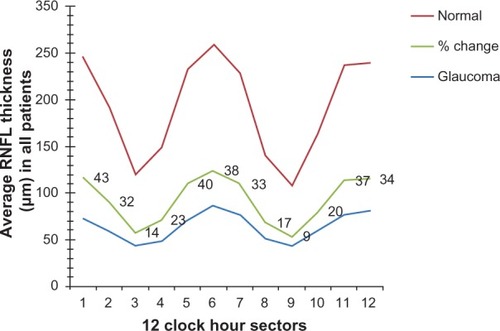
Table 2 Comparison of mean (±SD) values. Results of statistical analysis of fast RNFL thickness in microns and fast optic disc (mm2) algorithms of normal and glaucomatous eyes
Intergroup comparison of fast optic disc algorithm
The disc area, cup area, and mean C/D ratio were significantly (P < 0.01, for all) larger in glaucomatous eyes than in normal eyes (). The corresponding mean differences were 0.46 mm2, 1.51 mm2, and 0.45 mm2. In addition, the vertical and horizontal C/D ratios were also significantly greater in the glaucomatous eyes than in the normal eyes by an average of 0.34 (P < 0.0001). However, the VIRA, HIRW, and rim area were significantly (P < 0.001, for all) smaller in glaucomatous eyes than in normal eyes. The corresponding mean differences were 0.25 mm3, 0.64 mm2, and 1.04 mm2. The cup area and the VIRA showed the greatest percentage changes in the glaucomatous eyes from normal eyes (66.6% increase and 62.2% decrease, respectively) ().
Intragroup comparison of parameters
There were statistically significant differences in mean RNFL measured at all quadrants in the control (Kruskal-Wallis analysis of variance, P < 0.0001) and glaucomatous eyes (Kruskal-Wallis analysis of variance, P < 0.0001). The columns analyzed were columns of mean temporal versus nasal versus superior versus inferior RNFL in the normal eyes. Similar comparison was also performed for glaucomatous eyes. Further analysis on Dunn’s multiple comparison test showed that except for the quadrant comparisons between superior and inferior RNFL (P > 0.05) and temporal and nasal RNFL (P > 0.05), all other quadrant comparisons returned statistically significant differences at a level of P < 0.001 for the control eyes, and at a level of P < 0.01 for the glaucomatous eyes. Greater differences in RNFL thickness were observed when superior and inferior quadrants were compared with the temporal quadrant in the control eyes (57.9 μm and 56.8 μm; superior minus temporal, inferior minus temporal, respectively), and in the glaucomatous eyes (47.1 μm and 44.7 μm; superior minus temporal, inferior minus temporal, respectively).
Across the twelve 30° clock hours, the RNFL in normal eyes was thickest at 6 o’clock hour sectors and thinnest at 9 o’clock hour sectors. For the glaucoma eyes, it was the thickest at the 6 o’clock hour sector with 3 o’clock and 9 o’clock hour sectors being the thinnest ().
Discussion
OCT has been widely used to characterize multiple pathologic conditions and collect morphological information for clinical and surgical decision making.Citation13 Studies have reported the usefulness of OCT in diagnosing and managing glaucoma elsewhere in the world but not in Saudi Arabia.Citation10–Citation15,Citation18 RNFL thickness was reported to decrease significantly with age,Citation13,Citation18–Citation20 with an estimated loss of approximately 5,000 axons per year from birth to death reported in humans.Citation21 Using OCT, Girkin et alCitation19 also observed that age was associated with rim area, RNFL thickness, and inner retinal thickness. On the contrary, and similar to an observational, cross-sectional study conducted on 119 eyes of 60 normal Indian subjects,Citation22 the current study found that age was not predictive of RNFL measurements. It is important to note that the small number of subjects recruited in this study may have led to the non-significant association of the assessed parameters with age, so to detect such an association a larger population sample will be needed. On the other hand, by recruiting subjects of a very narrow age range (40–67 years), we have also indirectly controlled for any age-related effects on retinal measurements, which strengthens the findings of the current study.
In the current study, the average RNFL was thinner in glaucomatous eyes by about 36.7%. The percentage thinning of the RNFL was greater at 1 o’clock and 5 o’clock hour sectors, the inferior and superior quadrants (). These results are consistent with those of previous studiesCitation8–Citation10,Citation12,Citation22–Citation25 in which the RNFL thinning in the inferior quadrant had the best discriminating ability for detection of glaucoma. Medeiros et alCitation9 showed that the RNFL thickness of the Stratus OCT performed better than the ONH and macular parameters in discriminating eyes that progressed by visual fields and/or optic disc stereophotographs from eyes that did not. Nouri-Mahdavi et alCitation11 found the superior quadrant RNFL thickness at the 11 o’clock position to be the best parameter for detection of early glaucomatous change, whereas Kanamori et alCitation23 found the inferior quadrant and global RNFL thickness to be the best discriminating parameter. Similarly, in the current study, it was observed that the inferior quadrant and the 1 o’clock hour sector thickness of the RNFL algorithm showed the greatest changes in thickness in the early glaucomatous eyes. These changes in the inferior RNFL are in agreement with the expected pattern of damage in glaucomatous optic neuropathy.
Previous reports have found Stratus OCT fast optic disc algorithms to be reproducible,Citation26–Citation29 reasonably accurate,Citation30 and to perform well in discriminating eyes with glaucomatous visual field loss from healthy eyes. However, in one longitudinal study,Citation9 the fast optic disc parameters performed poorly in their ability to differentiate between progressing and nonprogressing glaucomatous eyes. Anton et alCitation13 and Zangwill et alCitation31 also found significant differences between normal eyes and ocular hypertensive eyes in optic disc parameters. The current study also observed significant differences in the optic disc parameters in glaucomatous eyes in relation to normal eyes. The disc area, cup area, and mean C/D ratio were significantly larger by 15.5%, 66.6%, and 60.4%, respectively, whereas the VIRA, HIRW, and rim area were significantly smaller by 62.2%, 37.0%, and 59.0% in the glaucomatous eyes, in relation to normal eyes. The current study also showed that except for the disc area, other ONH parameters performed well in differentiating early glaucomatous eyes from normal eyes. The findings are consistent with previous reportsCitation8,Citation12,Citation25 where the ONH parameters, except the disc area, have also performed equally well in identifying early glaucomatous eyes. Although the presence of peripapillary atrophy can cause the misidentification of the disc margin when using the automated ONH analysis of the fast optic disc algorithm,Citation30 this was manually corrected by locating the correct position of the RPE edge. As such, this had little or no influence on the results of the current study. The vertical elongation of the optic disc observed here is thought to be due to severance and depletion of the superior and inferior arcuate fibers, which occurs in early stages of glaucoma.Citation32
The results presented here also showed that both group eyes obeyed the ISNT rule (Inferior, Superior, Nasal, Temporal) in a similar pattern in relation to RNFL thickness. In both groups, significant differences in quadrant RNFL thickness were observed, with the thickest and thinnest RNFL quadrants being the inferior and temporal quadrants, respectively. It also confirms that the severance of the nerve fibers and excavation of the disc are unique features of glaucoma.Citation32
The findings of the current study are limited to patients with early glaucoma and, as such, cannot be applied to ocular hypertensive patients and/or patients with a more advanced glaucoma. Also, the ages of our subjects were much younger than is generally anticipated for glaucoma. Despite the control of age-related effects in this study, the results that no significant relationship exists between age and retinal measurements should be interpreted with caution, as a relatively small sample size was recruited in this study. However, the study presents for the first time the diagnostic importance of the device in discriminating between glaucomatous damage and normal subjects of Saudi Arabian origin. A future study in the region should consider recruiting a larger number of subjects of a wider age range as well, in order to investigate the discriminating ability of both algorithms and the effects of age of retinal measurements.
It is important to note that because the calculation of the ONH parameters was estimated based on six linear scans cutting cross-sectionally over the optic disc, disc areas lying between the scan lines were not subject to the analysis. As a result, the sensitivity in detecting a highly localized optic disc abnormality may be reduced in the OCT. Second, with the current version of the analysis software, it is not yet possible to get individual clock hour ONH measurements. On the other hand, comparing the performance of Stratus and its latest version (Cirrus OCT) revealed that the two devices have similar diagnostic potentials in preperimetric glaucoma.Citation33 The studyCitation33 also noted that in a subset of patients a total of 16 RNFL defects that were not seen in the RNFL photography of the Stratus OCT were detected in the Cirrus OCT deviation-from-normal maps. It was not clear whether these defects were false-positive findings or whether they represent true RNFL losses. Though the true nature of these OCT defects may be confirmed by a follow-up assessment, the performance of OCT in such cases should be re-evaluated through a prospective longitudinal study. Thus, if a definite glaucomatous change occurs in the case in which OCT had previously detected an abnormality, OCT may predict the future development of glaucoma in these questionable cases.
Conclusion
Both algorithms were capable of differentiating early glaucomatous eyes from normal eyes, with the best parameters being the RNFL algorithm in the inferior, superior, and 1 o’clock hour sector; the cup area; and VIRA (optic disc algorithm). A combination of the results from both algorithms of a patient will lead to a better diagnostic precision. The use of this device or its newer generation should be encouraged in glaucoma clinics in Saudi Arabia.
Acknowledgments
The authors acknowledge the assistance rendered by Ebtesam H AlQhtany during data collection, and Dr Uchegbu O Frank during graphical analysis.
Disclosure
This research received no specific grant from any funding agency in the public, commercial, or profit sectors. Authors have no conflicts of interest to declare in this work.
References
- ResnikoffSPascoliniDEtya’aleDGlobal data on visual impairment in the year 2002Bull World Health Organ2004821184485115640920
- QuigleyHANumber of people with glaucoma worldwideBr J Ophthalmol1996803893938695555
- QuigleyHABromanATThe number of people with glaucoma worldwide in 2010 and 2020Br J Ophthalmol200690326226716488940
- TabbaraKFRoss-DegnanDBlindness in Saudi ArabiaJAMA198625524337833843712697
- EidTMEl-HawaryIEl-MenawyWPrevalence of glaucoma types and legal blindness from glaucoma in Western region of Saudi ArabiaInt Ophthalmol200929647748318853106
- KongXChenYChenXSunXInfluence of family history as a risk factor on primary angle closure and primary open angle glaucoma in a Chinese populationOphthalmic Epidemiol201118522623221961512
- TabbaraKBlindness in the eastern Mediterranean countriesBr J Ophthalmol200185777177511423445
- ManassakornANouri-MahdaviKCaprioliJComparison of retinal nerve fiber layer thickness and optic disk algorithms with optical coherence tomography to detect glaucomaAm J Ophthalmol2006141110511516386983
- MedeirosFAZangwillLMAlencarLMDetection of glaucoma progression with Stratus OCT retinal nerve fiber layer, optic nerve head, and macular thickness measurementsInvest Ophthalmol Vis Sci200950125741574819815731
- ZangwillLMBowdCBerryCCDiscriminating between normal and glaucomatous eyes using the Heidelberg Retina Tomograph, GDx Nerve Fiber Analyzer, and Optical Coherence TomographArch Ophthalmol2001119798599311448320
- Nouri-MahdaviKHoffmanDTannenbaumDPLawSKCaprioliJIdentifying early glaucoma with optical coherence tomographyAm J Ophthalmol2004137222823514962410
- WollsteinGIshikawaHWangJBeatonSASchumanJSComparison of three optical coherence tomography scanning areas for detection of glaucomatous damageAm J Ophthalmol20051391394315652826
- AntonAMoreno-MontañesJBlázquezFAlvarezAMartínBMolinaBUsefulness of optical coherence tomography parameters of the optic disc and the retinal nerve fiber layer to differentiate glaucomatous, ocular hypertensive, and normal eyesJ Glaucoma20071611817224742
- SungKRKimJSWollsteinGFolioLKookMSSchumanJSImaging of the retinal nerve fiber layer with spectral domain optical coherence tomography for glaucoma diagnosisBr J Ophthalmol201195790991421030413
- NaJHSungKRLeeJRDetection of glaucomatous progression by spectral-domain optical coherence tomographyOphthalmology201312071388139523474248
- FercherAFHitzenbergerCKDrexlerWKampGSattmannHIn vivo optical coherence tomographyAm J Ophthalmol199311611131148328536
- SwansonEAIzattJAHeeMRIn vivo retinal imaging by optical coherence tomographyOpt Lett199318211864186619829430
- LeeJYHwangYHLeeSMKimYYAge and retinal nerve fiber layer thickness measured by spectral domain optical coherence tomographyKorean J Ophthalmol201226316316822670071
- GirkinCAMcGwinGJrSinaiMJVariation in optic nerve and macular structure with age and race with spectral-domain optical coherence tomographyOphthalmology2011118122403240821907415
- CheungCYChenDWongTYDeterminants of quantitative optic nerve measurements using spectral domain optical coherence tomography in a population-based sample of non-glaucomatous subjectsInvest Ophthalmol Vis Sci201152139629963522039236
- BudenzDLAndersonDRVarmaRDeterminants of normal retinal nerve fiber layer thickness measured by Stratus OCTOphthalmology200711461046105217210181
- RaoHLKumarAUBabuJGKumarASenthilSGarudadriCSPredictors of normal optic nerve head, retinal nerve fiber layer, and macular parameters measured by spectral domain optical coherence tomographyInvest Ophthalmol Vis Sci20115221103111021087966
- KanamoriANakamuraMEscanoMFSeyaRMaedaHNegiAEvaluation of the glaucomatous damage on retinal nerve fiber layer thickness measured by optical coherence tomographyAm J Ophthalmol2003135451352012654369
- WollsteinGSchumanJSPriceLLOptical coherence tomography (OCT) macular and peripapillary retinal nerve fiber layer measurements and automated visual fieldsAm J Ophthalmol2004138221822515289130
- MedeirosFAZangwillLMBowdCVessaniRMSusannaRJrWeinrebRNEvaluation of retinal nerve fiber layer, optic nerve head, and macular thickness measurements for glaucoma detection using optical coherence tomographyAm J Ophthalmol20051391445515652827
- BudenzDLMichaelAChangRTMcSoleyJKatzJSensitivity and specificity of the StratusOCT for perimetric glaucomaOphthalmology200511213915629813
- SommerAKatzJQuigleyHAClinically detectable nerve fiber atrophy precedes the onset of glaucomatous field lossArch Ophthalmol1991109177831987954
- KassMAHeuerDKHigginbothamEJThe Ocular Hypertension Treatment Study: a randomized trial determines that topical ocular hypotensive medication delays or prevents the onset of primary open-angle glaucomaArch Ophthalmol2002120670171312049574
- LeungCKCheungCYLinDPangCPLamDSWeinrebRNLongitudinal variability of optic disc and retinal nerve fiber layer measurementsInvest Ophthalmol Vis Sci200849114886489218539940
- LaiEWollsteinGPriceLLOptical coherence tomography disc assessment in optic nerves with peripapillary atrophyOphthalmic Surg Lasers Imaging200334649850414620759
- ZangwillLMvan HornSde Souza LimaMSamplePAWeinrebRNOptic nerve head topography in ocular hypertensive eyes using confocal scanning laser ophthalmoscopyAm J Ophthalmol199612245205258862049
- HasnainSSScleral edge, not optic disc or retina, is the primary site of injury in chronic glaucomaMed Hypotheses20066761320132516824694
- JeoungJWParkKHComparison of Cirrus OCT and Stratus OCT on the ability to detect localized retinal nerve fiber layer defects in preperimetric glaucomaInvest Ophthalmol Vis Sci201051293894519797208