Abstract
Optical coherence tomography (OCT) is now a standard of care in ophthalmology and is considered essential for the diagnosis and monitoring of many retinal diseases. One of the major advances obtained with OCT was the understanding of the pathophysiology of macular holes. Non-full-thickness macular holes have been revisited because high-resolution OCT images can detect a lamellar macular defect that is not always visible clinically, and surgery has been advocated by some authors. OCT can be valuable in determining the need for and/or timing of surgical intervention on epiretinal membranes or vitreomacular traction syndrome. In addition, we can use this technology as a predictive factor in the prognosis and follow-up of the most common posterior pole pathologies.
Introduction
Optical coherence tomography (OCT) is a very useful imaging technology in general medicine because it performs a real-time “optical biopsy.”Citation1,Citation2 Therefore, this diagnostic tool allows the identification of morphologic details that previously could be visualized only through histopathologic analysis. In ophthalmology, OCT has become an essential tool because it can identify early stages of disease before symptoms and irreversible vision loss occurs. OCT is a rapid, noncontact, and noninvasive examination method of imaging intraocular tissue that has significantly improved the potential for early diagnosis, understanding of retinal disease pathogenesis, and monitoring of disease progression and response to therapy.
In recent years, OCT techniques have evolved from the initial time-domain OCT method with an axial resolution of 15 μm and a scanning speed of 400 A scans per second to spectral domain OCT (SD-OCT), which features a higher speed and improved resolution, presenting an axial resolution of 5 μm and a scanning speed of up to 50,000 A scans per second in commercially available systems. Most importantly, these advanced OCT systems are based on a raster scanning method and provide a three-dimensional (3D) reconstruction of the entire macular region.Citation3–Citation5
Until the advent of OCT, available techniques for ocular imaging did not have sufficient depth resolution in the posterior segment of the eye to provide useful cross-sectional images of retinal structure.Citation6–Citation8 This imaging technology was demonstrated in 1991 by Huang et al.Citation6 OCT has had the most clinical impact in ophthalmology, where it provides structural and quantitative information that cannot be obtained by any other modality. The development of OCT in ophthalmology proceeded rapidly. The first in vivo retinal images were obtained independently in 1993 by Fercher et alCitation8 and Swanson et al,Citation9 and the first commercial device for use in posterior segment structures became available in 1995 (OCT 1; Humphrey Instruments, Dublin, CA, USA). The technology was transferred to industry and introduced commercially for ophthalmic diagnostics in 1996 (Carl Zeiss Meditec, Jena, Germany). A third-generation ophthalmic instrument (Stratus OCT; Carl Zeiss Meditec) was introduced in 2001. To improve image resolution and scanning speed, a high-definition and SD-OCT system (Cirrus, Carl Zeiss Meditec) was developed in 2006, and it is now a natural successor of Stratus OCT, allowing for even higher resolution at simultaneously increased scanning speed. Today, there are several options on the market for SD-OCT.
With an axial resolution of between 5 μm and 10 μm, according to the equipment used, SD-OCT provides the best visualization of retinal architecture of any imaging technique currently available.Citation6,Citation10 The unprecedented speed and resolution of OCT technology has allowed ultramicroscopic structural evaluation of the posterior pole of the eye at an extremely fine spatial scale. Currently in retinal diagnosis, decisions for surgical interventions are based to a high degree on this imaging technology. In addition, as an OCT examination is standardized and easy to perform, it can easily be delegated to specially trained technicians and introduced as a routine procedure. Consequently, the increased use of OCT has dramatically affected diagnostic and therapeutic approaches in recent years.Citation11–Citation13 OCT is now a standard of care in ophthalmology and is considered essential in the diagnosis and monitoring of many retinal diseases; it is also a useful tool when making decisions regarding surgical intervention.
The objective of this article is to review the basic principles, interpretation, and clinical applications of OCT in vitreoretinal interface disorders of the posterior pole.
Basic principles
OCT imaging is analogous to ultrasound imaging, except that it uses infrared light reflections rather than acoustic waves. Cross-sectional images are generated by scanning an optical beam across the tissue and measuring the echo time delay and intensity of backscattered light. OCT is based on an optical measurement technique known as low coherence interferometry, which can be used to measure distances to objects (ocular structures) with high precision by measuring the light reflected from them. The low coherence light used is produced by a superluminescent diode that is directly coupled into an optical fiber of Michelson’s interferometer. The fiber-optic implementation provides a compact and robust system that can be interfaced to a variety of clinical imaging instruments. Two hundred microwatts of infrared light at 820 nm are emitted on the retina, which is consistent with the American National Standards Institute Classification System,Citation14 for intrabeam viewing. The interferometer divides the light source into a measurement light path and a reference light path. The light beam is launched into the eye, and backscattered or backreflected light gives information about the distance and thickness of the different retinal microstructures.
The coherence length of the light source determines the axial resolution of the OCT; systems used in experimental research can achieve resolutions from 10–15 μm to 1–5 μm.Citation15 Ultrahigh resolutions of 3 μm have been achieved in ophthalmic imaging, enabling visualization of internal retinal architectural morphology and promising to improve the accuracy and reproducibility of retinal morphometry.Citation16,Citation17
A high-power objective lens (+78 diopters) is used so that the retina is imaged onto an image plane inside the instrument. OCT bidimensional B-scan images are constructed by performing rapid, successive axial measurements at different transverse points similar to B-scan ultrasound imaging. The conventional time domain (Stratus OCT) has an axial scan repetition rate of approximately 400 (128 to 768) axial scans per 2.5 seconds (1 second in the commercial unit). SD-OCT technology provides an axial resolution of 5 μm and a scanning speed of up to 50,000 A-scans per second. Others advantages of SD-OCT are improved image quality, improved coverage of the retina, registration of OCT findings to fundus features, longitudinal tracking of pathology, and 3-D imaging.
OCT is well tolerated because it is a noninvasive procedure, and images can be acquired rapidly without eye contact and at low light intensity. The position of each scan is registered by the computer to allow future OCT examinations to be performed on the same exact location. The final OCT image is displayed using a false color map that corresponds to detected backscattered light levels from the incident light. The high reflectivity signals are represented by white and red colors, while the low reflectivity signals are represented by black and blue colors. The scattering from cataracts, vitreous hemorrhage, and corneal edema produce a reduction in image intensity; however, it does not degrade image quality except in cases of severe opacity.
Ophthalmic applications in the posterior pole
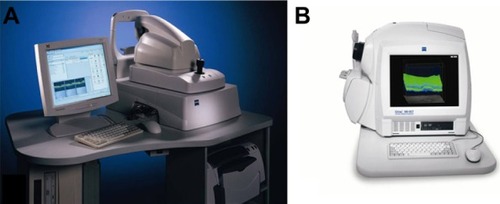
OCT is especially convenient in ophthalmology, due to the optic eye properties and easy accessibility of the retina for the exam. The OCT system hardware consists of the patient module and the computer unit (). The patient module sends the OCT scan to the retinal area of interest, and the video monitor receives and analyzes the OCT image. OCT has characterized a wide variety of retinal diseases, and the OCT images correspond with the retinal morphology of these illnesses viewed by light microscopy.Citation18,Citation19 OCT provides a powerful adjunct to conventional fundus and fluorescein angiography that can function not only as a sensitive disease diagnostic test, but also can be used to track disease progression and monitor treatment.
Figure 1 OCT device.
Abbreviation: OCT, optical coherence tomography.
Interpretation
OCT is an imaging method for high resolution, cross-sectional visualization of tissue. Therefore, OCT interpretation requires appropriate knowledge of the normal anatomy of the eye fundus. OCT allows carrying out an “optic biopsy” because it delineates the layers of the retina ().
Figure 2 OCT shows a normal eye.
Abbreviations: ELM, external limiting membrane; GCL, ganglion cell layer; ILM/NFL, internal limiting membrane/nerve fiber layer; INL, inner nuclear layer; IPL, inner plexiform layer; OPL, outer plexiform layer of Henle; IS PR, inner segments of photoreceptors (hyoid and ellipsoid segments); OCT, optical coherence tomography; ONL, outer nuclear layer; OS PR, photoreceptor’s outer segments; RPE/choriocapillaris, retinal pigment epithelium and choriocapillaris complex.
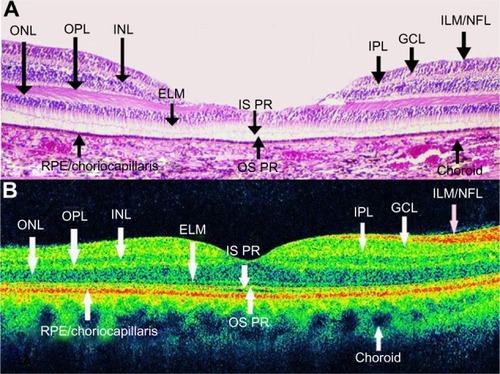
A highly scattering layer (70 μm in thickness), which is visible as red, delineates the posterior boundary of the retina in the tomogram and corresponds to the retinal pigment epithelium (RPE) and choriocapillaris complex.Citation10 The nerve fiber layer appears as a highly backscattering red layer at the vitreoretinal interface. The RPE and nerve fiber layer define the posterior and anterior boundaries of the sensory retina, respectively; these boundaries are important in quantifying neurosensorial retinal thickness on OCT.Citation20 Retinal areas of relative low reflection correspond to the location of the nuclear layers. The vitreoretinal interface can be seen in OCT images as a high-contrast boundary between the vitreous and retina. The normal vitreous gel is optically transparent, and therefore not visible in OCT imaging. The choroid and RPE together match to a wide band of retinal high reflection that decreases at greater choroidal and scleral depth.
OCT images demonstrate reproducible patterns of retinal morphology that correspond to the location of retinal layers seen on light microscopy.Citation21 Layers of relative high reflectivity correspond to horizontally aligned retinal components such as the nerve fiber layer and plexiform layers as well as to the RPE and choroid. In contrast, the nuclear layers demonstrate relative low reflectivity. In the fovea, there is a convergence of relative low reflection layers, with only a single outer band of relative low reflection present in the center of the fovea ().
Figure 3 Optical coherence tomography image shows a normal foveal contour.
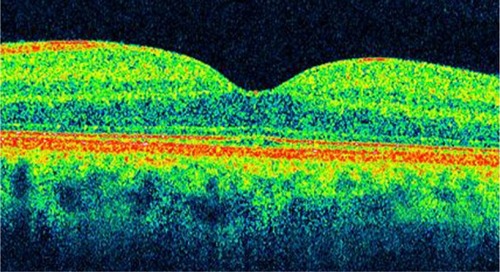
Foveal thickness has been calculated to be 147 ± 17 μm in normal eyes with time-domain OCT.Citation22 However, Han and JaffeCitation23 compared retinal thickness measurements obtained by SD-OCT and time-domain OCT in eyes with and without posterior segment disease diagnoses. They obtained a foveal thickness of 206 ± 25 μm, 259 ± 19 μm, and 279 ± 21 μm in normal eyes with Stratus OCT, Cirrus SD-OCT, and Spectralis (Heidelberg Engineering, Heidelberg, Germany) OCT, respectively.
The discrepancy among the three devices in terms of macular thickness values reflects differences in defining retinal segmentation algorithms. While Stratus OCT measures the thickness of the retina as the distance between the inner limiting membrane (ILM) and the junction of the outer segment and inner segment of the photoreceptors, Cirrus SD-OCT reports it as the distance from the anterior border of the retinal pigment epithelium to the ILMCitation24 and Spectralis OCT measures the distance from the posterior border of the RPE to the ILM. Therefore, the macular measurements are larger on Spectralis OCT compared to Cirrus SD-OCT and Stratus OCT. The mean difference between macular thickness measurements obtained by the Cirrus SD OCT and Stratus OCT in nine different subfields was close to 50 μm in most of the subfields, which is the length of the outer segment of human photoreceptors.Citation24,Citation25
Clinical applications of OCT in the posterior pole
Vitreoretinal interface disorders
Macular hole
Idiopathic macular hole is a retinal disease characterized by a full-thickness defect of the foveal area with associated visual acuity reduction, metamorphopsia, and a central scotoma. OCT has improved the understanding and management of idiopathic macular hole. Its incidence is around three in 1,000, and it is more common in females between 50 and 60 years of age.Citation26 The pathophysiology of the development of idiopathic macular hole has been extensively studied.Citation27–Citation29 In the 1970s, recent posterior vitreous detachment was usually noted in eyes with macular holes, while eyes with pre-existing vitreous detachment very rarely developed a macular hole. This observation led to the conclusion that vitreous traction plays an important role in macular hole formation.Citation30 In 1983, Avila et al suggested that the main cause of macular hole formation was anteroposterior traction exerted by vitreous fibers on the center of the fovea.Citation31 In 1988, GassCitation27 introduced the concept of tangential traction of the vitreous cortex at the foveolar edges as the etiology of macular holes. Immediately, foveal dehiscence was followed by centripetal retraction of retinal elements.Citation27 The posterior hyaloid face of the vitreous remained attached to the foveola and surrounding macular region at the initial stages of hole formation.Citation32 In 1995, the same author suggested that most full-thickness macular holes arise from an umbo dehiscence without loss of foveal tissue.Citation33
Although slit lamp observations and photographic documentation were provided, adequate imaging of the posterior hyaloid detachment and retinal layers was impossible before the OCT era. With the help of the OCT, other investigators have proposed that the hole formation involves vitreoretinal separation with vitreofoveal adhesion exerting oblique traction on the fovea, followed by foveal cysts or foveal detachment, foveal dehiscence, and finally full-thickness hole formation.Citation27,Citation28
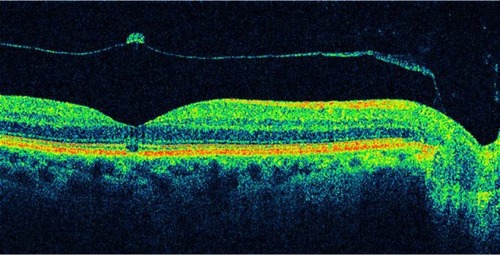
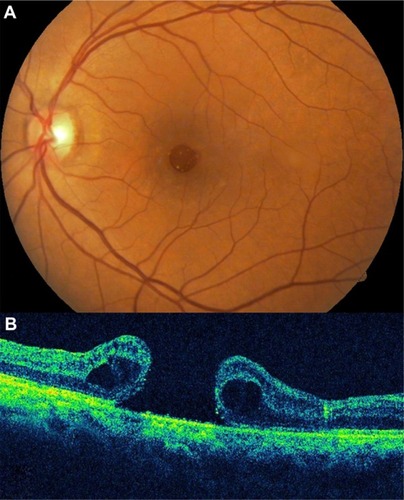
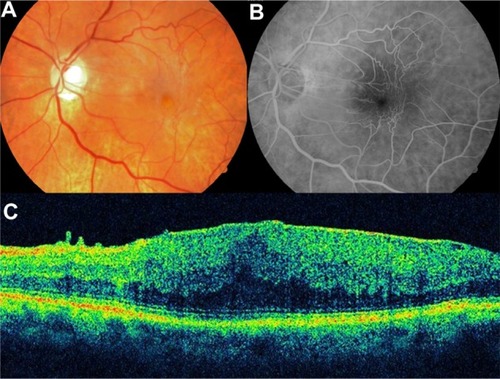
OCT staging with some modification can parallel the staging of macular holes with biomicroscopic examination. OCT has demonstrated changes in the vitreomacular interface not visible with biomicroscopy (). It is now widely accepted that the early event leading to macular holes is the persistent adherence of the cortical vitreous to the fovea with adjacent vitreoretinal separation. The resultant traction on the fovea causes foveal detachment or an intraretinal space, termed pseudocyst. Further traction leads to dehiscence of foveal tissue, resulting in full-thickness macular hole formation.Citation34,Citation35
Figure 4 Optical coherence tomography has demonstrated changes in the vitreomacular interface not visible with biomicroscopy.
Classification of idiopathic macular holes as proposed by GassCitation27,Citation29 has always been the standard in staging macular holes. However, sometimes the determination of the developmental stage of macular holes was difficult to assess clinically. Since the introduction of the OCT, staging of macular holes has changed, especially with respect to the early stages.
Gass classificationCitation27,Citation29 indicates that Stage 1 holes (foveal detachment) may be distinguished by a reduced or absent foveal pit and the presence of an optically clear space beneath the fovea, suggesting a foveolar detachment. There is vitreomacular traction due to posterior incomplete vitreous detachment lifting the foveal area and the formation of an impending macular hole. This clinically appears as a yellowish spot on the fovea. Depending on how soon the patient is examined after the onset of symptoms and the degree of elevation of the retina, either a yellow spot 100–200 μm in diameter (Stage 1A) or a yellow ring approximately 200–350 μm in diameter (Stage 1B) is present in the foveolar area. As the foveolar retinal detachment (Stage 1A) progresses to foveal retinal detachment (Stage 1B), the progressive stretching and thinning of the foveolar center may cause the redistribution of the xanthophyll pigment into a ring configuration.
Stage 2 holes are those in the early hole formation stage. In the majority of patients, the yellow ring enlarges and a full-thickness retinal dehiscence will develop within several weeks or months. This stage shows a partial break on the surface of the retina while the operculum is still attached to the retina, or separated from the underlying retina with a small full-thickness loss of retinal tissue of less than 400 μm in size.
Stage 3 holes have a full-thickness retinal dehiscence with a complete break in the outer retinal tissue, and variable amounts of surrounding macular edema that increase retinal thickness and decrease reflectivity in the outer retinal layers. In this stage, there is complete separation of the operculum from the underlying retina, with a hole diameter greater than 400 μm.
Stage 4 holes may be characterized by the complete loss of tissue greater than 400 μm in size and a complete posterior vitreous detachment with release of the anteroposterior tractional forces.
Stage 1 and 2 macular holes are very difficult to differentiate ophthalmoscopically, and high-resolution OCT images can help to classify them, Stage 2 often progresses to Stage 3 with some visual loss; appropriate staging with OCT can help to determine when surgery is indicated.Citation36
Vitreoretinal traction is very important in the pathogenesis of macular holes, and it can be identified by OCT.Citation37 Duker et alCitation38 found vitreoretinal interface abnormalities with OCT in 21% of fellow eyes. Furthermore, OCT may be a useful method of assessing the risk for hole formation in the fellow eye of patients with a unilateral macular hole. Considering that the probability of developing a macular hole in the contralateral eye is 13% in 48 months,Citation39 it is then mandatory to perform bilateral tomographic imaging in patients affected by this pathology for early detection in the other eye. However, surgery in the normal contralateral eye of patients with macular holes is not acceptable.
OCT is effective in staging macular holes, and quantitative information may be directly extracted from the OCT tomograms, including the status of the vitreoretinal interface, the diameter of the hole, and the extent of surrounding subretinal fluid accumulation.Citation4,Citation37 OCT is useful in differentiating simulating lesions and in allowing better counseling of patients regarding their disorder.
In addition, accurate assessment of macular hole size is important for both research studies and to guide clinical management. The size of a macular hole has been shown to affect anatomical and visual success. Macular hole size and postoperative resolution can be evaluated by OCT.Citation40–Citation42
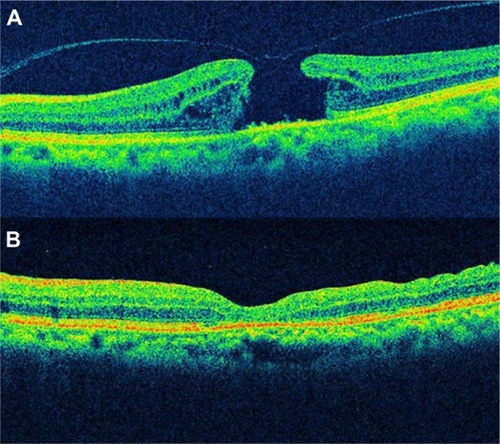
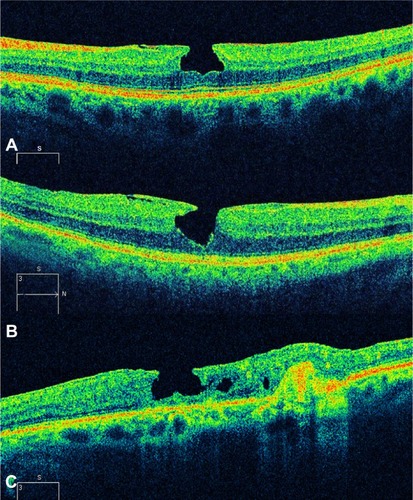
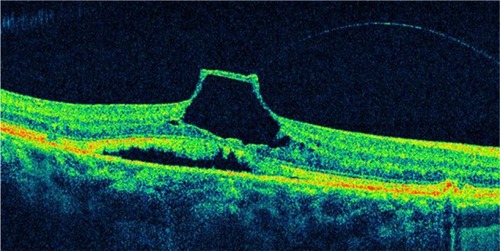
Altaweel et alCitation40 published the latest staging of idiopathic macular holes based on OCT findings. In Stage 1A, OCT demonstrates perifoveal posterior vitreous detachment with continued foveolar adherence. Tractional forces are anteroposterior and tangential. Retinal tissue remains at the base of the pseudocyst. Pseudocysts form (hyporeflective image on OCT) without affecting all retinal layers and with an intact outer retina. In Stage 1B, the foveal pseudocyst affects all retinal layers, including the photoreceptor layer, with an intact roof. There is incomplete posterior vitreous detachment with persistent adhesion onto the fovea in Stages 1A and B (). In Stage 2A, the roof of the pseudocyst has been torn open and continues to have traction exerted by the vitreous attachment. There is persistent traction of the posterior hyaloid that is firmly attached to the inner retina. The break in the roof of the pseudocyst gives rise to a full-thickness macular hole. In Stage 2B, the roof of the pseudocyst has completely separated from the retina. At this point, there is release of the anteroposterior tractional forces. The distance between the edges of the hole is less than 400 μm. In Stage 3, the prefoveal operculum can still be appreciated, but the distance between the hole edges is greater than 400 μm. The posterior hyaloid is completely detached from the inner retina, as opposed to the description by GassCitation27 wherein the former remains attached to the perifoveal area. In Stage 4, there exists complete vitreous detachment which cannot be seen tomographically and can only be confirmed by slit lamp biomicroscopy or ultrasonography (–).
Figure 5 Full-thickness macular hole classification.
Abbreviation: OCT, optical coherence tomography.
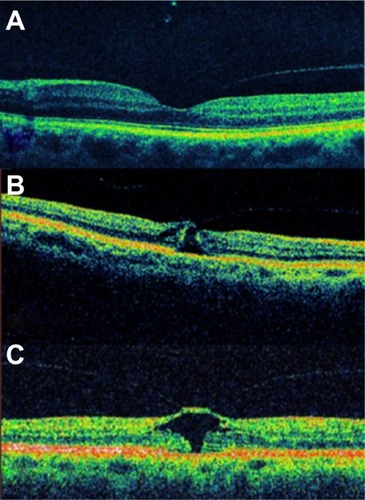
Figure 6 Full-thickness macular hole classification.
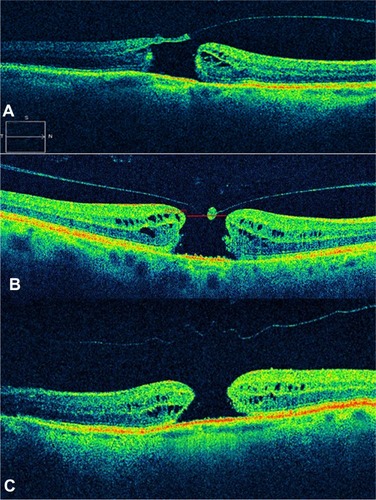
Figure 7 Sequential foveal tomographic images by time-domain optical coherence tomography.
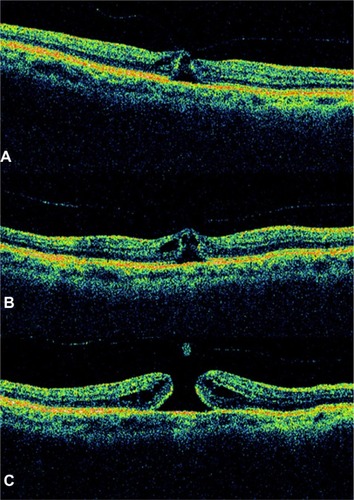
Figure 8 Optical coherence tomography image showed a full-thickness macular hole with complete vitreous detachment.
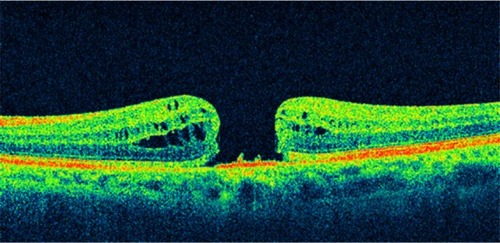
Figure 9 A case of a Stage 4 macular hole.
The main differences between the biomicroscopic and the OCT staging of idiopathic macular holes are: the presence of a tight focal foveolar adherence of the posterior hyaloid versus a perifoveal vitreomacular detachment; the formation of a foveal pseudocyst versus a detachment in Gass’ Stage 1 hole; and the subdivision of Stage 2 into two distinct anatomical types ().
Table 1 Main differences between the biomicroscopic and the OCT staging of idiopathic macular holes
In those cases with a base diameter less than 400 μm as measured by OCT, an anatomic closure was achieved in 92%; in those with a base diameter more than 400 μm, this value decreased to 56%.Citation19 Variables such as preoperative visual acuity, symptoms duration, hole diameter by OCT (as a single variable), and stereoscopic fundoscopy may predict the final visual outcome.Citation41,Citation42 One study demonstrated that OCT measurement is not only predictive of the possibility for anatomic closure but also of postoperative visual acuity outcome. By using the maximum hole diameter, minimum hole diameter, and height as reference values, the authors use a formula to infer macular hole prognosis.Citation42
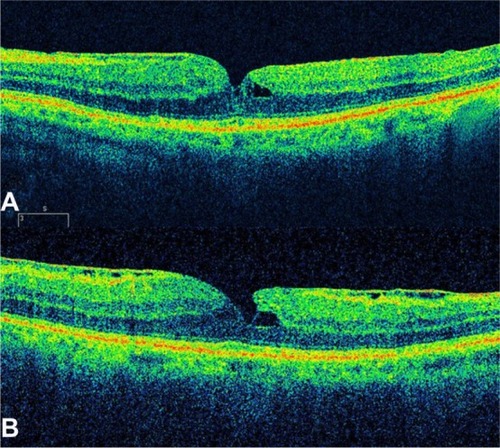
OCT is likewise useful in evaluating anatomic closure after macular hole surgery (). The flattening of the retina and the disappearance of the retinal cysts may be appreciated postoperatively. The closure of the horizontal component of a hole wherein there is complete detachment usually takes place in the first postoperative days. Absence of closure within the first postoperative month entails poor prognosis.Citation33 In the normal course of an idiopathic macular hole, about 2% may close by itself spontaneously when there is release of vitreomacular traction. In such cases, the photoreceptors may be affected due to the previously existing traction, and as a result may give rise to an absolute central scotoma.
Figure 10 Spectral domain optical coherence tomographic images of a 68-year-old patient with a full-thickness macular hole.
Non-full-thickness macular holes
The description and pathogenesis of non-full-thickness macular holes have been better understood with the advent of OCT. Lamellar macular hole (LMH) and macular pseudohole can be a different clinical manifestation of the same disease.
LMH was first described by GassCitation43 in 1975 as an abortive process of full-thickness macular hole formation resulting from deroofing of cystoid macular edema. Instead, macular pseudohole was described as being caused by centripetal contraction of previously present epiretinal membrane, which surrounds but does not cover the foveal area.Citation44 However, it is possible that the coexistence and possible evolution from a macular pseudohole to lamellar macular hole follows progressive ERM contraction.Citation45
Since the development of OCT, interest in diagnosis of LMH has been renewed because high-resolution images can detect a lamellar macular defect that is not always visible clinically.Citation30,Citation46 Data based on OCT proved that only 28% to 37% of LMHs are correctly diagnosed by biomicroscopy.Citation46,Citation47 OCT enables clearly the differentiation between macular pseudoholes and LMHs.Citation46
LMH has been described by OCT as a non-full-thickness defect of the macula with an irregular foveal contour and a dehiscence in the inner fovea, separation of the inner from the outer retinal layers, and absence of a full-thickness foveal defect with intact outer retinal layers at the base of the holeCitation47 ( and ).
Figure 11 Spectral domain optical coherence tomography images of a 63-year-old male.
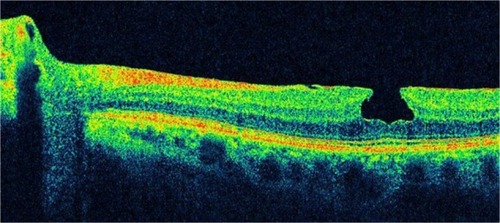
Figure 12 Spectral domain optical coherence tomography images of a 63-year-old male.
Macular pseudohole was described on OCT picture as having a steep fovea contour and a normal or slightly increased central and paracentral retinal thicknessCitation47 (–). Thus, before the OCT era, many cases might have been misdiagnosed. In full-thickness macular holes, the percentage of coexisting epiretinal membranes confirmed with SD-OCT is about 13%.Citation48 Different authors have reported on epiretinal membranes coexisting with LMH in 62% to 73% of cases utilizing OCT.Citation49
Figure 13 Pseudohole with lamellar defect.
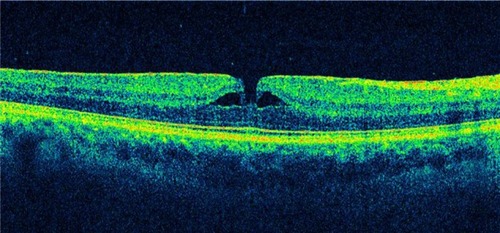
Figure 14 A 59-year-old male with lamellar macular hole.
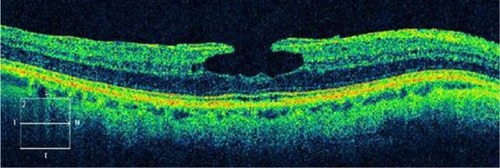
Figure 15 Macular pseudohole.
Witkin et alCitation46 reported that with ultrahigh-resolution OCT, epiretinal membranes are visible in 89% of LMH cases. Other observations demonstrate the presence of a hyper-reflective linear structure in all the cases of LMH.Citation50 LMH is generally regarded a clinically stable disorder. Theodossiadis et alCitation51 studied 41 patients with LMH and reported a mean decline of 6.4% in visual acuity (VA) after 37.1 months of observation.
Indications for surgical treatment of LMH remain controversial. A limited number of reports on vitrectomy results in LMH patients have been published, and most studies reported favorable outcomes.Citation45,Citation52–Citation54 Recent reports on vitrectomy with removal of the ERM-ILM with or without gas injection demonstrated benefit both functionally and morphologically.Citation55,Citation56 Bottoni et alCitation57 support previous indicationsCitation51 in planning treatment strategies; thus, vitrectomy could be indicated in LMHs showing a progressive thinning of foveal thickness and/or VA deterioration during the follow-up of the natural course of the disease. Recently, Lee et alCitation58 indicated that a poor initial VA, the presence of a disrupted inner segment/outer segment (IS/OS) junction (Ellipsoid Zone), or a thin fovea on preoperative SD-OCT predicted poor vision outcome after LMH surgery. However, whether it is worthwhile to attempt surgical treatment for LMH remains a controversial issue.
Epiretinal membranes
Epiretinal membrane (ERM) is a disorder in which the vitreomacular interface induces a tangential tractional force on the retina, which can result in distortion of the macular architecture and development of vascular leakage with associated macular edema and vision loss.Citation11 Visual symptoms range from mild to severe and usually are manifested by blurred vision or metamorphopsia.
ERMs occur in 2.2% to 18.5%Citation59–Citation62 of the population and can be either primary idiopathic, in which the incidence among elderly patients increases with age, or secondary to intraocular inflammatory conditions, retinal vascular disease, or occur after surgical intervention. Epiretinal membrane may also appear in otherwise healthy eyes as a result of incomplete vitreous detachment, and is typically characterized by the anatomic location of the ERM between the ILM and the vitreous body interface.Citation63
Epiretinal membranes are caused by the migration of cells through small focal defects in the internal limiting membrane after posterior vitreous detachment, or by retinal breaks and detachments. These cells proliferate and create a thin veil of tissue at the retinal–vitreous interface. Purely glial cells are reported to occur in the earlier form of ERM, whereas a prominent fibrous, nonglial component has been reported in membranes causing traction.
GassCitation64 proposed grading the severity of ERMs on the following clinical scale: Grade 0, translucent membranes unassociated with retinal distortion; Grade 1, membranes causing irregular wrinkling of the inner retina; and Grade 2, opaque membranes causing obscuration of the underlying vessels and marked full-thickness retinal distortion.
The early form of ERM, called cellophane macular reflex, is usually asymptomatic; therefore, most patients have normal or nearly normal vision with occasional metamorphopsia. However, the more severe form, known as macular pucker, can cause significant loss of visual acuity and visual symptoms such as distortion and metamorphopsia.Citation62 In very severe cases, macular edema and retinal detachment have been known to occur.
Mori et alCitation65 and Wilkins et alCitation66 classified ERM based on a scale secondary to OCT findings. OCT images of ERMs may be classified into two broad categories: globally adherent membranes or partially nonadherent membranes. Both types of ERMs are usually visible on OCT images as a taut hyper-reflective line contiguous with or anterior to the inner retinal surface. The secondary effects of the membrane, such as loss of the normal foveal contour, variable irregularity of the inner retinal layers, and macular thickening, are used to establish the presence of the membrane.
OCT provides a means to evaluate the cross-sectional characteristics of epiretinal membrane, allowing a quantitative measurement of retinal thickness, membrane thickness, and the separation between the membrane and inner retina. Quantitative measurements of membrane thickness and reflectivity can be used to establish the degree of membrane opacity. The OCT tomogram can help to distinguish between membranes globally adherent to the retina, and epiretinal membranes separated from the inner retina.Citation66
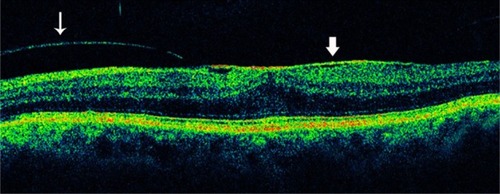
The appearance of such an ERM might be mimicked by a partially detached posterior vitreous surface. However, ERMs tend to be thicker and more reflective than the posterior vitreous. The reflection from an ERM may measure up to 60 μm in thickness; this is rarely observed with a partially detached posterior vitreous. Complete posterior vitreous detachment (PVD) is visible on the OCT image as a linear reflectivity suspended above the retinal surface (). Epiretinal membranes are visible as a highly reflective layer on the inner retinal surface on OCT ( and ).
Figure 16 Posterior vitreous detachment.
Abbreviation: OCT, optical coherence tomography.
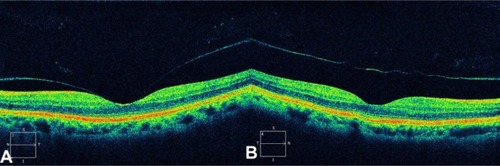
Figure 17 The epiretinal membrane is delineated as a highly reflective band and is globally attached to the retina.
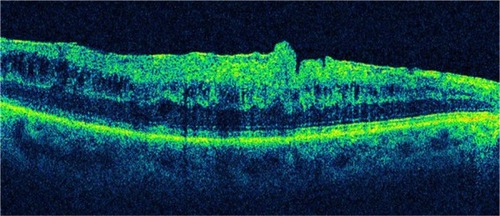
Figure 18 Partial posterior vitreous detachment and epiretinal membrane.
Characterization of the epiretinal membrane with OCT may help in preoperative planning for membrane peeling.Citation61 In cases with separation between the membrane and retina, the surgeon may be directed to these areas to initiate membrane dissection ( and ). When the membrane is globally attached to the inner retina, the surgeon may anticipate more difficulty in peeling the membrane (). The surgeon may also proceed with particular caution when extensive intraretinal edema leaves a thin, friable inner retinal layer beneath the membrane. In most ophthalmology centers, macular surgery for ERM removal is advocated if the best-corrected visual acuity falls below approximately 20/40, but there are no reports of objective indications for surgery, such as OCT findings.
Figure 19 When the surgeon observes a separation between the epiretinal membrane and the retina, he or she may be directed to these areas to initiate membrane dissection.
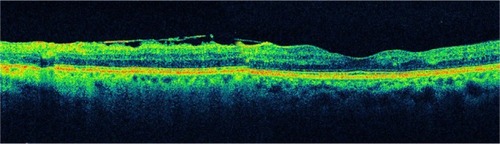
Figure 20 Another case of a partially adherent epiretinal membrane.
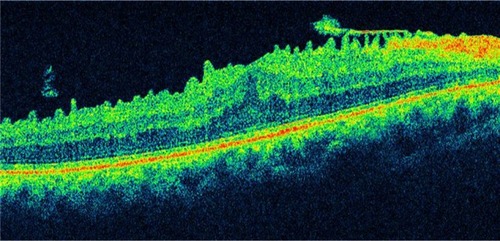
Figure 21 Epiretinal membrane.
Abbreviation: OCT, optical coherence tomography.
Metamorphopsia induced by ERM may be related to the edematous areas of the inner nuclear layer detected with SD-OCT. The classification of ERM based on the inner nuclear layer thickness is a potentially useful indication for surgery.Citation60
High-resolution OCT has several advantages for a detailed evaluation of vitreomacular traction (VMT) and ERM disease. The high-resolution representation of all intraretinal layers identifies the level and location of alterations in functionally relevant structures, such as the neurosensory architecture and the photoreceptor layer.Citation5,Citation59
Several factors, such as preoperative visual acuity,Citation67 duration of symptoms before surgery,Citation68 and the presence or absence of cystoid macular edema,Citation69 have been suggested as prognostic factors influencing the postoperative visual acuity. Investigators have suggested that the macular microstructure, such as macular thickness and appearance of the photoreceptor layer, may be associated with postoperative visual acuity.Citation70,Citation71 The introduction of SD-OCT has improved the speed and sensitivity of the examination, allowing scanning at a higher resolution. Therefore, postoperative OCT imaging can be used to document surgical response.
The photoreceptor layer can be imaged with SD-OCT as a hyper-reflective line showing the IS/OS junction or Ellipsoid Zone above the retinal pigment epithelium. An intact Ellipsoid Zone can be defined as a continuous hyper-reflective line, and the diagnosis of a disrupted IS/OS is made based on loss or irregularity of the hyper-reflective line corresponding to the Ellipsoid Zone. Existence of a correlation between photoreceptor IS/OS junction disruption and decreased postoperative visual acuity has been reported using time-domain OCT.Citation70,Citation71 Macular edema resulting from the formation of ERM and some other artifacts may prevent a clear delineation of the IS/OS junction in time-domain OCT. However, SD-OCT allows more precise visualization of the intraretinal morphologic features, such as the external limiting membrane and the photoreceptor layer, thereby enabling clear measurements of the Ellipsoid Zone even in the presence of a thickened retina caused by the presence of an ERM.Citation72,Citation73
Vitreomacular traction syndrome
As the vitreous liquefies due to age, it detaches from the macula; this natural progression has been demonstrated using OCT in normal eyes.Citation74 However, in some people, an abnormally strong adhesion is present between the vitreous cortex and macula, and as the vitreous detaches peripherally, it continues to pull on focal areas of the macula. This configuration appears identical to the vitreous attachment identified in idiopathic macular hole and cystoid macular edema or submacular fluid. Macular thickening caused by continued pathologic adherence of the vitreous to the retina in the setting of a peripheral vitreous detachment has been termed vitreomacular traction syndrome (VMTS).Citation53,Citation75
VMTS was first described in 1865 by Iwanoff Citation76 and refers to conditions in which retinal changes develop from incomplete posterior vitreous detachment with persistent vitreous adhesion to the macula, leading to morphologic distortion of the retinal surface as a result of the proliferation of myofibroblasts and the contractile element of the epiretinal membrane,Citation77 followed by functional changes such as metamorphopsia and visual deterioration. In a few of these eyes, the vitreous eventually separates from the macula on its own, leading to spontaneous resolution of vitreoretinal traction with normalization of the retinal contour and restoration of visual acuity. These changes have been documented with OCT.Citation78 However, in most eyes, vitreomacular traction persists and it can lead to progressive retinal edema, metamorphopsia, and/or visual deterioration. In these cases, vitrectomy may be an effective treatment option for patients with persistent and symptomatic vitreomacular traction diagnosed biomicroscopically.Citation79 Although the vitreous attachment to the macula usually appears broad on clinical exam, OCT typically shows an incomplete V-shaped posterior vitreous detachment temporally and nasally to the fovea, but with the fovea remaining attached (). Early stages of PVD not detected biomicroscopically have been showed using OCT in normal subjects.Citation74 Therefore, in all cases with vitreoretinal interface abnormalities OCT is extremely useful for diagnosis and follow-up after treatment of these diseases. OCT images of the interface between the macula and vitreous are very well defined because of the difference in reflectivity of the relatively acellular vitreous and parallel-fiber orientation of the inner retina.Citation10 PVD is visible on the OCT image as a thin, moderately reflective band suspended above the macular surface when it separates from the retina ().Citation80
Figure 22 Optical coherence tomography typically shows an incomplete V-shaped posterior vitreous detachment temporally and nasally to the fovea that remains attached to the posterior vitreous.
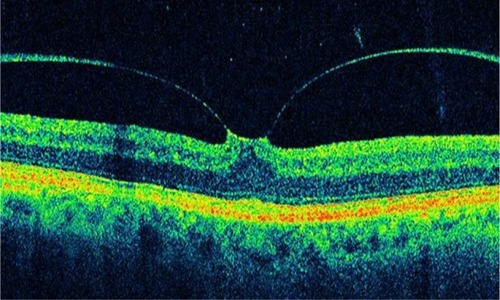
Figure 23 An incomplete posterior vitreous detachment with vitreomacular traction and tractional foveal detachment is observed on this optical coherence tomography image.
VMTS differs from idiopathic ERM in that the posterior hyaloid, rather than being totally detached from the posterior retina surface, remains attached to the perifoveal region. It is also frequently attached at the optic nerve and/or at multiple other points along or inside the vascular arcades. Sometimes the vitreous adherence can be difficult or impossible to identify directly on clinical exam. In VMTS, the PVD frequently is less reflective than ERMs and is associated with substantial foveal traction, intraretinal cystoid changes, cystoid macular edema, and foveal detachment. These changes result in central vision loss and metamorphopsia.
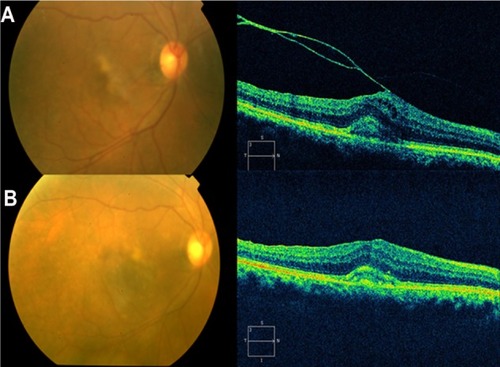
Other VMTS cases can have a PVD temporally to the fovea but no posterior vitreous detachment nasal to it. In these cases prominent CME may develop, which may result in a macular hole or macular atrophy.Citation81 On the other hand, persistent traction can lead to progressive retinal edema and thickening. Quantifying such changes with the OCT can be valuable in determining the need for and/or timing of surgical intervention. As with ERMs, OCT can provide useful information in counseling VMTS patients preoperatively with regards to visual potential. Eyes demonstrating massive traction, distortion of retinal architecture, intraretinal edema, and foveal detachment may be anticipated to have a relatively poor ultimate outcome compared to eyes not exhibiting these features. After surgery, OCT can be used to evaluate the anatomic response (). Case reports in the literature have documented improved retinal anatomy in association with increased visual acuity following vitrectomy surgery.Citation74,Citation82
Figure 24 Pre- and postoperative OCT images.
Abbreviation: OCT, optical coherence tomography.
High-resolution OCT has several advantages for a detailed evaluation of VMTS: raster scans provide a precise 2-D and 3-D image of the vitreomacular interface at each location. The high-resolution representation of all intraretinal layers identifies the level and location of alteration in functionally relevant structures, such as the neurosensory architecture and the photoreceptor layer.Citation4,Citation59,Citation83 Other advantages of SD-OCT are the improved axial resolution, higher scan speed, and the possibility of scanning the entire macular area at each location using the raster mode. These improvements enable better reproducibility of the same area of interest at each visit, and therefore enable superior results in a study aimed at evaluating distinct morphologic changes over time.
Recently, Sayegh et alCitation83 published a prospective analysis of the functional and morphologic parameters of retinal integrity over a 2-year follow-up in 30 patients undergoing vitreoretinal surgery for VMTS guided by high-resolution SD-OCT imaging. They observed that the best-corrected visual acuity did not correlate significantly with central retinal thickness or retinal volume; thus, a specific reduction of central retinal thickness and retinal volume has no significant effect on visual function. This result is consistent with the study of Haouchine et alCitation47 who measured central foveal thickness and reported no correlation with best-corrected visual acuity (BCVA). Furthermore, no correlation was found between the shape of the foveal contour, the presence of foveal cysts, or other morphologic parameters with BCVA.
The presence of the ERM induces folding and contraction of the retinal surface, and surgical release, including the internal limiting membrane, results in a rapid and impressive restoration of the retinal surface with disappearance of folds and reformation of the foveal contour. These morphologic changes seem to precede functional recovery. Visual rehabilitation proceeds over several months, reaching significance as late as 6 months after surgery. The integrity of the inner and, most importantly, the outer retinal layer follows a prolonged pattern of recovery as well. Recovery of inner/outer retinal layer proceeds slowly, reaching significance at 12 months, and correlated strongly with visual function. Therefore, reconstitution of neurosensory layers may be the most relevant parameter for visual improvement.
Vitreomacular traction and age-related macular degeneration
Vitreomacular traction alone is perhaps not able to induce age-related macular degeneration (AMD). However, it would seem sensible to consider vitreous changes when diagnosing and treating AMD patients because of the high coincidence of VMT and choroidal neovascularization and the often successful treatment of other diseases of the vitreoretinal interface by vitrectomy. The concept of the pathogenesis of AMD should therefore be extended to include the influence of the vitreous, especially where therapeutic concepts such as pharmacological vitreolysis and vitreous separation have been established as causative treatment of late forms of AMD.Citation84
Krebs et alCitation85 described the presence of vitreomacular adhesions in 36% of eyes with exudative AMD, significantly more frequently than in eyes with nonexudative AMD or control eyes. These results were confirmed by Robison et al,Citation86 who found vitreomacular adhesion (VMA) in 38% of eyes with exudative AMD, and by Lee et al,Citation87 who found VMA in 22.3% associated with neovascular AMD. These studies used primarily Stratus OCT examinations to verify VMA. Owing to the time-domain technology of Stratus OCT, differentiation between adhesion and traction was difficult, although traction was suspected in more than 50% of the cases. VMA but also signs of traction could clearly be identified in both SD-OCT machines, Spectralis and Cirrus OCT. Especially in the high-definition scans (five lines 6 mm in length in Cirrus OCT and one single line 8 mm in length in Spectralis OCT) the angulation of the posterior vitreous cortex was clearly visible. Furthermore, three-dimensional OCT (3D-OCT) shows splitting within the posterior vitreous cortex, in the area of vitreo papillary adhesion and traction from different directions. Three-dimensional OCT imaging was possible in most (83.3%) of the Cirrus SD-OCT cube scans, but only in 13.3% of Spectralis OCT volume scans of a sufficient scan density was possible.
Krebs et alCitation88 identified traction with adhesions in 73.3% of cases with exudative AMD and they showed that the location and the direction of the traction forces visualized by high-technology OCT and 3D-OCT correspond in 100% with the origin of the choroidal neovascularization.
Summary
In recent years, OCT has been established as a useful tool in the diagnosis and clinical evaluation of macular disease. OCT is now a standard of care in ophthalmology and is considered essential for the diagnosis and monitoring of many retinal diseases.
One of the major advances with OCT since its introduction has been the understanding of the pathophysiology of macular holes. Non-full-thickness macular holes have been revisited because high-resolution images can detect a lamellar macular defect that is not always visible clinically. It is reasonable to consider new therapeutic approaches with the identification of traction with adhesions in cases with exudative AMD by SD-OCT. OCT can be valuable in determining the need and/or timing of surgical intervention on vitreoretinal interface disorders.
Acknowledgments
This work was supported in part by the Arevalo-Coutinho Foundation for Research in Ophthalmology, Caracas, Venezuela. Presented in part at the LIX National Congress of Ophthalmology, Caracas, Venezuela, May 2011.
Disclosure
The authors declare no conflicts of interest in this work.
References
- FujimotoJGBrezinskiMETearneyGJOptical biopsy and imaging using optical coherence tomographyNat Med1995199709727585229
- BrezinskiMETearneyGJBoumaBEOptical coherence tomography for optical biopsy. Properties and demonstration of vascular pathologyCirculation1996936120612138653843
- LarssonJVitrectomy in vitreomacular traction syndrome evaluated by ocular coherence tomography (OCT) retinal mappingActa Ophthalmol Scand200482669169415606465
- ItoYTerasakiHMoriMKojimaTSuzukiTMiyakeYThree-dimensional optical coherence tomography of vitreomacular traction syndrome before and after vitrectomyRetina (Philadelphia, Pa)2000204403405
- KoizumiHSpaideRFFisherYLFreundKBKlancnikJMYannuzziLAThree-dimensional evaluation of vitreomacular traction and epiretinal membrane using spectral-domain optical coherence tomographyAm J Ophthalmol2008145350951718191099
- HuangDSwansonEALinCPOptical coherence tomographyScience19912545035117811811957169
- FercherAFRothEOphthalmic laser interferometryProc SPIE19866584851
- FercherAFHitzenbergerCKDrexlerWKampGSattmannHIn vivo optical coherence tomographyAm J Ophthalmol199311611131148328536
- SwansonEAIzattJAHeeMRIn vivo retinal imaging by optical coherence tomographyOpt Lett199318211864186619829430
- HeeMRIzattJASwansonEAOptical coherence tomography of the human retinaArch Ophthalmol199511333253327887846
- VooIMavrofridesECPuliafitoCAClinical applications of optical coherence tomography for the diagnosis and management of macular diseasesOphthalmol Clin North Am2004171213115102511
- PanozzoGGussonEParoliniBMercantiARole of OCT in the diagnosis and follow up of diabetic macular edemaSemin Ophthalmol2003182748114566626
- MassinPDuguidGErginayAHaouchineBGaudricAOptical coherence tomography for evaluating diabetic macular edema before and after vitrectomyAm J Ophthalmol2003135216917712566020
- BoumaBTearneyGJBoppartSAHeeMRBrezinskiMEFujimotoJGHigh-resolution optical coherence tomographic imaging using a mode-locked Ti:Al(2)O(3) laser sourceOpt Lett199520131486148819862057
- DrexlerWMorgnerUKärtnerFXIn vivo ultrahigh-resolution optical coherence tomographyOpt Lett199924171221122318073990
- DrexlerWMorgnerUGhantaRKKärtnerFXSchumanJSFujimotoJGUltrahigh-resolution ophthalmic optical coherence tomographyNat Med20017450250711283681
- DrexlerWSattmannHHermannBEnhanced visualization of macular pathology with the use of ultrahigh-resolution optical coherence tomographyArch Ophthalmol2003121569570612742848
- HoACGuyerDRFineSLMacular holeSurv Ophthalmol19984253934169548570
- ChewEYSperdutoRDHillerRClinical course of macular holes: the Eye Disease Case-Control StudyArch Ophthalmol1999117224224610037571
- ChauhanDSAntcliffRJRaiPAWilliamsonTHMarshallJPapillofoveal traction in macular hole formation: the role of optical coherence tomographyArch Ophthalmol20001181323810636411
- MoriKAbeTYoneyaSDome-shaped detachment of premacular vitreous cortex in macular hole developmentOphthalmic Surg Lasers200031320320910847496
- GaudricAHaouchineBMassinPPaquesMBlainPErginayAMacular hole formation: new data provided by optical coherence tomographyArch Ophthalmol1999117674475110369584
- HanICJaffeGJComparison of spectral- and time-domain optical coherence tomography for retinal thickness measurements in healthy and diseased eyesAm J Ophthalmol20091475847858858. e119200530
- ForooghianFCukrasCMeyerleCBChewEYWongWTEvaluation of time domain and spectral domain optical coherence tomography in the measurement of diabetic macular edemaInvest Ophthalmol Vis Sci200849104290429618515567
- HatefEKhwajaARentiyaZComparison of time domain and spectral domain optical coherence tomography in measurement of macular thickness in macular edema secondary to diabetic retinopathy and retinal vein occlusionJ Ophthalmol2012201235478322888403
- TakahashiHKishiSTomographic features of a lamellar macular hole formation and a lamellar hole that progressed to a full-thickness macular holeAm J Ophthalmol2000130567767911078854
- GassJDMIdiopathic senile macular holes: its early stages and pathogenesisArch Ophthalmol198810656296393358729
- JohnsonMWImprovements in the understanding and treatment of macular holeCurr Opin Ophthalmol200213315216012011683
- GassJDMReappraisal of biomicroscopic classification of stages of development of a macular holeAm J Ophthalmol19951197527597785690
- HaouchineBMassinPGaudricAFoveal pseudocyst as the first step in macular hole formation: a prospective study by optical coherence tomographyOphthalmology20011081152211150257
- AvilaMPJalkhAEMurakamiKTrempeCLSchepensCLBiomicroscopic study of the vitreous in macular breaksOphthalmology19839011127712836664666
- GassJDJoondephBCObservations concerning patients with suspected impending macular holesAm J Ophthalmol199010966386462346192
- GassJDAge-dependent idiopathic macular foramen. Current concepts of the pathogenesis, diagnosis, and treatmentOphthalmology1995925617625
- LewisMICohenSMSmiddyWEGassJDBilaterality of idiopathic macular holesGraefes Arch Clin Exp Ophthalmol199623442412458964529
- SpiritusADralandsLStalmansPStalmansISpileersWOCT study of fellow eyes of macular holesBull Soc Belge Ophtalmol2000275818410853311
- KangSWAhnKHamDITypes of macular hole closure and their clinical implicationsBr J Ophthalmol20038781015101912881347
- PuliafitoCAHeeMRLinCPImaging of macular diseases with optical coherence tomographyOphthalmology199510222172297862410
- DukerJSPuliaftoCAWilkinsJRImaging fellow eyes in patients diagnosed with idiopathic macular holes using optical coherence tomography (OCT)Ophthalmology19951021187831025
- BensonSESchlottmannPGBunceCCharterisDGComparison of macular hole size measured by optical coherence tomography, digital photography, and clinical examinationEye (Lond)2008221879017901884
- AltaweelMIpMMacular hole: improved understanding of pathogenesis, staging, and management based on optical coherence tomographySemin Ophthalmol2003182586614566624
- TilanusMACuypersMHBemelmansNAPinckersAJDeutmanAFPredictive value of pattern VEP, pattern ERG and hole size in macular hole surgeryGraefes Arch Clin Exp Ophthalmol1999237862963510459611
- UllrichSHaritoglouCGassCSchaumbergerMUlbigMWKampikAMacular hole size as a prognostic factor in macular hole surgeryBr J Ophthalmol200286439039311914205
- GassJDLamellar macular hole: a complication of cystoid macular edema after cataract extraction: a clinicopathologic case reportTrans Am Ophthalmol Soc1975732312501246806
- AllenAWGassJDContraction of a perifoveal epiretinal membrane simulating a macular holeAm J Ophthalmol1976825684691998690
- MichalewskaZMichalewskiJOdrobinaDSurgical treatment of lamellar macular holesGraefes Arch Clin Exp Ophthalmol2010248101395140020461401
- WitkinAJKoTHFujimotoJGRedefining lamellar holes and the vitreomacular interface: an ultrahigh-resolution optical coherence tomography studyOphthalmology2006113338839716513456
- HaouchineBMassinPTadayoniRErginayAGaudricADiagnosis of macular pseudoholes and lamellar macular holes by optical coherence tomographyAm J Ophthalmol2004138573273915531306
- MichalewskaZMichalewskiJNawrockiJCan HRT be a useful tool in differentiating lamellar macular holes from full-thickness macular holes?Ophthalmologe20101073251255 German19588155
- OphirAFatumSCystoid foveal oedema in symptomatic inner lamellar macular holesEye (Lond)20092391781178519098705
- MichalewskaZMichalewskiJOdrobinaDNawrockiJNon-full-thickness macular holes reassessed with spectral domain optical coherence tomographyRetina (Philadelphia, Pa)2012325922929
- TheodossiadisPGGrigoropoulosVGEmfietzoglouIEvolution of lamellar macular hole studied by optical coherence tomographyGraefes Arch Clin Exp Ophthalmol20092471132018766367
- HirakawaMUemuraANakanoTSakamotoTPars plana vitrectomy with gas tamponade for lamellar macular holesAm J Ophthalmol200514061154115516376675
- WitkinAJCastroLCReichelERogersAHBaumalCRDukerJSAnatomic and visual outcomes of vitrectomy for lamellar macular holesOphthalmic Surg Lasers Imaging201041441842420438044
- KokameGTTokuharaKGSurgical management of inner lamellar macular holeOphthalmic Surg Lasers Imaging2007381616317278539
- GarretsonBRPollackJSRubyAJDrenserKAWilliamsGASarrafizadehRVitrectomy for a symptomatic lamellar macular holeOphthalmology20081155884886. e118067968
- AndroudiSStangosABrazitikosPDLamellar macular holes: tomographic features and surgical outcomeAm J Ophthalmol2009148342042619493523
- BottoniFDeiroAPGianiAOriniCCigadaMStaurenghiGThe natural history of lamellar macular holes: a spectral domain optical coherence tomography studyGraefes Arch Clin Exp Ophthalmol2013251246747522569859
- LeeCSKohHJLimHTLeeKSLeeSCPrognostic factors in vitrectomy for lamellar macular hole assessed by spectral-domain optical coherence tomographyActa Ophthalmol2012908e597e60222632460
- LegarretaJEGregoriGKnightonRWPunjabiOSLalwaniGAPuliafitoCAThree-dimensional spectral-domain optical coherence tomography images of the retina in the presence of epiretinal membranesAm J Ophthalmol200814561023103018342830
- NgCHCheungNWangJJPrevalence and risk factors for epiretinal membranes in a multi-ethnic United States populationOphthalmology2011118469469921035863
- KleinRKleinBEWangQMossSEThe epidemiology of epiretinal membranesTrans Am Ophthalmol Soc1994924034257886875
- MitchellPSmithWCheyTWangJJChangAPrevalence and associations of epiretinal membranes. The Blue Mountains Eye Study, AustraliaOphthalmology19971046103310409186446
- KoernerFGarwegJVitrectomy for macular pucker and vitreomacular traction syndromeDoc Ophthalmol1999973–444945810896363
- GassJDMStereoscopic atlas of macular diseases; Diagnosis and Treatment3rd edSt LouisCV Mosby1987716717
- MoriKGehlbachPLSanoADeguchiTYoneyaSComparison of epiretinal membranes of differing pathogenesis using optical coherence tomographyRetina (Philadelphia, Pa)20042415762
- WilkinsJRPuliafitoCAHeeMRCharacterization of epiretinal membranes using optical coherence tomographyOphthalmology199610312214221519003350
- WongJGSachdevNBeaumontPEChangAAVisual outcomes following vitrectomy and peeling of epiretinal membraneClin Experiment Ophthalmol200533437337816033349
- RiceTADe BustrosSMichelsRGThompsonJTDebanneSMRowlandDYPrognostic factors in vitrectomy for epiretinal membranes of the maculaOphthalmology19869356026103725320
- TreseMTChandlerDBMachemerRMacular pucker. I. Prognostic criteriaGraefes Arch Clin Exp Ophthalmol1983221112156642215
- SuhMHSeoJMParkKHAssociations between macular findings by optical coherence tomography and visual outcomes after epiretinal membrane removalAm J Ophthalmol2009147347348019054492
- MitamuraYHiranoKBabaTYamamotoSCorrelation of visual recovery with presence of photoreceptor inner/outer segment junction in optical coherence images after epiretinal membrane surgeryBr J Ophthalmol200993217117518971234
- MichalewskiJMichalewskaZCisieckiSNawrockiJMorphologically functional correlations of macular pathology connected with epiretinal membrane formation in spectral optical coherence tomography (SOCT)Graefes Arch Clin Exp Ophthalmol2007245111623163117479277
- OsterSFMojanaFBrarMYusonRMChengLFreemanWRDisruption of the photoreceptor inner segment/outer segment layer on spectral domain-optical coherence tomography is a predictor of poor visual acuity in patients with epiretinal membranesRetina (Philadelphia, Pa)2010305713718
- UchinoEUemuraAOhbaNInitial stages of posterior vitreous detachment in healthy eyes of older persons evaluated by optical coherence tomographyArch Ophthalmol2001119101475147911594947
- GassJDMMacular dysfunction caused by vitreous and vitreoretinal interface abnormalitiesGassJDMStereoscopic Atlas of Macular Diseases: Diagnosis and Treatment4th edSt Louis, MOMosby-Year Book, Inc1997903914
- IwanoffABeitrage zur normalen und pathologischen Anatomie des Auges. [Contributions to the normal and pathological anatomy of the eye]Arch Ophthalmol186511135170
- GandorferARohlederMKampikAEpiretinal pathology of vitreomacular traction syndromeBr J Ophthalmol200286890290912140213
- HikichiTYoshidaATrempeCLCourse of vitreomacular traction syndromeAm J Ophthalmol1995119155617825690
- SmiddyWEMichelsRGGlaserBMdeBustrosSVitrectomy for macular traction caused by incomplete vitreous separationArch Ophthalmol198810656246283358728
- GallemoreRPJumperJMMcCuenBWJaffeGJPostelEATothCADiagnosis of vitreoretinal adhesions in macular disease with optical coherence tomographyRetina (Philadelphia, Pa)2000202115120
- YamadaNKishiSTomographic features and surgical outcomes of vitreomacular traction syndromeAm J Ophthalmol2005139111211715652835
- MunueraJMGarcía-LayanaAMaldonadoMJAlisedaDMoreno-MontañésJOptical coherence tomography in successful surgery of vitreomacular traction syndromeArch Ophthalmol199811610138813899790649
- SayeghRGGeorgopoulosMGeitzenauerWSimaderCKissCSchmidt-ErfurthUHigh-resolution optical coherence tomography after surgery for vitreomacular traction: a 2-year follow-upOphthalmology201011710201020172017. e120570362
- SchulzeSHoerleSMennelSKrollPVitreomacular traction and exudative age-related macular degenerationActa Ophthalmol200886547048118537930
- KrebsIBrannathWGlittenbergCZeilerFSebagJBinderSPosterior vitreomacular adhesion: a potential risk factor for exudative age-related macular degeneration?Am J Ophthalmol2007144574174617884003
- RobisonCDKrebsIBinderSVitreomacular adhesion in active and end-stage age-related macular degenerationAm J Ophthalmol200914817982. e219327744
- LeeSJLeeCSKohHJPosterior vitreomacular adhesion and risk of exudative age-related macular degeneration: paired eye studyAm J Ophthalmol20091474621626. e119159862
- KrebsIGlittenbergCZeilerFBinderSSpectral domain optical coherence tomography for higher precision in the evaluation of vitreoretinal adhesions in exudative age-related macular degenerationBr J Ophthalmol201195101415141821270433