Abstract
Optical coherence tomography (OCT) is a high-resolution, cross-sectional imaging technique that allows detailed assessment of retinal thickness and morphologic evaluation of the retinal layers. This technology has developed quickly over the past two decades. OCT imaging has rapidly been integrated into routine ophthalmic clinical practice and trials. It has complemented fluorescein angiography in many instances, especially in the diagnosis and management of retinal disorders, including diabetic macular edema and age-related macular degeneration. With OCT, the exact localization of pathologic features can be visualized in segmentation maps of the retina, and this has allowed OCT to be used to evaluate specific features that may serve as predictive factors in the prognosis and follow up of these pathologies. Therefore, it has become an important clinical and research tool for the diagnosis, follow up, treatment, and assessment of new treatment modalities for all diseases that affect the posterior pole of the eye.
Keywords:
Introduction
Optical coherence tomography (OCT) is a medical diagnostic imaging technology that can perform micrometer-resolution, cross-sectional or tomographic imaging in biologic tissues. In recent years, OCT has been established as a useful tool in the diagnosis and clinical evaluation of macular diseases because it allows detailed assessment of retinal thickness and morphologic evaluation of the neurosensory retinal layers. In addition, it complements fluorescein angiography (FA) in the evaluation of most common retinal disorders, including macular edema and age-related macular degeneration.
In patients with diabetes and diabetic retinopathy, some studies have shown that single measurements of the central foveal thickness, using OCT, correlate with visual acuity and are a successful means of monitoring macular thickening before and after therapy.Citation1–Citation5 However, other studies have reported conflicting results.Citation6–Citation7 Changes in diabetic macular edema can be accurately and prospectively measured with OCT, in both clinical trials and clinical practice. In neovascular age-related macular degeneration (AMD), OCT is able to measure retinal thickness accurately and reproducibly, and it is effective in assessing the response to treatment for choroidal neovascularization and is increasingly being used to guide treatment decisions. On the other hand, the improved image quality and faster image-acquisition speed of spectral domain (SD)-OCT has turned more attention toward patients with non-neovascular AMD, because different types of drusen are being identified; thus, studies are now in progress to detect the early markers for progression to late stage non-neovascular or neovascular AMD.
OCT has become an important clinical and research tool for the diagnosis, follow up, treatment, and assessment of new therapy modalities for any macular disease.
In Part I of this review we discussed the basic principles, interpretation, and clinical applications of OCT in the vitreoretinal interface disorders of the posterior pole, including macular hole, lamellar macular hole, and macular pseudohole, epiretinal membrane, vitreomacular traction syndrome, and the relationship between vitreomacular traction and AMD.
In this second part of our review we discuss the role of this technology in a variety of retinal pathologies that affect the posterior pole (the retina between the optic disc and the macula) including AMD, diabetic retinopathy, and various macular diseases. The topics discussed in this review do not pretend to be all inclusive and do not include some important diseases that can affect the posterior pole, such as intraocular tumors, uveitis, and inherited retinal diseases.
Age-related macular degeneration
Despite recent progress, AMD remains the leading cause of irreversible blindness among individuals older than 60 years, in industrialized countries.Citation8 Cigarette smoking, genetic factors, aging, ischemia, and environmental factors are considered the main important etiological factors of AMD.Citation8 Other additional factors influencing the development of exudative AMD include changes at the vitreomacular interface, which have been confirmed by OCT in several studies.Citation9,Citation10 Early non-neovascular AMD is characterized by the accumulation of macular drusen and changes in pigmentation, whereas late AMD progresses to geographic atrophy (GA), neovascularization, and severe loss of central vision.
Diagnostic methods
Fundus imaging provides an important contribution to the early and precise detection and diagnosis of AMD. Color fundus photographs and autofluorescence images document anatomical landmarks to monitor the progression of signs of AMD, with its exudative and hemorrhagic complications. However, only angiographic methods can directly visualize choroidal neovascularization (CNV); FA demonstrates classic CNV and indocyanine green angiography can better demonstrate occult CNV.
Currently, the determination of whether CNV is classic or occult in type is no longer necessary for the initiation of treatment because the management of AMD therapy with antiangiogenic agents now largely involves determining whether or not CNV exists, regardless of type.
OCT continues to evolve, with image resolution improving from 5 to 10 microns, using the time-domain techniques, to less than 5 microns, using the SD techniques.Citation11 Most importantly, OCT is able to demonstrate the exudative component related to the abnormal permeability of CNV. SD-OCT techniques can also directly analyze the impact of CNV on the outer retinal layers and evaluate alterations of the photoreceptors and inner and outer segments.
OCT is critical for nearly every aspect of AMD management. Although OCT can be useful in the diagnosis of non-neovascular AMD, the true value is apparent in the management of neovascular AMD because OCT can help to establish treatment and retreatment guidelines and help to monitor treatment failure or success. This technology can identify indirect signs related to abnormal exudation, such as intraretinal fluid or increased retinal thickness, and it can be used to characterize drusen, GA, subretinal neovascularization and CNV, neurosensory retinal detachment, and pigment epithelial detachments (PED), which are associated with AMD.Citation12 Therefore, OCT has become an essential part of the examination in routine follow up for AMD, to guide clinical practice and to analyze the response to treatment.
Previously, when considering retreatment in AMD, FA was commonly used as an indicator of CNV activity; however, several reports have indicated poor agreement in the interpretation of FA in AMD, especially after intravitreal treatment.Citation13,Citation14 The treatment of CNV with inhibitors of vascular endothelial growth factor (VEGF) requires monthly evaluation of the activity of the lesion to support the decision for retreatment, and OCT can be very useful.Citation15
Recent studies have validated a good agreement in the interpretation of Stratus (Carl Zeiss Meditec, Jena, Germany) time-domain OCT (TD-OCT) images between observers and also good correlation between FA and TD-OCT, in terms of retinal thickness, subretinal fluid thickness, and CNV thickness.Citation13,Citation16 According to repeated studies, OCT might partially replace FA in the follow up of exudative AMD.Citation17,Citation18
Tomographic characteristics in age-related macular degeneration
Geographic atrophy
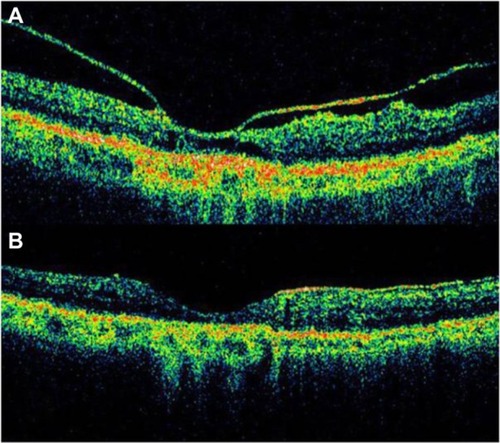
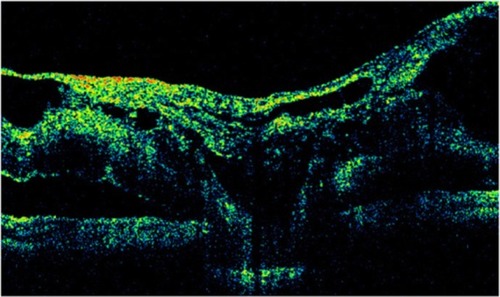
GA is a significant cause of both moderate and severe central visual loss and is bilateral in most patients with advanced AMD. It represents the loss of photoreceptors, retinal pigment epithelium (RPE), and choriocapillaris within the macula. GA is highly distinctive on OCT because the overlying retina is thinned and the hypopigmented RPE causes increased penetration of the optical probe beam into the deeper choroid, significantly enhancing the reflections from this layer. The intense back shadowing in the zones of atrophy, extending well into the choroid, is the defining sign of atrophy. Another sign, on OCT, is the thinning of the neurosensory retina over the zones of atrophy, which is particularly serious when it involves the central zone. In addition, there are no exudative signs. Thinning and loss of the RPE are clearly visualized, but maintenance of the straight line representing Bruch’s membrane (BM) is an important sign ( and ). In the most severe forms, the outer nuclear layer is no longer visible in the zones of atrophy. RPE atrophy is irreversible and causes the death of almost all the photoreceptors in the atrophic area, resulting in a corresponding scotoma.
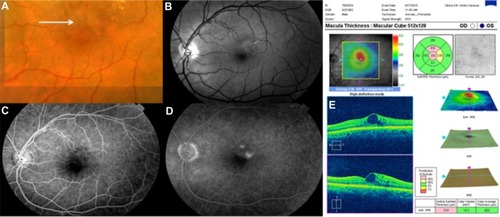
Figure 1 (A) Color fundus photograph of geographic atrophy, secondary to age-related macular degeneration, showed a rounded, depigmented area with well-defined margins. (B) Fluorescein angiography demonstrated hyperfluorescence due to a window defect. (C) The Stratus optical coherence tomography image showed backscatter in the zones of atrophy, with marked hyperreflectivity and retinal thinning in the entire zone of atrophy.
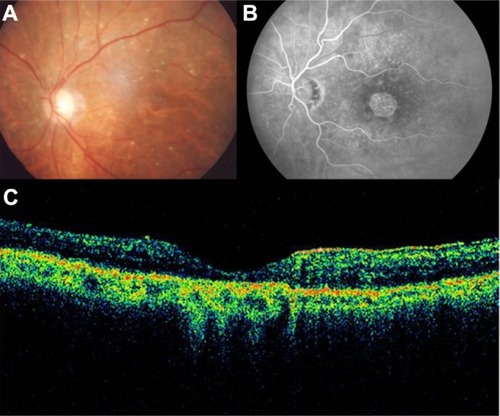
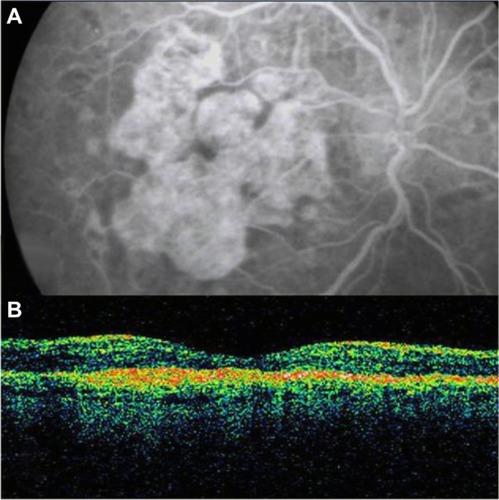
Figure 2 Geographic atrophy. (A) Fluorescein angiography demonstrated hyperfluorescence due to a window defect and central sparing. (B) Stratus optical coherence tomography image showing a significant loss of the outer nuclear layer, photoreceptors, and the retinal pigment epithelium, leading to significant hyperreflectivity and backscatter within the choroid.
Due to the current absence of an effective treatment, dry AMD has a poor prognosis, despite the hopes raised by a recognized clinical trial (Age-Related Eye Disease Study [AREDS]) that demonstrated the benefits of antioxidants, vitamin A, and vitamin C supplements. Dietary antioxidant supplementation reduced the risk of severe vision loss in intermediate forms of dry AMD and severe AMD, but it produced no conclusive effect on the primary prevention of early AMD.Citation19,Citation20
Drusen analysis
Despite great advances in fundus image analysis in the past 20 years, with the development of various manual and automated tools for drusen analysis, fundus photos have been the mainstay of drusen characterization until the introduction of OCT. These tools are capable of providing qualitative and quantitative analysis of drusen changes.
Gass noted that an increase in the drusen area was associated with a higher risk of progression to advanced AMD.Citation21 Several published studies have also shown that a greater drusen diameter and area may be associated with a significant risk of progression to advanced AMD within 5 years.Citation22–Citation24 Small hard drusen are considered an early sign of AMD.Citation25 Large numbers of hard drusen have been shown to progress to GA.Citation26 In the Blue Mountains Eye study, the eyes with large soft drusen were six times more likely to develop advanced AMD compared with the eyes without such drusen.Citation27–Citation29 Elsewhere, it was shown that approximately 25% of the large drusen present at baseline faded over 10 years of follow up, in the absence of apparent clinical progression of AMD.Citation30,Citation31
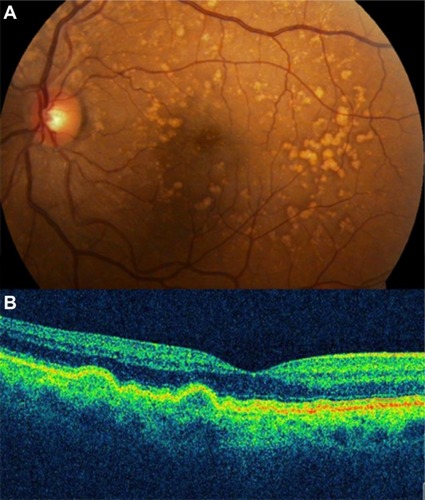
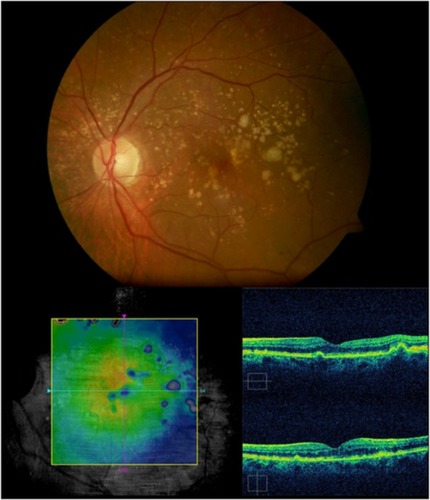
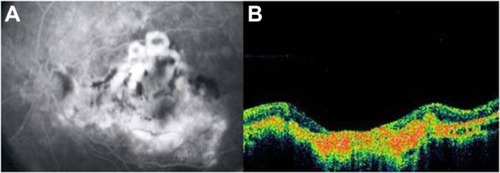
Soft drusen are observed as focal elevations in the external highly reflective band (RPE/choriocapillaris complex), consistent with the accumulation of amorphous material within or beneath BM. SD-OCT has been able to consistently identify the morphological parameters of the drusen ultrastructure, which can be used to better understand the natural history of drusen () and to monitor drusen change in patients undergoing treatment.
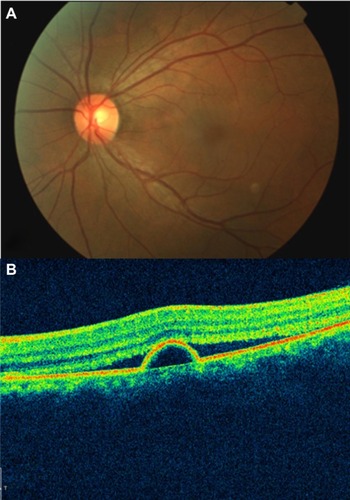
Figure 3 (A) Color photograph. (B) Cirrus™ optical coherence tomography image.
Pigment epithelial detachment
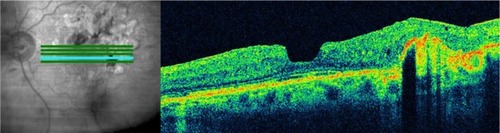
A retinal pigment epithelial detachment (PED) is formed by the separation of the RPE from BM due to the presence of sub-RPE fluid, blood, fibrovascular membrane, or drusenoid material.Citation32,Citation33 PED is an important predictor of vision loss in patients with AMD. Around half of patients with a newly diagnosed PED will experience an average visual loss of >3 lines over 1 year of follow up.Citation34 Four main types of PEDs are found in patients with AMD: drusenoid, serous, fibrovascular, and hemorrhagic. PEDs are a common presentation of neovascular AMD, seen in up to 62% of eyes with evidence of advanced AMD, by FA.Citation9
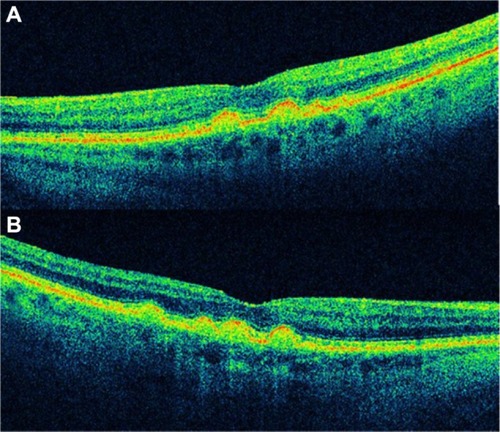
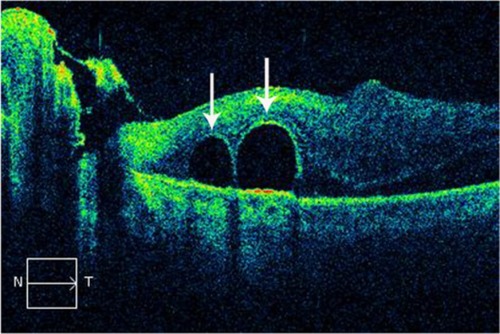
A drusenoid PED is a fairly well-circumscribed, shallow, and often multiple elevation of the reflective band corresponding to the RPE/choriocapillaris complex, formed by one or more large drusen or as a result of the slow coalescence of soft drusenCitation33,Citation35,Citation36 ( and ). It has been distinguished from the other types of PED by its relatively better prognosis.Citation37 However, the natural history usually follows a progression to persistent drusenoid PED, GA, and neovascularization.Citation38,Citation39
Figure 4 (A and B) Bilateral drusenoid pigment epithelial detachment is observed on Cirrus™ optical coherence tomography.
Drusenoid PED has a particular evolution and potential risks for severe loss of visual acuity, and it should be considered as a subgroup of AMD. Recently, anti-VEGF therapyCitation40–Citation42 has shown variable anatomical and visual outcomes in patients with symptomatic drusenoid PED without CNV in AMD ( and ).
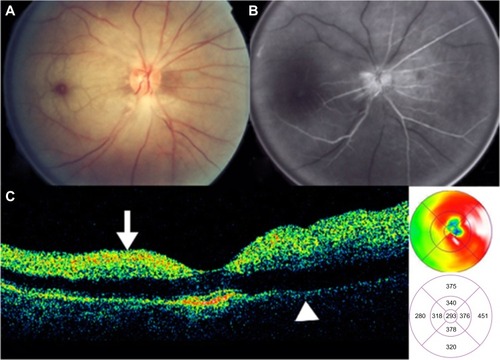
Figure 5 Cirrus™ optical coherence tomography scan.
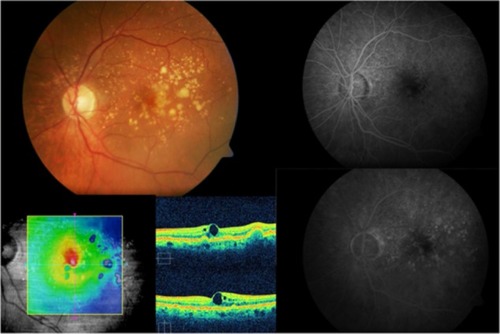
Figure 6 Cirrus™ optical coherence tomography scan.
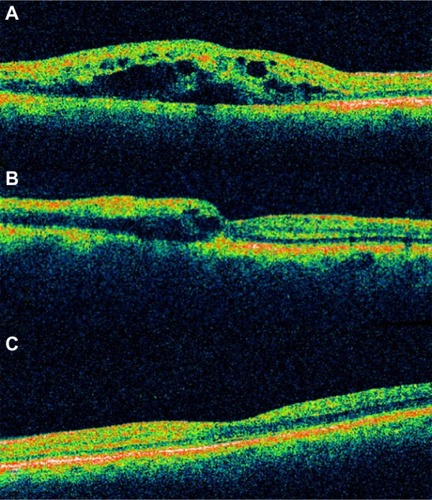
Serous PED (SPED) are sharply demarcated, smooth, dome-shaped elevations of the RPE ().Citation43 By OCT, a SPED is identified as a smooth domed elevation of the RPE, with a characteristic sharp angle of PED over an optically empty space bound inferiorly by a visible BM ().Citation35 Classically, the edges of the dome are sharply demarcated (). An area of active neovascularization associated with a SPED may lead to an associated smaller cuff of subretinal and intraretinal fluid that buttresses the SPED, a characteristic finding on OCT cross section ( and ). With anti-VEGF therapy, this area of subretinal fluid will often improve despite persistence of the associated PED.
Figure 7 Stratus optical coherence tomography image.
Abbreviation: pigment PED, epithelial detachment.
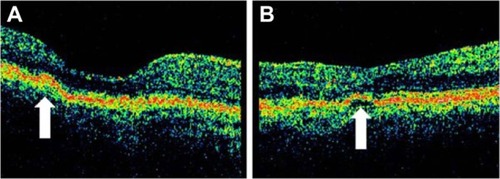
Figure 8 Stratus optical coherence tomography image.
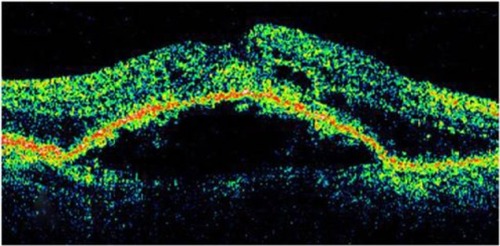
Figure 9 In this Cirrus™ optical coherence tomography image, we can see the sharply demarcated classic edges of the dome on a pigment epithelial detachment.
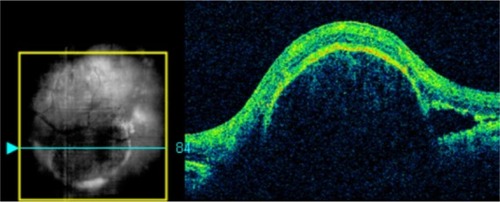
Figure 10 Stratus optical coherence tomography image.
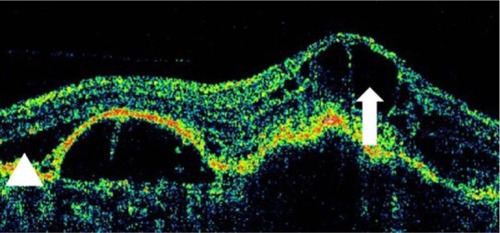
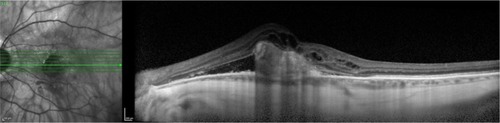
Figure 11 This Cirrus™ optical coherence tomography section demonstrates an elevation of the macular region with loss of the foveal depression.
Similarly, the combination of a PED with accompanying subretinal fluid and intraretinal fluid may be a sign of CNV or retinal angiomatous proliferation (). In contrast to CNV-associated SPEDs, RAP-associated SPEDs are almost always accompanied by overlying intraretinal cystic fluid.Citation35
Figure 12 The combination of a pigment epithelium detachment with accompanying subretinal fluid and intraretinal fluid may be a sign of choroidal neovascularization or retinal angiomatous proliferation, in this Cirrus™ optical coherence tomography image.
Certain OCT characteristics of the SPED may also help determine whether the PED is related to AMD or central serous chorioretinopathy (CSCR), another condition associated with serous RPE elevation and uncommonly associated with CNV. In a retrospective comparison of 100 eyes with either CSCR or neovascular AMD, Cho et al found that AMD eyes could be distinguished by the presence of intraretinal fluid (P < 0.0001), greater PED height (354 ± 35 μm in AMD vs 187 ± 39 μm in CSCR) (P < 0.002), and alterations of the highly reflective line (irregularity, thickening, and attenuation) seen on TD-OCT (P < 0.0001).Citation44
Hemorrhagic PEDs (HPEDs) occur when a CNV membrane bleeds into the sub-RPE space or as a result of an RPE tear. The hemorrhage may also invade the subretinal space, with sub-RPE blood having a typically darker appearance than subretinal blood. A hemorrhage associated with PED increases the suspicion for an occult CNV not seen on exam or OCT. The blood may also be located in both the subretinal and sub-RPE layers. The challenge in the treatment of HPEDs is that the CNV lesion cannot be directly visualized due to the presence of overlying hemorrhage. HPEDs have a similar ophthalmoscopic character to SPEDs, with a smooth, domed, and well-demarcated elevation but with a dark gray or black color, indicating the presence of blood.Citation36 In contrast to the other PEDs, the imaging of HPEDs with FA will show blockage through all phases. If an associated CNV is located completely beneath the blood, it may not be visualized by FA, due to blocking.
As with SPEDs, HPEDs will often show a dome-shaped elevation of the RPE external reflective band; however, because of the optical opacification secondary to the highly pigmented and, therefore, reflective hemorrhage, the deepest posterior structures, such as the choroid, are blocked and not visualized. Therefore, subretinal hemorrhage leads to significant shadowing of the posterior layers. Occult CNV is more commonly identified on OCT as a fibrovascular PED. The fibrovascular PED is not the typical dome-shaped elevation of the RPE/BM/choriocapillaris external band seen with SPED. The elevations are often irregular, and the interior of the detachment is often filled with backscattering material, consistent with the fibrous nature of the PED. Subretinal fluid appears as an optically transparent area geographically close to the CNV, between the RPE/BM/choriocapillaris band and the posterior edge of the neurosensory retina.
Neovascular age-related macular degeneration
Although no definitive consensus exists for the histopathologic and clinical correlation of classic and occult CNV to the Gass classification of type I and type II membranes, some evidence exists that classic CNV is more commonly type I and that occult CNV is more commonly type II ().Citation45
Figure 13 (A–D) The histopathologic (artist representation) and clinical correlation of occult and classic choroidal neovascularization to the Gass classification of type I (A and B) and type II membranes (C and D).
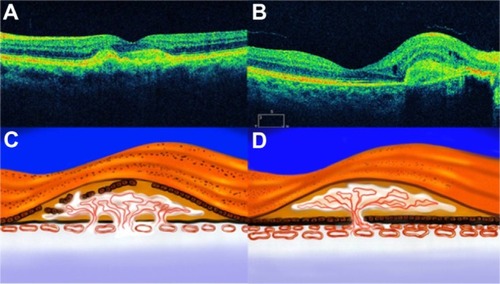
The advances in AMD treatment with anti-VEGF therapy have largely diminished the importance of the traditional fluorescein categories of CNV. OCT can be used to differentiate classic from occult CNV. Classic choroidal neovascular membranes typically show a diffusely backscattering fusiform thickening in the RPE/BM/choriocapillaris external band, in the geographic area where the membrane is seen. It is characterized by an increased optical reflectivity of the RPE or disruption of the highly reflective band layer RPE/choriocapillaris (). Sometimes, the parts of the external band may appear redundant or duplicated. Subretinal fluid and intraretinal fluid, in the form of cystoid macular edema (CME), is often present ().Citation46 In contrast, occult subretinal neovascularization tends to show an irregular elevation of the RPE, with a deeper area of mild backscattering, corresponding to fibrous proliferation ( and ). “End stage” means that the leaking or bleeding has stopped and has left a fibrous scar in the macula ( and ).
Figure 14 Choroidal neovascularization.
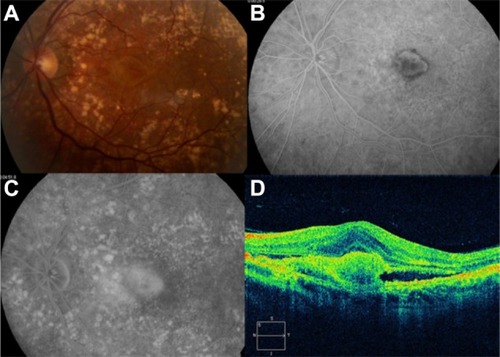
Figure 15 Choroidal neovascularization in age-related macular degeneration.
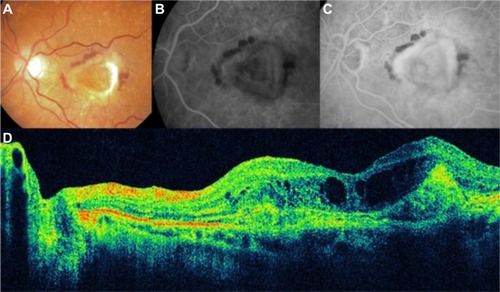
Figure 16 Choroidal neovascularization in age-related macular degeneration.
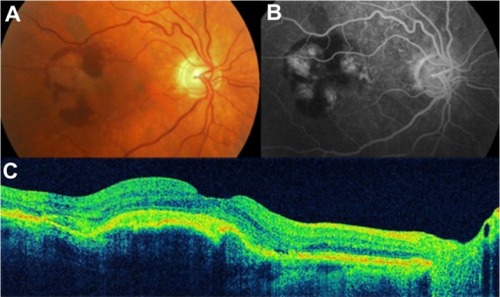
Figure 17 Choroidal neovascularization in age-related macular degeneration.
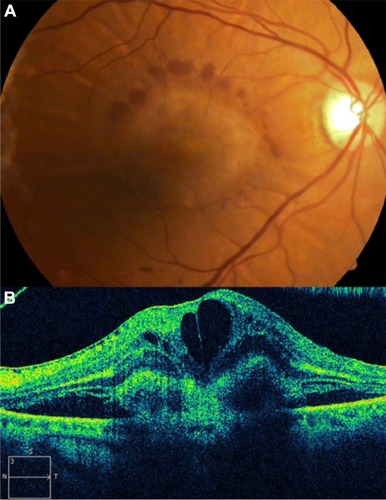
Figure 18 Cirrus™ optical coherence tomography image shows a hyperreflective band, suggesting residual fibrosis of classic choroidal neovascularization.
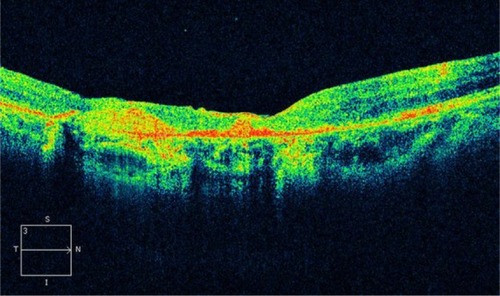
Figure 19 Disciform scar in age-related macular degeneration.
OCT is useful to quantitatively evaluate the differences in macular morphology in the eyes with polypoidal choroidal vasculopathy (PCV) from the eyes with exudative AMD.Citation47 Ozawa et al reported that serous retinal detachments (SRDs) were observed in 53% (63/118) of the eyes with exudative AMD and in 78% (69/89) of the eyes with PCV (P < 0.001). The height of the SRD was 21.9 ± 3.7 microns in the eyes with exudative AMD and was 56.3 ± 7.4 microns in the eyes with PCV (P < 0.001). The thickness of the neurosensory retina was 300.0 ± 5.2 microns in the eyes with exudative AMD and was 275.8 ± 4.7 microns in the eyes with PCV (P < 0.001). They concluded that eyes with PCV are characterized by a higher incidence of SRDs, greater SRD height, and less intraretinal edema than eyes with exudative AMD.Citation47
Role of abnormal vitreomacular adhesion in age-related macular degeneration
With OCT, the role of persistent vitreomacular adhesion in the development of numerous macular pathologies – including idiopathic macular hole, vitreomacular traction syndrome, CME and diabetic macular edema, neovascularization in diabetic retinopathy and retinal vein occlusion, exudative AMD, and myopic traction maculopathy – has been established.
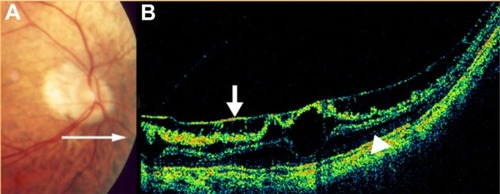
Although AMD primarily involves the outer retinal layers, several authors have suggested that the vitreous may possibly play a role in the pathogenesis and/or progression of AMD. A high incidence of posterior vitreous attachment was intraoperatively observed by different authors.Citation48,Citation49 Subsequent studies of the vitreous in AMD have been performed using ultrasound and have suggested that complete posterior vitreous detachment occurs less frequently in AMD than in the age-matched elder normal population and that a higher incidence of vitreomacular adhesion is detected in both exudative and nonexudative AMD.Citation49,Citation50 Hyaloid adhesion to the macula is associated with AMD and frequently causes vitreomacular traction in eyes with CNV. These tractional forces may antagonize the effect of anti-VEGF treatment and cause pharmacological resistance in a subpopulation of patients. OCT is an excellent method of diagnosis and follow up in these cases.Citation51 Patients with a history of poorly responsive CNV despite aggressive anti-VEGF therapy and that show persistent attachment of hyaloid to the macula, with evidence of vitreomacular traction on OCT, could be surgically treated ( and ).
Figure 20 Vitreomacular traction syndrome and geographic atrophy.
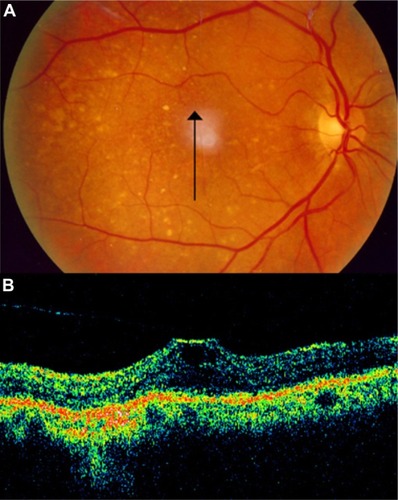
Figure 21 Vitreomacular traction syndrome and geographic atrophy.
Mojana et alCitation51 showed that there is a higher incidence of tractional configuration of the attached posterior hyaloid, in eyes with exudative AMD. Other investigators have also suggested a possible role of persistent vitreomacular adhesion in eyes with exudative macular degeneration.Citation9,Citation52
Vitreomacular traction may cause degeneration or breaks at the RPE and BM, and as a result, the macula could be continuously exposed to the free radicals and cytokines existing in the vitreous gel, resulting in the pathogenesis and/or progression of AMD. Posterior vitreous detachment may prevent continuous and direct exposure to these substances and may increase the possibility of fluid circulating behind the vitreous gel over the macular area. The rapid fluid currents not only remove the waste products and toxic materials, but also, provide oxygenation and good perfusion.
Treatment of age-related macular degeneration and optical coherence tomography
Laser treatment of subretinal neovascularization leads to atrophic scarring, which appears on OCT as highly reflective areas at the chorioretinal interface. Argon laser treatment retinal lesions evaluated in vivo by OCT has demonstrated relative high reflection in the middle of the lesion and relative low reflection around the lesion ().Citation53
Figure 22 Laser treatment of subretinal neovascularization leads to atrophic scarring, which appears, on Cirrus™ optical coherence tomography, as highly reflective at the chorioretinal interface.
In large multicenter studies investigating the current treatment of exudative AMD with anti-vasoproliferative substances, a fixed treatment regimen with monthly injections was previously applied.Citation54,Citation55 A flexible OCT-based retreatment regimen is used in new studies. The indication for retreatment is a decrease of visual acuity or an increase of retinal thickness, by OCT. Although new SD technology is available, the Stratus OCT is still the most frequently used OCT machine in these studies. Therefore, newly planned studies will need to solve the problem of different machines with different software and different values for retinal thickness that comes with the emerging SD-OCT technology.
Krebs et alCitation56 evaluated the repeatability and reproducibility of retinal thickness measurements in exudative AMD, using the Stratus OCT. A total of 200 eyes of 200 subjects with exudative AMD were examined. The macular thickness and fast macular thickness programs of the Stratus OCT were performed twice by the same examiners or by two different examiners. The repeatability and reproducibility of the retinal thickness measurements were high, presenting better results for the macular thickness program versus the fast macular thickness program. The reliability of the retinal thickness measurement was most frequently affected by algorithm line failures and fixation problems.
SD-OCT has higher axial resolution and faster acquisition speeds compared with TD-OCT, which allow SD-OCT to provide not only the detailed views of intraretinal microstructure, but also, three-dimensional (3D) images of the macula. Sayanagi et alCitation57 investigated the ability to delineate and detect the CNV activity in patients with exudative AMD treated with intravitreal injections of ranibizumab (Lucentis®; Genentech, San Francisco, CA, USA) and found that SD-OCT demonstrated a significantly better ability to delineate and detect CNV activity compared with TD-OCT.Citation57
Querques et alCitation58 studied the ability to discern the qualitative features that indicate disease activity in patients with neovascular AMD and analyzed the differences in automated retinal thickness measurement, using the Stratus TD-OCT and two different SD-OCT machines (Cirrus™ SD-OCT [Carl Zeiss] and Spectralis® SD-OCT [Heidelberg Engineering GmbH, Heidelberg, Germany]).
SD-OCT showed a greater ability to evaluate the qualitative features indicating disease activity and had fewer errors in automated segmentation. However, the detection of central macular thickness changes was similar between TD-OCT and SD-OCT systems during follow up.
Currently, 3D scans allow the visualization of the entire scanned area, resulting in a superior ability to detect CNV activity over that of linear scans and over that of the TD-OCT radial line/fast macular thickness map scans.Citation57 In another study, all the SD-OCT devices had higher detection rates of CNV activity after ranibizumab injections for exudative AMD than did TD-OCT.Citation59
Diabetic retinopathy
Diabetic retinopathy and optical coherence tomography
Diabetic retinopathy is a major cause of visual impairment in the United States and around the world.Citation60,Citation61 Macular edema is a common cause of visual loss that occurs in up to one-third of patients with diabetes mellitus. Macular edema affects approximately 29% of diabetic patients with disease duration of 20 years or more and is responsible for a significant degree of visual loss in this population.Citation62 It involves a wide spectrum of pathologic changes, including diffuse or focal edema and CME, which may have hard exudates. The traditional methods of evaluating macular thickening, including slit lamp biomicroscopy, indirect fundoscopy, and stereo fundus photography, are qualitative and are relatively insensitive to small changes in retinal thickness. In patients with diabetes and diabetic retinopathy, single measurements of central foveal thickness using OCT were shown to correlate with visual acuity and to be a successful means of monitoring macular thickening before and after laser therapyCitation1,Citation2 and/or intravitreous therapies.Citation3–Citation5 However, other studies report conflicting results; some studies have shown no correlation while others have shown a moderate correlation, and this issue is still in discussion.Citation5–Citation7
Diabetic macular edema
OCT facilitates quantification of the retinal thickness in patients with different degrees of diabetic retinopathy, with or without clinically significant macular edema. It allows measurement of the retinal thickness from the tomograms, by means of computer image processing techniques. Objective assessment of the retinal thickness, with mapping of the posterior pole, has also been demonstrated by Gieser et alCitation63 Baumann et al,Citation64 and Koozekanani et al.Citation65
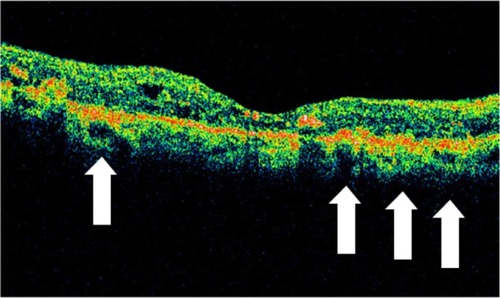
OCT shows three patterns of diabetic macular edema: retinal swelling, CME, and serous retinal detachment.Citation1 Retinal swelling shows increased retinal thickness with reduced intraretinal reflectivity and expanded areas of lower reflectivity, with cross-sectional images showing a sponge-like swelling of the retina where the low-reflective areas are expanded and where the layered structure have become irregular. Low-reflective areas are mainly located in the outer retinal layers, while the inner retinal layers are displaced anteriorly by the swollen outer retinal layers. The layered structure of the inner retinal layers is relatively preserved; however, it is occasionally interspersed with low-reflective areas ( and ). CME is characterized by the intraretinal cystoid spaces at the macular area. CME usually has four or five cystoid spaces located in the macula area, within a diameter of 5 mm. In newly (within 3 months) developed CME, the cystoid spaces occupy most of the full-thickness retina, leaving thin inner and outer retinal tissue at the fovea. Perifoveal cystoid spaces are located mainly in the outer retinal layers, and the inner retinal layers are relatively preserved. Each cystoid space is walled with septa. The cystoid spaces expand in a round or oval configuration, resulting in a protruding fovea (). In eyes with well-established CME that has persisted for more than 1 year, the cystoid spaces fuse to form a large cystoid cavity (). Serous retinal detachment is seen as a subretinal fluid accumulation with a distinct outer border of detached retina, but ophthalmoscopy sometimes fails to detect it. The thickness of the subretinal space is the greatest at the central fovea and declines peripherally (). These basic patterns are frequently combined.
Figure 23 (A and B) Fluorescein angiography shows diffused diabetic macular edema. (C) Stratus optical coherence tomography illustrates diffuse retinal thickening and cystic spaces, consistent with cystoid macular edema.
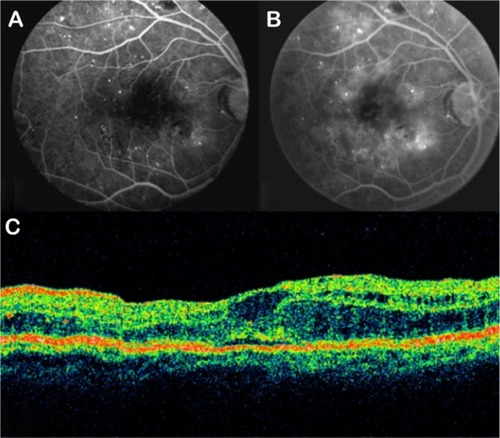
Figure 24 Stratus optical coherence tomography image.
Figure 25 Cirrus™ optical coherence tomography image.
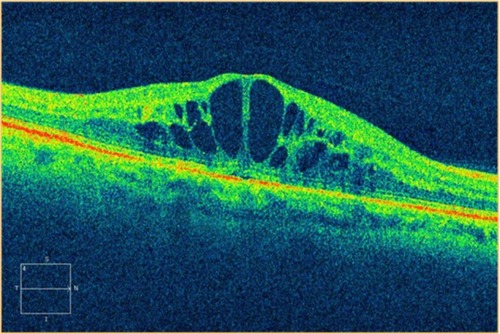
Figure 26 Stratus optical coherence tomography image.
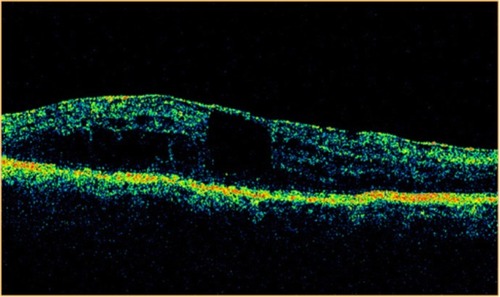
Figure 27 Stratus optical coherence tomography image.
The retina is a compact tissue composed of neural elements and glial cells. Because the glial cells occupy all of the interneural space, the extracellular space is virtually absent. According to the histopathologic report in autopsied eyes with retinal edema, retinal swelling initiates in the intracytoplasmic swelling of the Müller cells.Citation66 Sponge-like swellings in the OCT image may represent intracytoplasmic swelling of Müller cells. According to histopathologic studies, the outer plexiform layer or Henle’s fiber layer is markedly swollen in macular edema.Citation66,Citation67 A prominent space with low reflectivity in the outer retinal layers may represent the swollen Müller cells in Henle’s fiber layer.
If retinal edema persists, liquefaction necrosis of the Müller cells ensues. Necrosis of the Müller cells and adjacent neural cells leads to cystoid cavity formation in the retina.Citation67 In the histopathologic study of CME, TsoCitation68 demonstrated that cystoid spaces were located not only in the outer plexiform layer, but also, in the inner plexiform and granular layers and even in the ganglion cell layer. Some morphologic differences were seen to exist between newly developed and well-established CME: in the former, cystoid spaces primarily were located in the outer retinal layers, and the inner retinal layers were relatively preserved; in the latter, the septa of each cystoid space disappeared, forming confluent large cystoid cavities. Large cystoid spaces sometimes involved the entire retinal layer. The remaining retinal tissue was atrophic. Chronic CME may lead to the development of a lamellar macular hole, which is evident on OCT as a partial thickness loss of retinal tissue and an abnormal retinal contour suggesting cystic rupture ().
Figure 28 Stratus optical coherence tomography image.
Hard exudates, which were located in the outer retinal layers, appeared as spots of high reflectivity with low-reflective areas behind them (). Hard exudates increase retinal thickness in the OCT software algorithm. However, the effect of shadowing caused by exudates on the RPE is modest. Typically, a maximum increase of 5% in retinal thickness is found just beneath the hard exudate. Hemorrhage also blocks the reflections returning from the deeper retinal layers, due to the high scattering and associated high attenuation of light propagating through blood. The reflection from the AMD and choriocapillaris appeared slightly disrupted in areas of previous focal laser photocoagulation treatment ().
Figure 29 Stratus optical coherence tomography image.
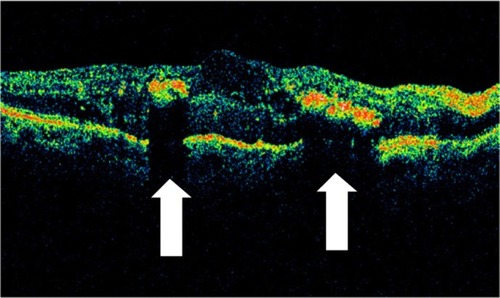
Figure 30 Stratus optical coherence tomography image.
Baumann et alCitation64 and Koozekanani et alCitation65 showed good reproducibility of macular thickness measurement with OCT, on undilated eyes. Changes in axial length or refraction may affect measurements in the transverse direction of the eye but have no effect on measurements in the axial direction.Citation65 Finally, a nuclear cataract does not seem to affect the retinal thickness measurement,Citation69 although the presence of a dense subcapsular opacity may impair the ability to perform an OCT examination.
Proliferative diabetic retinopathy
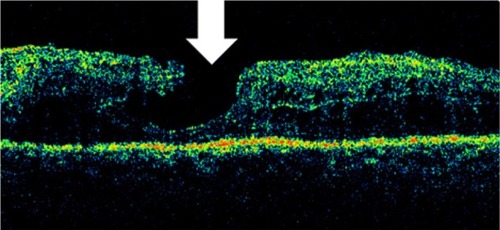
Proliferative diabetic retinopathy often leads to neovascularization, hemorrhage, and preretinal fibrosis. Subhyaloid hemorrhage may occur between the inner surface of the retina and the posterior hyaloid. In proliferative diabetic retinopathy, a subhyaloid hemorrhage may result from fragile neovascularization following partial or total posterior vitreous detachment. SD-OCT shows not only the extent of the lesion relative to the fundus photograph, but also, the change in appearance of the hemorrhage in the different parts of the retina.Citation70 A subhyaloid hemorrhage absorbs and reflects much of the OCT light and hence, creates a large shadow obscuring the underlying structures (). Preretinal membranes are visible, in cross section, as thin, reflective bands anterior to the retina (). Retinal traction and detachment are often present, and their extent can be directly measured from the OCT tomograms ( and ). The distinction between preretinal fibrosis and a detached posterior vitreous is made on the basis of reflectivity (). The posterior hyaloid typically has a lower reflectivity than a preretinal membrane, due to the optical transparency of the vitreous. “Cotton wool” spots, due to retinal ischemia, appear in OCT cross section as regions of increased reflectivity of the retinal nerve fiber layer and inner neurosensory retina. Retinal thinning corresponding to retinal atrophy can be defined by OCT in the region of previous photocoagulation treatment ().
Figure 31 (A and B) Subhyaloid hemorrhage absorbs and reflects much of the Stratus optical coherence tomography light and hence, creates a large shadow obscuring the underlying structures.
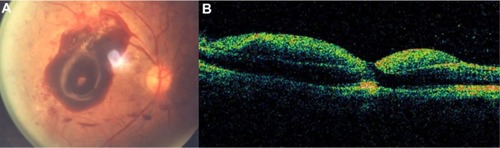
Figure 32 (A) Fundus photography, (B) fluorescein angiogram, and (C) Stratus optical coherence tomography of proliferative diabetic retinopathy with preretinal membranes (thin, reflective bands anterior to the retina) and cystoid macular edema.
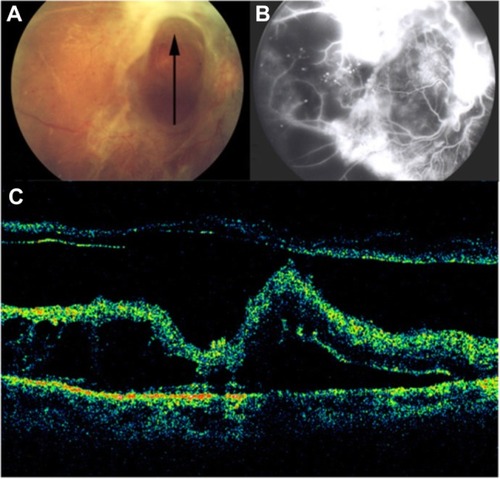
Figure 33 (A) Fundus photography, (B) fibrovascular proliferations of the optic disc (B-line), and (C) Cirrus™ optical coherence tomography of proliferative diabetic retinopathy with retinal traction and tractional detachment (C-line).
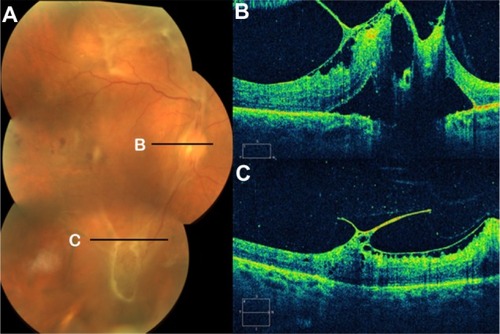
Figure 34 (A) Fundus photography, (B) fluorescein angiogram, and (C) Stratus optical coherence tomography of proliferative diabetic retinopathy with retinal traction and detachment.
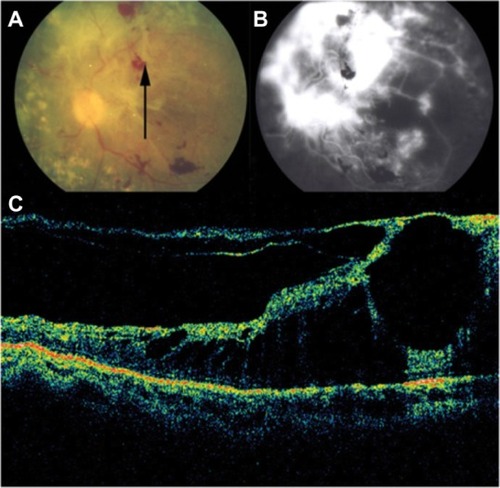
Figure 35 Stratus optical coherence tomography image.
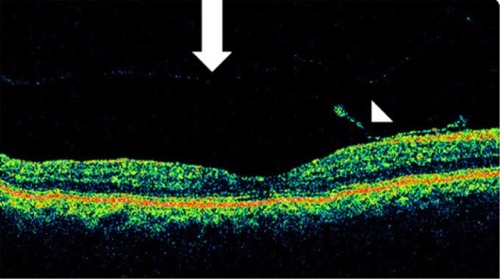
Figure 36 Retinal thinning (arrow) corresponding to retinal atrophy can be defined by Stratus optical coherence tomography, in the region of photocoagulation treatment.
Diabetic tractional papillopathy
Kroll et alCitation71 reported partial restoration of vision following vitrectomy in 15 of 17 eyes, ostensibly through the removal of the diabetic fibrovascular proliferations from the nasal part of the optic disc () and the relief of vitreopapillary traction which (for between 6 months and 6 years) had caused a reversible functional impairment of the papillomacular bundle via the stretching and kinking of ganglion cell axons and additional or consecutive effects on their prelaminar blood supply. Eyes with such features (that is, with traction primarily localized nasally on the disc and unaccountably affecting visual acuity without any associated disturbance of the central visual field) should be subjected to early vitrectomy in order to prevent irreversible long-term damage to central vision. It merits the careful attention of all ophthalmologists involved in the management of diabetic eye disease.
Figure 37 Stratus optical coherence tomography image.
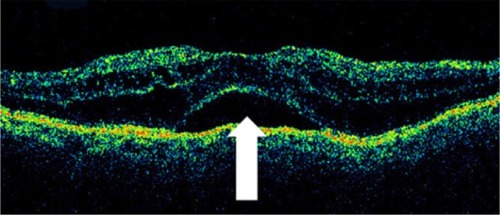
OCT can be useful to determinate the vitreous state; OCT can determine whether the vitreous is attached or detached from the retina and the optic disc (). With vitreopapillary traction, the thickened posterior hyaloid is especially hyperreflective and is attached to the disk. Also, the thickened posterior hyaloid exerts tangential and/or anteroposterior vitreopapillary traction.
Figure 38 Stratus optical coherence tomography can determine the vitreous state.
Other retinal pathologies
Central serous chorioretinopathy
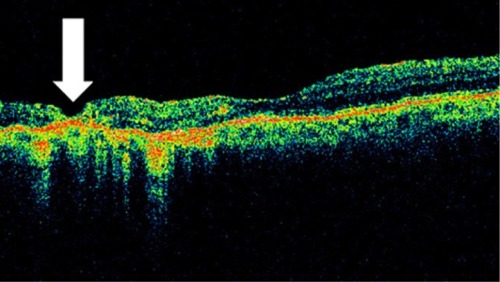
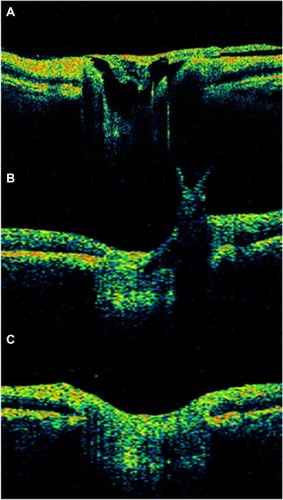
CSCR is characterized by serous detachments of the neurosensory retina in the macular region ( and ). This is a chorioretinal disease commonly seen in young and middle-aged men. Patients often develop one or more small areas of AMD serous detachment in the macula or in the paramacular area, clearly seen in the OCT image ( and ).Citation72,Citation73
Figure 39 Cirrus™ optical coherence tomography.
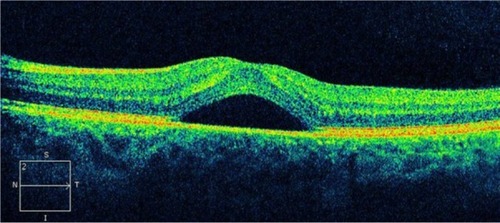
Figure 40 Central serous chorioretinopathy.
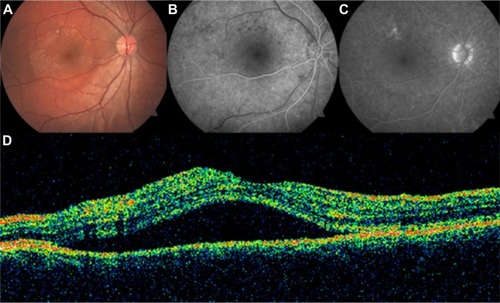
Figure 41 Central serous chorioretinopathy.
Abbreviation: OCT, optical coherence tomography.
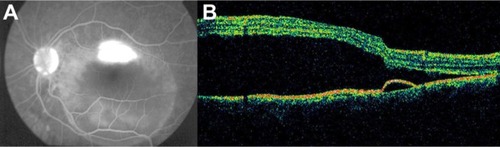
Figure 42 Central serous chorioretinopathy.
GassCitation74 postulated that an increase in the permeability of the choriocapillaris resulted in PED and exudation of fluid into the subretinal space. Studies of CSCR using indocyanine green angiography have shown multiple areas of choroidal vascular hyperpermeability,Citation75–Citation78 vascular congestion, and venous dilation,Citation78–Citation80 suggesting that a generalized choroidal vascular disturbance occurs in CSCR.
The gold standard for CSCR diagnosis is FA, which displays subretinal fluid accumulation, RPE detachment, and typical dye leakage from the choroid into the subretinal space.Citation72 Although FA is more accurate in assessing the retinal lesions, the invasiveness of this technique may hinder its repeated use in the long term. Therefore, noninvasive diagnostic systems, such as OCT, may be used as alternative diagnostic tool.
Hirami et alCitation81 compared the findings by OCT and FA in 30 eyes. They found that 22 of the 25 eyes with acute CSCR showed OCT abnormalities in the RPE (88%). These abnormalities included RPE detachment in nine eyes (36%) and a small bulge on the RPE at the posterior pole in 15 eyes (60%). Of the 29 eyes with acute or chronic CSCR, FA showed characteristic pinpoint leakage in 20 eyes (69%).Citation81 Another recent study on SD-OCT examination revealed that the OCT scan can reveal a leakage site through which fluid may pass to the subretinal area.Citation82 The authors concluded that SD-OCT may offer new information to facilitate the understanding of the mechanisms of acute CSCR.Citation82 Recently, Wang et alCitation83 demonstrated that a combination of 3D OCT and fundus photochromy offered a high identification rate of the leakage spots. The combination of the two noninvasive techniques may be used as an alternative diagnostic or evaluation tool for acute CSCR.
In a neurosensory detachment, the OCT tomogram appears as a shallow elevation of the retina, with an optically clear space between the retina and the high reflection of RPE/choriocapillaris, and the height of the cavity can be exactly measured. Examination with OCT is more sensitive to the identification of small elevations of the neurosensory retina than is slit lamp biomicroscopy.Citation84 The detached RPE may be distinguished by a focal elevation of the higher-reflective layer over a clear cavity.
Enhanced depth imaging (EDI) SD-OCT is a noninvasive method used to image the choroid and may be a valuable modality in the diagnosis and treatment of CSCR.Citation85,Citation86 The EDI-OCT technique, described by Spaide et al, improves the depth imaging capabilities of SD-OCT because it shifts the peak of the sensitivity curve of SD-OCT to the inner sclera.Citation85 With this additional imaging technique, Imamura et alCitation87 demonstrated that patients with CSCR had an increased subfoveal choroidal thickness compared with patients with normal eyes. The choroid was thick in both eyes, even when subretinal fluid was seen in only one eye. This finding provides additional evidence that CSCR may be caused by increased hydrostatic pressure in the choroid.
A neurosensory detachment may be connected with an RPE detachment, by the discontinuity on the RPE. Longitudinal examinations with OCT can detect exact changes in the height measurements of subretinal fluid and can detect CSCR resolution. Montero and Ruiz-Moreno recently described that bulges protruded from the RPE under a neurosensory detachment, in acute and chronic CSCR, which probably meant activity of the disease.Citation73 CSCR typically occurs in young healthy patients,Citation88 but when neurosensory retinal detachment occurs in older patientsCitation77,Citation89 this condition can be mistaken for neovascular AMD. It may be difficult to distinguish CSCR clinically, especially from the occult form of neovascular AMD, since occult CNV may have a similar angiographic appearance to CSCR.Citation84 Neovascular AMD and acute CSCR have distinguishing features on OCT that may help clinicians to differentiate accurately between the two conditions, primarily using OCT.Citation44
Cho et alCitation44 demonstrated that the presence of intraretinal fluid, large PEDs, and alterations of the highly reflective line, characterized by irregularity, thickening, and attenuation, was significantly more common in neovascular AMD than in acute CSCR. On the other hand, acute CSCR was notable for having significantly more and larger subretinal fluid and hypertrophic outer retinal changes, but the highly reflective line remained regular in thickness and morphology. In their study, they encountered numerous patients in an intermediate age range (55–70 years) with accumulations of submacular fluid and without frank hemorrhage that were difficult to diagnose with certainty. FA is typically not diagnostic in these circumstances. The OCT characteristics, especially the lack of disruption at the highly reflective line (in CSCR), the presence of intraretinal fluid (in AMD), and the greater height of subretinal fluid (in CSCR), are distinguishing features that appear to be highly reliable.Citation44
In conclusion, in CSCR, OCT can provide additional information and may help distinguish CSCR from subretinal neovascularization and other macular diseases. OCT has been shown to be superior to biomicroscopy and FA in identifying CSCR.Citation90
Retinal vascular occlusive disease
Retinal vascular diseases are common etiologies for central visual loss. Central retinal artery occlusion is an emergent ocular problem that frequently results in profound and permanent loss of vision. Pathologically, the inner retinal cells soon become edematous after occlusion of the artery. It is well known that central retinal artery occlusion causes an initial ischemic necrosis with intracellular edema at the acute stage and later results in the formation of an acellular scar of the inner retinal cell layers.Citation91
In patients with branch retinal artery occlusion and central retinal artery occlusion, OCT shows increased retinal thickness with cystic spaces of low reflectivity. In addition, the inner retinal layers tend to be more highly reflective in OCT, probably due to the ischemia of these layers. Therefore, this high reflection causes shadowing of the optical signal of the RPE/choriocapillaris complex. The increased thickness of the inner retina typically seen in acute artery occlusions corresponds to the intracellular edema (). OCT complements the information obtained from FA in retinal vascular diseases.
Figure 43 Central retinal artery occlusion.
Occlusion of the retinal venous system is the second most common retinal vascular disease after diabetic retinopathy.Citation92 In branch retinal vein occlusion () and central retinal vein occlusion ( and ), OCT findings include CME, serous retinal detachment, epiretinal membranes, pseudoholes, lamellar holes, and subhyaloid or preretinal hemorrhages. A significant proportion of patients with occlusion of the retinal venous system have OCT evidence of CME and serous retinal detachment. OCT shows hyporeflective intraretinal cavities, in cross-sectional scan, radiating from the center of the macula in CME. Macular edema is associated with serous retinal detachment in retinal venous system occlusion.Citation92 OCT plays a pivotal role in quantitatively monitoring the changes in retinal thickness after treatment, such as intravitreal triamcinolone or anti-VEGF therapy ().Citation93
Figure 44 Branch retinal vein occlusion with macular edema.
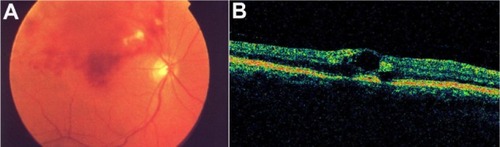
Figure 45 Central retinal vein occlusion with macular edema.
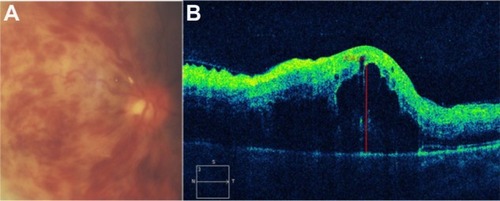
Figure 46 Acute central retinal vein occlusion with macular edema.
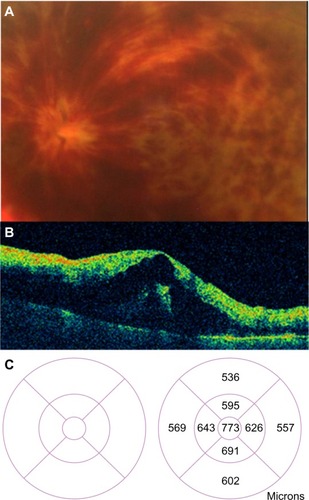
Figure 47 (A) Acute branch retinal vein occlusion with macular edema: the horizontal Stratus optical coherence tomography scan showed numerous hyporeflective spaces within the outer plexiform layer; intraretinal thickening leads to a loss of foveal contour. (B) A decrease of central macular thickness was observed 1 week after intravitreal bevacizumab therapy. (C) A normal macular thickness was seen 2 months after initial therapy.
Myopic retinoschisis
Posterior retinoschisis with high myopia is not uncommon. It may occur secondarily to posterior staphyloma, retinal atrophy, or traction from the vitreous or retinal arteriolesCitation94,Citation95 and usually cannot be easily detected by fundoscopic examination. Therefore, the diagnosis of retinoschisis in high myopia is often delayed due to poor clinical visualization of the schisis and retinal atrophy.
SD-OCT images can help to clearly demonstrate the morphological changes of retinoschisis (). With this technology, we can observe details within the retina and have a better understanding of this particularly macular disease. The schisis could be located at the outer, middle, or inner layers of the retina, but the outer schisis is the most commonly observed.Citation96 It provides important evidence as to the advantage of treatment with vitrectomy with internal limiting membrane peeling and helps to explain the visual outcome by documenting the recovery of the inner segment–outer segment layer after surgery. An OCT examination should be considered in patients with high myopia and decreasing vision with no obvious fundoscopic findings.Citation96
Figure 48 Myopic degeneration with retinoschisis.
Pseudophakic cystoid macular edema
Pseudophakic CME, also known as Irvine–Gass syndrome, is one of the most common causes of visual loss after cataract surgery.Citation97,Citation98 The incidence of CME varies widely, but is likely in the range of 1%–2%, using modern cataract extraction techniques. Pseudophakic CME classically presents 4 to 6 weeks after cataract surgery, but it has occurred as early as 3 weeks or as late as 6 months postoperatively.Citation99 The breakdown of the inner blood–retinal barrier causes the CME. The accumulation is centered around the foveola, with loss of the foveal depression. The diagnosis of CME can generally be made on the basis of a clinical examination with evidence of perifoveal cystic spaces and can be confirmed with use of FA to document the classic petaloid pattern of leakage, mainly into the outer retina. However OCT is more specific because it allows quantitative measurement of all the structures of the macular area.
OCT images demonstrate the cystic areas of decreased reflectivity within the neurosensory retina, consistent with the known histopathology of this entity (). One clinical finding that does appear to correlate with visual acuity is the level of macular thickening. Therefore, there may be a role for the OCT in the diagnosis and monitoring of CME. Pseudophakic CME has cystic spaces that are visible as rounded low-scattering areas, which typically occur in the neurosensorial retina (low-reflective intraretinal areas) (). The retinal thickness is easily measured between the nerve fiber layer and the highly backscattering red layer that represents the RPE/choriocapillaris complex. Again, the ability to quantify the extent of thickening is useful, not only in the diagnosis of this disease, but also, in assessing the response to treatment (topical medications, periocular, intraocular injections, and vitrectomy) ().
Figure 49 (A) Histological cross section of CME. (B) SD-OCT cross section of pseudophakic CME with retinal thickening, cystic intraretinal, and subretinal fluid.
Abbreviations: CME, cystoid macular edema; OCT, optical coherence tomography; SD, spectral domain.
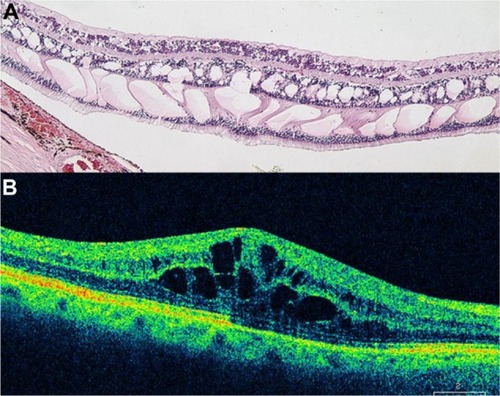
Figure 50 (A) Fluorescein angiography of CME in the recirculation phase of the angiogram demonstrates a classic petaloid leakage pattern of pseudophakic CME. (B) Cirrus™ optical coherence tomography demonstrates cystic macular changes as low-reflective spaces (dark spaces), more prominently at the level of the outer retinal layers.
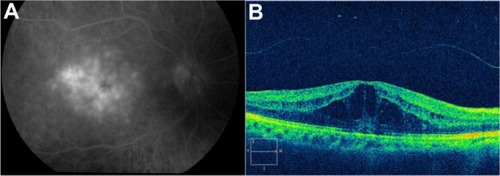
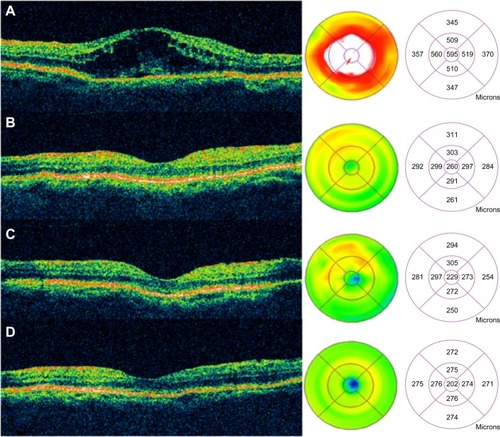
Figure 51 Sequential Stratus OCT images from a 64-year-old man with a 4-month history of loss of vision, to 20/160, in his right eye, in whom refractory pseudophakic cystoid macular edema had developed.
Abbreviations: OCT, optical coherence tomography; VA, visual acuity.
Idiopathic parafoveal telangiectasis
Retinal telangiectasis is a developmental retinal vascular disorder characterized by an ectasia of capillaries of the retina, in which irregular capillary dilation and incompetence occur in the retinal periphery of the macula. Gass described a classification with three subgroups.Citation100
OCT clearly depicts the involvement of the intraretinal and subretinal spaces in this condition. Parafoveal telangiectasis may show low-reflective intraretinal areas of macular edema and highly reflective lipid exudates on OCT ( and ). Plaques of RPE hyperplasia appear as intraretinal hyperreflective spots associated with shadowing of the reflections from the tissue below. In addition, OCT may show subretinal neovascularization associated with juxtafoveal telangiectasis.Citation101
Figure 52 (A) Color fundus photograph of localized parafoveal telangiectasis. (B) Cirrus™ optical coherence tomography image shows an intraretinal cyst as a low-reflective intraretinal area, secondary to the parafoveal telangiectasis.
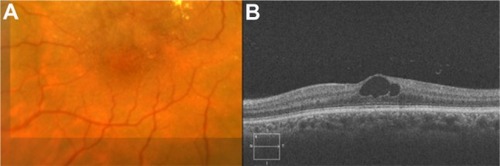
Figure 53 (A) Color fundus photograph of localized parafoveal telangiectasis. (B–D) Fluorescein angiography shows hyperfluorescence (D) due to late extravasation of the fluorescein dye. (E) The Cirrus™ optical coherence tomography image shows a intraretinal cyst as a low-reflective intraretinal area, secondary to parafoveal telangiectasis.
Miscellaneous retinal diseases
OCT is also useful for analyzing other retinal diseases, such as hydroxychloroquine toxicity (), radiation retinopathy (), commotio retinae (), retinochoroidal coloboma (), foveal hypoplasia in albinism (), medullary aplasia (), ruptured macroaneurysm ( and ), Coats’ disease (), and to confirm the presence of subretinal liquid perfluorocarbon after surgery ().
Figure 54 Fluorescein angiograms of the right (A) and left (B) eyes of a patient with hydroxychloroquine maculopathy. (C–D) Spectral domain Cirrus™ optical coherence tomography scans of the same two eyes.
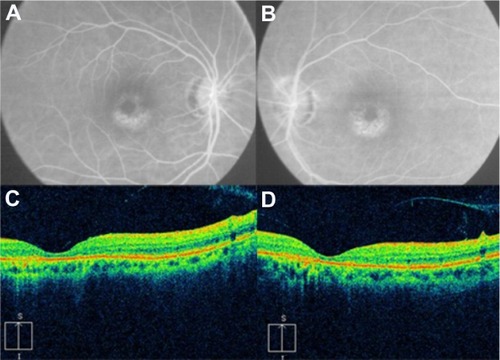
Figure 55 (A and C) Color fundus photograph and fluorescein angiogram of the right eye demonstrate papilledema, subhyaloid and retinal hemorrhages, and extensive peripapillary lipid exudation in the posterior pole, secondary to radiation retinopathy. (B and D) Spectral domain optical Cirrus™ coherence tomography image of the same eye, with noticeably increased nasal retinal thickness and hard exudates in the inner nuclear layer, outer plexiform layer, and outer nuclear layer.
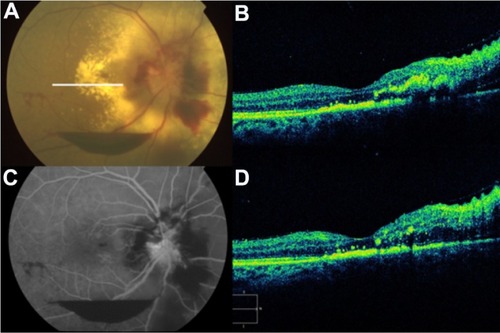
Figure 56 (A) Color fundus photograph, (B) fluorescein angiogram, (C) B-scan ultrasound, and (D) Cirrus™ optical coherence tomography image demonstrate commotio retinae and an intraocular foreign body.
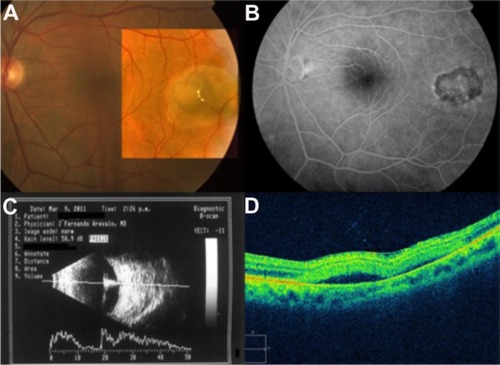
Figure 57 (A) Color fundus photograph of a retinochoroidal coloboma. (B) Normal foveal contour. (C) Cirrus™ optical coherence tomography shows the typical features of retinochoroidal coloboma with the lack of retinal and choroidal tissues, and light backscatter.
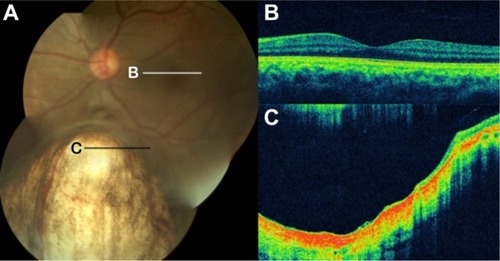
Figure 58 Foveal hypoplasia in albinism.
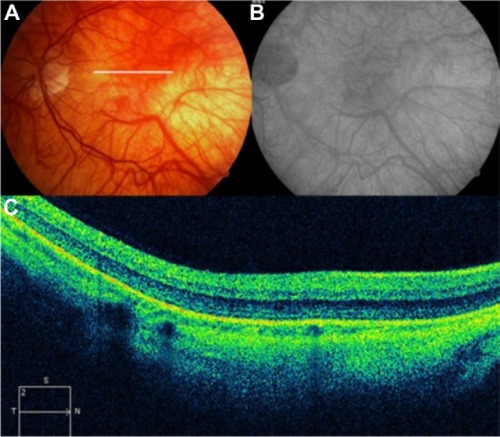
Figure 59 (A and B) Fundus color photographs of both eyes show scattered preretinal hemorrhages at the macula and surrounding the optic disk, secondary to medullary aplasia. (C) The Cirrus™ OCT image shows increased thickness and reflectivity due to the presence of blood over the inner retinal layers, causing shadowing of the optical signals of the outer retinal layers and the retinal pigment epithelium/choriocapillaris complex.
Abbreviation: OCT, optical coherence tomography.
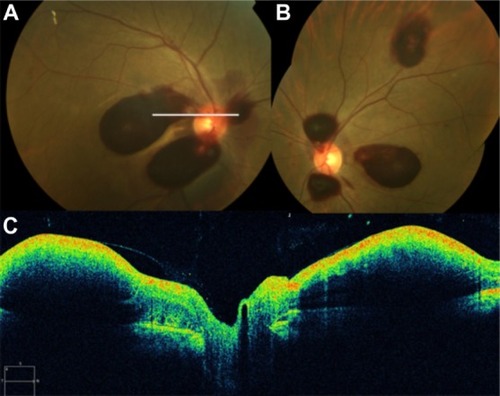
Figure 60 (A) Fluorescein angiography shows leakage from the aneurysm and surrounding area that is blocked by preretinal and retinal hemorrhage. (B) Spectral-domain Cirrus™ optical coherence tomography showing an active retinal arterial macroaneurysm.
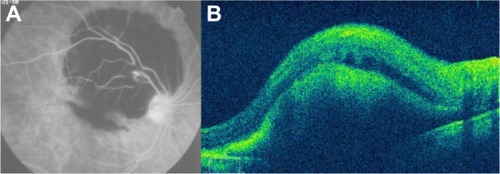
Figure 61 (A) Fundus color photograph shows retinal arterial macroaneurysm and surrounding lipid deposits 1 month after presentation. (B) Cirrus™ optical coherence tomography image shows the retinal arterial macroaneurysm located in the superficial layers and accompanied by multiple lipid deposits, predominantly seen in the outer plexiform layer.
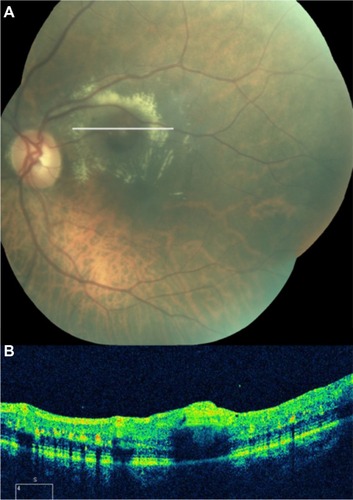
Figure 62 Coats’ disease.
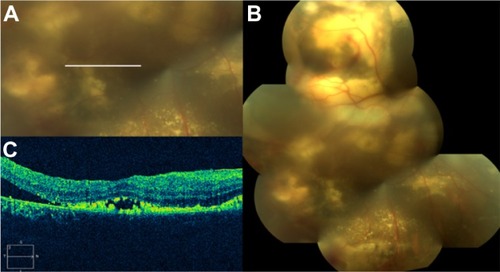
Figure 63 Spectral-domain Cirrus™ optical coherence tomography image demonstrates the presence of two subretinal bubbles of perfluorocarbon liquid (white arrows) after vitreoretinal surgery.
Enhanced depth imaging
The posterior ciliary artery circulation is the main source of blood supply for the choroid, the AMD, and the outer retina.Citation102 Contact B-scan ultrasonography can provide evidence of thickening in the disease state, and indocyanine green angiography is helpful in examining vascular structures in the choroid, but neither supplies accurate cross-sectional information. Conventional SD-OCT devices have difficulty with imaging the choroid because of the decreasing sensitivity and resolution with increasing displacement from zero-delay, the decreased maximal dynamic range inherent in SD systems, wavelength-dependent light scattering and signal loss in the image path, and the lateral width of the defocused imaging beam.Citation85
The newly developed EDI SD-OCT enables in vivo cross-sectional imaging of the choroid.Citation85 EDI-OCT is a simple modification of the SD-OCT technique. EDI OCT uses SD-OCT that is positioned closer to the eye than usual, such that a stable inverted image is produced. The net effect of this practice is that the sensitivity of the imaging in the deeper layers of tissue is increased ( and ).Citation85 In this fashion, EDI OCT may represent a useful approach to in vivo investigation of the choroidal changes in eyes, with several macular diseases.
Figure 64 Spectralis® optical coherence tomography image (Courtesy of Roberto Gallego-Pinazo, MD).
Abbreviation: EDI OCT, enhanced depth imaging optical coherence tomography.
Figure 65 Spectralis® optical coherence tomography image (Courtesy of Roberto Gallego-Pinazo, MD).
Abbreviation: EDI OCT, enhanced depth imaging optical coherence tomography.
Using EDI OCT in a group of healthy subjects, Margolis and SpaideCitation86 found a mean subfoveal choroidal thickness of 287 μm, with a negative correlation with age. By linear regression, they estimated the reduction to be approximately 15 μm for each decade of life.Citation86 In highly myopic eyes, a reduced choroidal thickness (mean: 93 μm), with a negative correlation with refractive error, was found.Citation103 The images acquired with EDI OCT have improved the ability to visualize the choroid and its internal architecture. The relative lack of pigment in patients with blond fundus and the EDI OCT technology may allow an extremely clear visualization of the choroid and sclera, showing the intrascleral course and the penetration of posterior ciliary arteries into the choroid.Citation104
EDI OCT was used to examine retinal PED in AMD to learn more about the internal structure of these conditions.Citation59 Then, Querques et alCitation105 investigated the changes in macular choroidal thickness in eyes with various stages of diabetic retinopathy, using this technology. They noted that in diabetic eyes, there was an overall thinning of the choroid on EDI OCT. The mean subfoveal choroidal thickness was significantly reduced in the diabetic group compared with the control group (P < 0.001). They concluded that a decreased choroidal thickness may lead to tissue hypoxia and consequently increase the level of VEGF, resulting in the breakdown of the blood–retinal barrier and the development of macular edema.Citation105
Reibaldi et alCitation106 observed the choroidal thickness in the macular area in patients with idiopathic macular hole in one eye and an unaffected fellow eye, and in healthy controls. The choroidal thickness was reduced in the eyes with idiopathic macular hole and also in the fellow unaffected eyes. This may suggest a contributing role of the choroid in the pathogenesis of idiopathic macular hole.Citation106 Choroidal thickness varies according to the location in relation to the macula. The inferior macular choroid is thinner than the superior macular choroid, and the choroid is thinnest nasally, thickest subfoveally, and thinner temporally. Using EDI OCT, choroidal thickness was studied in normal eyes and was shown to be thickest underneath the fovea and to be inversely proportional to age.Citation86
Recently, Coscas et alCitation107 reported a method developed to visualize and localize the neovascular network in the internal structure of fibrovascular PED due to AMD, using the en face EDI-OCT technique. This analysis may offer a clearer picture of the neovascular process and provide insights into the pathophysiology of fibrovascular PED development. They concluded that the en face EDI-OCT technique enables visualization and localization of the entire branching neovascular network of CNV within fibrovascular PED, without the need for dye injection.Citation107
Summary
OCT is a noninvasive technique that can also directly analyze the impact of CNV in AMD on the outer retinal layers and can evaluate alterations of the photoreceptors and inner and outer segments. OCT can help establish treatment and retreatment guidelines and help to monitor treatment failure or success. OCT facilitates the quantification of the retinal thickness and allows precise evaluation, in an objective way, of the effect of the management of diabetic patients with different degrees of diabetic retinopathy and clinically significant macular edema. In addition, we can use this technology to evaluate specific features that may serve as predictive factors in the prognosis and follow up of the most common posterior pole pathologies.
With SD-OCT, advantages such as improved retinal coverage, registration of OCT findings to fundus features, longitudinal tracking of pathology, and 3D imaging, promise to improve the sensitivity and specificity of diagnosis and to enhance our understanding of disease pathogenesis. SD-OCT scans of the outer retinal layers provide new morphological, qualitative, and quantitative data that are valuable for diagnosis, for developing the best treatment strategy, and for monitoring treatment. Earlier markers of disease may be detected, possibly identifying different candidates for medical or surgical therapies.
SD-OCT has already proven to be invaluable, and it should be part of our armamentarium along with slit lamp biomicroscopy and FA. In addition, in the near future, we predict this useful tool will be widely available in the operating room, to support surgical decisions and to monitor immediate results.
Acknowledgments
This work was supported in part by the Arevalo-Coutinho Foundation for Research in Ophthalmology (FACO), Caracas, Venezuela. Presented in part at the LIX National Congress of Ophthalmology, Caracas, Venezuela, May 2011.
Disclosure
The authors report no conflicts of interest in this work.
References
- OtaniTKishiSMaruyamaYPatterns of diabetic macular edema with optical coherence tomographyAm J Ophthalmol1999127668869310372879
- MylonasGBolzMKriechbaumKRetinal architecture recovery after grid photocoagulation in diabetic macular edema observed in vivo by spectral domain optical coherence tomographyRetina201333471772523528703
- MartidisADukerJSGreenbergPBIntravitreal triamcinolone for refractory diabetic macular edemaOphthalmology2002109592092711986098
- JonasJBKreissigISöfkerADegenringRFIntravitreal injection of triamcinolone for diffuse diabetic macular edemaArch Ophthalmol20031211576112523885
- HannoucheRZAvilaMPIsaacDLSilvaRSRassiARCorrelation between central subfield thickness, visual acuity and structural changes in diabetic macular edemaArq Bras Oftalmol201275318318722872201
- ShimuraMYasudaKYasudaMNakazawaTVisual outcome after intravitreal bevacizumab depends on the optical coherence tomographic patterns of patients with diffuse diabetic macular edemaRetina201333474074723222391
- ItoSMiyamotoNIshidaKKurimotoYAssociation between external limiting membrane status and visual acuity in diabetic macular oedemaBr J Ophthalmol201397222823223172879
- KleinRKleinBELintonKLPrevalence of age-related maculopathy: The Beaver Dam Eye StudyOphthalmology19929969339431630784
- KrebsIBrannathWGlittenbergCZeilerFSebagJBinderSPosterior vitreomacular adhesion: a potential risk factor for exudative age-related macular degeneration?Am J Ophthalmol2007144574174617884003
- RobisonCDKrebsIBinderSVitreomacular adhesion in active and end-stage age-related macular degenerationAm J Ophthalmol200914817982. e219327744
- YiKMujatMParkBHSpectral domain optical coherence tomography for quantitative evaluation of drusen and associated structural changes in non-neovascular age-related macular degenerationBr J Ophthalmol200993217618118697811
- HeeMRBaumalCRPuliafitoCAOptical coherence tomography of age-related macular degeneration and choroidal neovascularizationOphthalmology19961038126012708764797
- FriedmanSMMargoCEChoroidal neovascular membranes: reproducibility of angiographic interpretationAm J Ophthalmol2000130683984111124312
- van VelthovenMEde SmetMDSchlingemannROMagnaniMVerbraakFDAdded value of OCT in evaluating the presence of leakage in patients with age-related macular degeneration treated with PDTGraefes Arch Clin Exp Ophthalmol200624491119112316523305
- FungAELalwaniGARosenfeldPJAn optical coherence tomography-guided, variable dosing regimen with intravitreal ranibizumab (Lucentis) for neovascular age-related macular degenerationAm J Ophthalmol2007143456658317386270
- ZhangNHoffmeyerGCYoungESOptical coherence tomography reader agreement in neovascular age-related macular degenerationAm J Ophthalmol20071441374417509508
- KrebsIAnsari-ShahrezaeiSGollABinderSActivity of neovascular lesions treated with bevacizumab: comparison between optical coherence tomography and fluorescein angiographyGraefes Arch Clin Exp Ophthalmol2008246681181518196261
- MalamosPSacuSGeorgopoulosMKissCPruenteCSchmidt-ErfurthUCorrelation of high-definition optical coherence tomography and fluorescein angiography imaging in neovascular macular degenerationInvest Ophthalmol Vis Sci200950104926493319494200
- ChongEWWongTYKreisAJSimpsonJAGuymerRHDietary antioxidants and primary prevention of age related macular degeneration: systematic review and meta-analysisBMJ2007335762375517923720
- Age-Related Eye Disease Study Research GroupA randomized, placebo-controlled, clinical trial of high-dose supplementation with vitamins C and E, beta-carotene, and zinc for age-related macular degeneration and vision loss: AREDS report no. 8Arch Ophthalmol2001119101417143611594942
- GassJDDrusen and disciform macular detachment and degenerationArch Ophthalmol19739032062174738143
- DavisMDGangnonRELeeLYAge-Related Eye Disease Study GroupThe Age-Related Eye Disease Study severity scale for age-related macular degeneration: AREDS report no 17Arch Ophthalmol2005123111484149816286610
- FerrisFLDavisMDClemonsTEAge-Related Eye Disease Study (AREDS) Research GroupA simplified severity scale for age-related macular degeneration: AREDS report no 18Arch Ophthalmol2005123111570157416286620
- KleinRKleinBEKnudtsonMDMeuerSMSwiftMGangnonREFifteen-year cumulative incidence of age-related macular degeneration: the Beaver Dam Eye StudyOphthalmology2007114225326217270675
- KleinRPetoTBirdAVannewkirkMRThe epidemiology of age-related macular degenerationAm J Ophthalmol2004137348649515013873
- SarksSHDrusen patterns predisposing to geographic atrophy of the retinal pigment epitheliumAust J Ophthalmol198210291977103872
- SebagMPeliELahavMImage analysis of changes in drusen areaActa Ophthalmol (Copenh)19916956036101776413
- WangJJForanSSmithWMitchellPRisk of age-related macular degeneration in eyes with macular drusen or hyperpigmentation: the Blue Mountains Eye Study cohortArch Ophthalmol2003121565866312742843
- GreenWREngerCAge-related macular degeneration histopathologic studies. The 1992 Lorenz E. Zimmerman LectureRetina19931001015191535
- KleinRKleinBETomanySCMeuerSMHuangGHTen-year incidence and progression of age-related maculopathy: The Beaver Dam eye studyOphthalmology2002109101767177912359593
- BresslerNMMunozBMaguireMGFive-year incidence and disappearance of drusen and retinal pigment epithelial abnormalities. Waterman studyArch Ophthalmol199511333013087534060
- CasswellAGKohenDBirdACRetinal pigment epithelial detachments in the elderly: classification and outcomeBr J Ophthalmol19856963974032408659
- HartnettMEWeiterJJGarsdAJalkhAEClassification of retinal pigment epithelial detachments associated with drusenGraefes Arch Clin Exp Ophthalmol1992230111191547961
- PauleikhoffDLöffertDSpitalGPigment epithelial detachment in the elderly. Clinical differentiation, natural course and pathogenetic implicationsGraefes Arch Clin Exp Ophthalmol2002240753353812136282
- CoscasFCoscasGSouiedETickSSoubraneGOptical coherence tomography identification of occult choroidal neovascularization in age-related macular degenerationAm J Ophthalmol2007144459259917698019
- Age-Related Eye Disease Study Research GroupThe Age-Related Eye Disease Study system for classifying age-related macular degeneration from stereoscopic color fundus photographs: the Age-Related Eye Disease Study Report Number 6Am J Ophthalmol2001132566868111704028
- SpraulCWGrossniklausHECharacteristics of Drusen and Bruch’s membrane in postmortem eyes with age-related macular degenerationArch Ophthalmol199711522672739046265
- RoquetWRoudot-ThoravalFCoscasGSoubraneGClinical features of drusenoid pigment epithelial detachment in age related macular degenerationBr J Ophthalmol200488563864215090415
- CukrasCAgrónEKleinMLAge-Related Eye Disease Study Research GroupNatural history of drusenoid pigment epithelial detachment in age-related macular degeneration: age-related eye disease study report no 28Ophthalmology2010117348949920079925
- QuerquesGBuxAVDelle NociNFoveal geographic atrophy following intravitreal pegaptanib sodium (Macugen) for drusenoid pigment epithelium detachmentEur J Ophthalmol200919589089319787618
- KrishnanRLochheadJRegression of soft drusen and drusenoid pigment epithelial detachment following intravitreal anti-vascular endothelial growth factor therapyCan J Ophthalmol2010451838420130723
- Gallego-PinazoRMarinaASuelves-CogollosIntravitreal ranibizumab for symptomatic drusenoid pigment epithelial detachment without choroidal neovascularization in age-related macular degenerationClin Ophthalmol2011516116521383943
- YannuzziLAHope-RossMSlakterJSAnalysis of vascularized pigment epithelial detachments using indocyanine green videoangiographyRetina1994142991137518607
- ChoMAthanikarAPaccioneJWaldKJOptical coherence tomography features of acute central serous chorioretinopathy versus neovascular age-related macular degenerationBr J Ophthalmol201094559759919822922
- BresslerSBSilvaJCBresslerNMAlexanderJGreenWRClinicopathologic correlation of occult choroidal neovascularization in age-related macular degenerationArch Ophthalmol199211068278321375826
- TingTDOhMCoxTAMeyerCHTothCADecreased visual acuity associated with cystoid macular edema in neovascular age-related macular degenerationArch Ophthalmol2002120673173712049577
- OzawaSIshikawaKItoYDifferences in macular morphology between polypoidal choroidal vasculopathy and exudative age-related macular degeneration detected by optical coherence tomographyRetina200929679380219516119
- LambertHMCaponeAJrAabergTMSternbergPJrMandellBALopezPFSurgical excision of subfoveal neovascular membranes in age-related macular degenerationAm J Ophthalmol199211332572621371906
- Weber-KrauseBEckardtUIncidence of posterior vitreous detachment in eyes with and without age-related macular degeneration. An ultrasonic studyOphthalmologe1996936660665 German9081520
- OndesFYilmazGAcarMAUnlüNKocaoğlanHArsanAKRole of the vitreous in age-related macular degenerationJpn J Ophthalmol2000441919310698032
- MojanaFChengLBartschDUThe role of abnormal vitreomacular adhesion in age-related macular degeneration: spectral optical coherence tomography and surgical resultsAm J Ophthalmol2008146221822718538742
- Quaranta-El MaftouhiMMauget-FaÿsseMAnomalous vitreoretinal adhesions in patients with exudative age-related macular degeneration: an OCT studyEur J Ophthalmol200616113413716496257
- TothCABirngruberRBoppartSAArgon laser retinal lesions evaluated in vivo by optical coherence tomographyAm J Ophthalmol199712321881989186124
- RosenfeldPJBrownDMHeierJSMARINA Study GroupRanibizumab for neovascular age-related macular degenerationN Engl J Med2006355141419143117021318
- KaiserPKBrownDMZhangKRanibizumab for predominantly classic neovascular age-related macular degeneration: subgroup analysis of first-year ANCHOR resultsAm J Ophthalmol2007144685085717949673
- KrebsIHagenSBrannathWRepeatability and reproducibility of retinal thickness measurements by optical coherence tomography in age-related macular degenerationOphthalmology201011781577158420557937
- SayanagiKSharmaSYamamotoTKaiserPKComparison of spectral-domain versus time-domain optical coherence tomography in management of age-related macular degeneration with ranibizumabOphthalmology2009116594795519232732
- QuerquesGForteRBerbouchaESpectral-domain versus time domain optical coherence tomography before and after ranibizumab for age-related macular degenerationOphthalmic Res201146315215921389740
- SpaideRFEnhanced depth imaging optical coherence tomography of retinal pigment epithelial detachment in age-related macular degenerationAm J Ophthalmol2009147464465219152869
- Early Treatment Diabetic Retinopathy Study Research GroupPhotocoagulation for diabetic macular edema. Early Treatment Diabetic Retinopathy Study report number 1Arch Ophthalmol198510312179618062866759
- MossSEKleinRKleinBEThe 14-year incidence of visual loss in a diabetic populationOphthalmology1998105699810039627648
- KleinRKleinBEMossSEDavisMDDeMetsDLThe Wisconsin epidemiologic study of diabetic retinopathy. IV. Diabetic macular edemaOphthalmology19849112146414746521986
- GieserJPRusinMMMoriMBlairNPShahidiMClinical assessment of the macula by retinal topography and thickness mappingAm J Ophthalmol199712456486609372719
- BaumannMGentileRCLiebmannJMRitchRReproducibility of retinal thickness measurements in normal eyes using optical coherence tomographyOphthalmic Surg Lasers19982942802859571659
- KoozekananiDRobertsCKatzSEHerderickEEIntersession repeatability of macular thickness measurements with the Humphrey 2000 OCTInvest Ophthalmol Vis Sci20004161486149110798667
- YanoffMFineBSBruckerAJEagleRCPathology of human cystoid macular edemaSurv Ophthalmol198428SupplS505S511
- FineBSBruckerAJMacular edema and cystoid macular edemaAm J Ophthalmol19819244664817294109
- TsoMOPathology of cystoid macular edemaOphthalmology19828989029157133637
- SchumanJSPedut-KloizmanTHertzmarkEReproducibility of nerve fiber layer thickness measurements using optical coherence tomographyOphthalmology199610311188918988942887
- PunjabiOSFlynnHWJrKnightonRWSpectral domain optical coherence tomography for proliferative diabetic retinopathy with subhyaloid hemorrhageOphthalmic Surg Lasers Imaging200839649449619065981
- KrollPWiegandWSchmidtJVitreopapillary traction in proliferative diabetic vitreoretinopathy [see comments]Br J Ophthalmol199983326126410365029
- KitayaNNagaokaTHikichiTFeatures of abnormal choroidal circulation in central serous chorioretinopathyBr J Ophthalmol200387670971212770966
- MonteroJARuiz-MorenoJMOptical coherence tomography characterisation of idiopathic central serous chorioretinopathyBr J Ophthalmol200589556256415834085
- GassJDPathogenesis of disciform detachment of the neuroepitheliumAm J Ophthalmol1967633:SupplS1S139
- SpaideRFGoldbaumMWongDWTangKCIidaTSerous detachment of the retinaRetina2003236820846 quiz 89514707834
- GuyerDRYannuzziLASlakterJSSorensonJAHoAOrlockDDigital indocyanine green videoangiography of central serous chorioretinopathyArch Ophthalmol19941128105710628053819
- SpaideRFCampeasLHaasACentral serous chorioretinopathy in younger and older adultsOphthalmology19961031220702079 discussion 2079–20809003341
- IidaTKishiSHagimuraNShimizuKPersistent and bilateral choroidal vascular abnormalities in central serous chorioretinopathyRetina199919650851210606450
- PrünteCFlammerJChoroidal capillary and venous congestion in central serous chorioretinopathyAm J Ophthalmol1996121126348554078
- GiovanniniAScassellati-SforzoliniBD’AltobrandoEMariottiCRutiliTTittarelliRChoroidal findings in the course of idiopathic serous pigment epithelium detachment detected by indocyanine green videoangiographyRetina19971742862939279943
- HiramiYTsujikawaASasaharaMAlterations of retinal pigment epithelium in central serous chorioretinopathyClin Experiment Ophthalmol200735322523017430508
- FujimotoHGomiFWakabayashiTSawaMTsujikawaMTanoYMorphologic changes in acute central serous chorioretinopathy evaluated by fourier-domain optical coherence tomographyOphthalmology20081159149415001500. e118394706
- WangGHZhangJZhangDLvFLWangLXValue of three-dimensional optical coherence tomography and fundus photochromy in correlating the fluorescein leaking sites of acute central serous chorioretinopathyMed Princ Pract201120328328621455001
- HeeMRPuliafitoCAWongCOptical coherence tomography of central serous chorioretinopathyAm J Ophthalmol1995120165747611331
- SpaideRFKoizumiHPozzoniMCPozonniMCEnhanced depth imaging spectral-domain optical coherence tomographyAm J Ophthalmol2008146449650018639219
- MargolisRSpaideRFA pilot study of enhanced depth imaging optical coherence tomography of the choroid in normal eyesAm J Ophthalmol2009147581181519232559
- ImamuraYFujiwaraTMargolisRSpaideRFEnhanced depth imaging optical coherence tomography of the choroid in central serous chorioretinopathyRetina200929101469147319898183
- HussainDGassJDIdiopathic central serous chorioretinopathyIndian J Ophthalmol199846313113710085624
- SchatzHMadeiraDJohnsonRNMcDonaldHRCentral serous chorioretinopathy occurring in patients 60 years of age and olderOphthalmology199299163671741142
- WangMSanderBLund-AndersonHLarsenMDetection of shallow detachments in central serous chorioretinopathyActa Ophthalmol Scand199977440240510463409
- YanoffMFineBSOcular Pathology. A Text and Atlas3rd edHagerstown, MDJB Lippincott Co1989
- SpaideRFLeeJKKlancnikJKJrGrossNEOptical coherence tomography of branch retinal vein occlusionRetina200323334334712824834
- GreenbergPBMartidisARogersAHDukerJSReichelEIntravitreal triamcinolone acetonide for macular oedema due to central retinal vein occlusionBr J Ophthalmol200286224724811815359
- IchibeMYoshizawaTMurakamiKSurgical management of retinal detachment associated with myopic macular hole: anatomic and functional status of the maculaAm J Ophthalmol2003136227728412888050
- TakanoMKishiSFoveal retinoschisis and retinal detachment in severely myopic eyes with posterior staphylomaAm J Ophthalmol1999128447247610577588
- WangSPengQZhaoPSD-OCT use in myopic retinoschisis pre- and post-vitrectomyOptom Vis Sci201289567868322407255
- FlachAJThe incidence, pathogenesis and treatment of cystoid macular edema following cataract surgeryTrans Am Ophthalmol Soc19989655763410360304
- YonekawaYKimIKPseudophakic cystoid macular edemaCurr Opin Ophthalmol2012231263222134362
- NikicaGLjerkaHPJelenaPMetez-SoldoKMladenBCystoid macular edema in anterior chamber lens implantation following posterior capsule ruptureDoc Ophthalmol19928133093151483373
- GassJDMStereoscopic Atlas of Macular Diseases: Diagnosis and Treatment4th edSt Louis, MOMosby1997
- ShuklaDGuptaSRNeelakantanNType 2 idiopathic macular telangiectasiaRetina201232226527421968508
- HayrehSSPosterior ciliary artery circulation in health and disease: the Weisenfeld lectureInvest Ophthalmol Vis Sci200445374975774814985286
- FujiwaraTImamuraYMargolisRSlakterJSSpaideRFEnhanced depth imaging optical coherence tomography of the choroid in highly myopic eyesAm J Ophthalmol2009148344545019541286
- Dell’OmoRCostagliolaCDi SalvatoreFCifarielloFDell’OmoEEnhanced depth imaging spectral-domain optical coherence tomographyRetina201030237837920142717
- QuerquesGLattanzioRQuerquesLEnhanced depth imaging optical coherence tomography in type 2 diabetesInvest Ophthalmol Vis Sci201253106017602422879414
- ReibaldiMBosciaFAvitabileTEnhanced depth imaging optical coherence tomography of the choroid in idiopathic macular hole: A cross-sectional prospective studyAm J Ophthalmol20111511112117. e220970113
- CoscasFCoscasGQuerquesGEn face enhanced depth imaging optical coherence tomography of fibrovascular pigment epithelium detachmentInvest Ophthalmol Vis Sci20125374147415122661465
- ArevaloJFMaiaMGarcia-AmarisRAPan-American Collaborative Retina Study GroupIntravitreal bevacizumab for refractory pseudophakic cystoid macular edema: the Pan-American Collaborative Retina Study Group resultsOphthalmology200911681481148719545901