
Abstract
Purpose
To assess the role of distance stereoacuity using the System Chart SC-1600 Pola (SC) to evaluate intermittent exotropia (IXT).
Methods
Stereoacuity testing was performed in 28 children with IXT and 25 age-matched control subjects using the SC test, the distance Randot stereotest for distance, and the Titmus stereotest for near stereoacuity. Ocular alignment control was defined using the revised Newcastle Control Score (NCS). The correlations between the stereotests and NCS were evaluated using Spearman’s correlation test.
Results
Distance stereoacuity was better in both groups when using the SC test than when using the distance Randot stereotest (median: patients with IXT, 90 arcsec and 400 arcsec; control, 60 arcsec and 100 arcsec; P<0.001 for both comparisons). The two test scores were not correlated in either group (IXT: rs=−0.003, P=0.99; control: rs=0.37, P=0.07). A positive correlation was found between the distance NCS and SC test scores (rs=0.49, P=0.004) and the total NCS and SC test scores (rs=0.49, P=0.004). However, no correlation was observed between any NCS and the distance Randot stereotest or Titmus stereotest scores.
Conclusion
Stereoacuity, as measured by the SC test, may be an objective measure of IXT control.
Introduction
Stereoacuity measurements are essential to assess binocular visual function in patients with intermittent exotropia (IXT). Assessing distance stereoacuity is advocated because it is more sensitive to disease-induced deterioration than near stereoacuity, which often is preserved until late stages.Citation1–Citation5 In addition, severity can be graded by control score, which evaluates the rate of the frequency with which the deviation is noticed and the ease of refusion after the cover test.Citation6–Citation8 Patients who have poor phoria control may have worse distance stereoacuity than those who have good control. However, in previous studies, no significant correlation was found between control scores and distance stereoacuity scores using the Mentor B-VAT II Video Acuity Tester, BVS Binocular Vision Testing System (B-VAT II BVS; Mentor, Norwell, MA, USA),Citation2 Frisby Davis distance (FD2) stereotest (Frisby Stereotest, Sheffield, UK), and the distance Randot stereotest (DR, Stereo Optical Co., Inc., Chicago, IL, USA).Citation3
The System Chart SC-1600 Pola (SC, Nidek Co., Ltd., Gamagori, Japan) is a visual acuity examination system that displays digitally stored chart images directly on a liquid-crystal display screen. The system, which contains a polarized contour-based chart for distance stereotesting, is convenient to use during clinical examinations. However, stereoacuity data using this test have not been reported.
To investigate the significance of the distance stereoacuity of this test in evaluating IXT, we assessed the relationship between stereoacuity and the revised Newcastle Control Score (NCS) in patients with IXT. Additionally, we compared results obtained using the SC test with those obtained from the DR test in patients with IXT and control subjects to reveal the distance stereoacuity characteristics measured by the SC test.
Subjects and methods
This study was conducted at the Department of Ophthalmology, Asahikawa Medical University, Hokkaido, Japan. Patients with IXT who met the criteria were retrospectively identified. To reveal the normative data of the distance stereoacuity of the SC test, we conducted the stereotest for visually normal subjects. The institutional review board of our institution approved this study (No 1376, 1762), and all the study procedures were conducted following the tenets of the Declaration of Helsinki. Written informed consent was obtained from the parents of visually normal subjects.
Subjects
Patients with IXT who underwent distance stereotest as part of a routine evaluation were selected using clinical records from May 23, 2011, to August 14, 2013. The eligibility criteria for the patients were as follows: visual acuity of 1.0 or better bilaterally, no history of amblyopia, less than a 2-diopter (D) difference in refractive error between eyes, less than 3 prism diopters (PD) of vertical deviation, no history of strabismus surgery, and no other ocular or neurological disorders. For the present study of stereoacuity and phoria control, the patients with constant tropia at both distance and near were excluded. Twenty-eight patients with IXT (mean age [SD] =9.0 [2.5] years, male:female =12:16) were enrolled.
Subjects in the control group were 25 age-matched children (9.6 [1.4] years, male:female =9:16). The inclusion criteria for the control group were as follows: bilateral best-corrected visual acuity of 1.0 or better, less than a 2-D difference in refractive error between eyes, no manifest deviation at distance or near fixation on cover–uncover tests, and no history or presence of ocular diseases.
Method of measuring stereoacuity
The SC test displays a 17-inch super-extended graphics array liquid-crystal display with a resolution of 1,280×1,024 pixels and a brightness of 200 cd/m2. Two test charts were used. One had a coarse disparity level of 630 arcsec, while the other had middle-to-fine disparity levels of 240 arcsec, 120 arcsec, 60 arcsec, and 40 arcsec. The images shown in these figures are contour-based stereograms. The subjects wore polarized glasses with full correction and viewed the charts at a distance of 3 m. The tests began with coarse disparities. The subject was asked whether the sequence of circles and triangles shifted sideways or appeared extruded while he or she viewed the 630 arcsec chart. The examiner classified the subject as having broad stereopsis if he or she answered that the image was extruded. The smallest disparity at which a subject could identify one shape that appeared to emerge correctly among five shapes in the middle-to-fine disparity chart was defined as the stereoacuity threshold.
The DR test is a random dot-based, vectograph, distance stereotest with test disparities of 400 arcsec, 200 arcsec, 100 arcsec, and 60 arcsec. The test was administered according to previously reported protocols.Citation9
Near stereoacuity was measured using the Titmus stereotest (TST) at the standard viewing distance of 40 cm with full correction.
Evaluation of patients
The distance and near alternate prism and cover tests were performed on patients with IXT. Subsequently, the control of fusion was evaluated by using the NCS ().Citation6
Table 1 The revised Newcastle Control Score
Data analysis
Stereoacuity was compared between the two distance stereotests using the nonparametric Wilcoxon signed-rank test. The Mann–Whitney U-test was used to compare the stereoacuity thresholds of the patients with IXT and the control group. The stereoacuity results were grouped into four categories (1: fine, 2: moderate, 3: coarse, and 4: nil) according to a previous reportCitation10 to evaluate the association between tests because their disparity levels did not correspond perfectly (). Spearman’s correlation test was used to evaluate the relationship between the two distance stereotests and between the stereoacuity scores and the NCS. We used the distance and near clinic control scores and total scores of the NCS for the analyses.
Table 2 Classification of the results of the stereotests into four categories
Results
The distance exodeviations ranged from 9 PD to 55 PD (24.5 [9.4]), and the near exodeviations ranged from 6 PD to 75 PD (24.5 [13.6]). The NCS ranged from 0 to 2 (median =1), 0 to 3 (median =1), and 1 to 6 (median =3.5) when evaluating near, distance, and total, respectively.
Distance stereoacuity
The median stereoacuity values for patients with IXT obtained using the SC and DR tests were 90 (range =40–nil) arcsec and 400 (range =60–nil) arcsec, respectively. These values were significantly worse than the control group: 60 (range =40–630 arcsec, P=0.009) for SC and 100 (range =60–nil arcsec, P=0.004) for DR (). The agreement between the SC and DR test scores for each subjects are shown in and . The SC test scores were significantly better than the DR test scores in both groups (P<0.001 for both comparisons). The correlation between the two stereotest scores was poor in both groups (IXT: rs=−0.003, P=0.99; control: rs=0.37, P=0.07).
Table 3 Median and ranges for each stereotests for cases and controls
Table 4 Categorical agreement between the System Chart SC-1600 Pola and the Distance Randot Stereotest in patients with intermittent exotropia
Table 5 Categorical agreement between the System Chart SC-1600 Pola and the Distance Randot Stereotest in controls
Near stereoacuity
The median stereoacuity values obtained using the TST were 40 (range =40–400) arcsec in patients with IXT and 40 (range =40–80) arcsec in the control group (). There was no significant difference between the two groups (P=0.98).
Control scores and distance stereoacuity in IXT
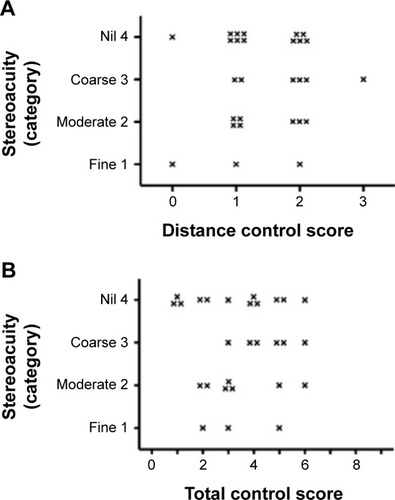
A positive correlation was found between the distance NCS and distance stereoacuity using the SC test (rs=0.48, P=0.01; ). Additionally, there was a positive correlation between the total NCS and the distance stereoacuity for the SC test (rs=0.60, P=0.0008; ). However, no significant correlation was found between the distance NCS or total NCS and the distance stereoacuity for the DR test (rs=0.03, P=0.90; rs=−0.07, P=0.73, respectively; ).
Figure 1 Relationship between NCS and distance stereoacuity using the SC test.
Abbreviations: NCS, Newcastle Control Score; SC, System Chart SC-1600 Pola.
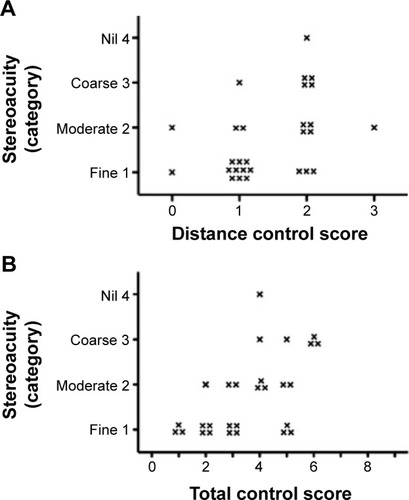
Figure 2 Relationship between NCS and distance stereoacuity using the DR test.
Abbreviations: DR, Distance Randot Stereotest; NCS, Newcastle Control Score.
Control scores and near stereoacuity in IXT
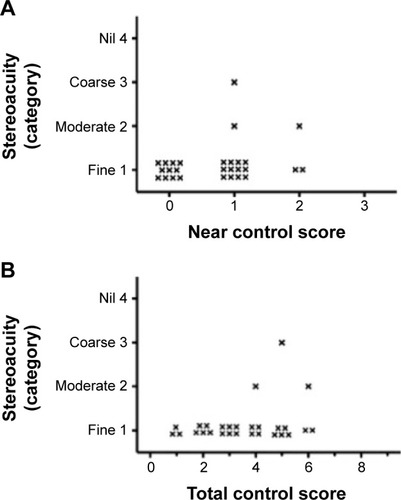
No significant correlation was found between the near NCS or the total NCS and near stereoacuity for TST (rs=0.32, P=0.10; rs=0.33, P=0.08, respectively; ).
Figure 3 Relationship between NCS and near stereoacuity using the TST.
Abbreviations: NCS, Newcastle Control Score; TST, Titmus stereotest.
Discussion
The distance stereoacuity results for the contour-based SC were significantly better than those of the random dot-based DR in both groups. This was consistent with previous reports regarding the discrepancy between contour-based and random dot-based stereotests using both distance and near tests.Citation2,Citation3,Citation10–Citation14
Kim et alCitation10 reported that the stereoacuity scores for the contour-based distance 3-D stereotest they developed and the scores for the DR test were significantly different; however, they were significantly correlated in normal adult subjects. In contrast, we found large differences and no correlation between the SC and DR scores in both groups. In real-world viewing, depths are primarily judged by the disparity of actual contours. For the shape of the random dots to emerge, a subject might require a viewing technique that is not used in real-world viewing. A well-known issue with random dot-based stereotests is that some normal subjects will erroneously fail the test because they have difficulty seeing the random dot stereoscopic effect.Citation15 A possible false-negative response with the DR test was obtained from two normal controls. They passed the SC test at 40 arcsec but failed the DR test. Similarly, seven patients with IXT did not show any stereopsis with the DR test but showed fine stereopsis with the SC test. The presence of these cases may result in the lack of statistical correlation.
The FD2 test is a real-world, contour-based distance stereotest, which is often used and reported in strabismus studies.Citation3,Citation4,Citation16–Citation18 In previous reports, the stereoacuity of the FD2 test in IXT was 40 arcsec (median)Citation3 and 32.87 arcsec ± 8.65 arcsec (mean ± SD),Citation17 which was considered generally good because it is speculated that FD2 stimulates fusion.Citation3 When the distance stereotests are arranged in the order of real-world viewing, the contour-based FD2 test, which does not have a dichoptic effect, is the closest to real-world viewing, followed by the contour-based SC test with a dichoptic effect and the random dot-based DR test. Taken together, our results and those of a previous reportCitation3,Citation17 indicate that this is also the order for distance stereoacuity level.
The main outcome of this study was that the relationship between the NCS scores and stereoacuity scores differed based on the stereotest used. A positive correlation was found between the stereoacuity value measured by the SC test and the NCS. However, no significant relationship was observed between the NCS and the distance stereoacuity measured by the DR test. Holmes et alCitation3 reported that there was no significant correlation between the control scores and the distance stereoacuity using the DR and FD2 test. Additionally, Stathacopoulos et alCitation2 observed no significant relationship between the three-point office control scale and the distance stereoacuity level using the B-VAT II BVS. In this study, the distance stereoacuity measured by the SC correlated with the NCS because the stereoacuity values measured with the SC test might have a broad range in patients with IXT. In contrast, the values from the FD2 and DR test create a ceiling or floor effect, as indicated by Holmes et al.Citation3 Additionally, the state of control could be classified more appropriately into four steps, as compared with the three steps used by Stathacopoulos et al.Citation2 As expected, almost all the patients had nearly normal stereoacuity obtained by TST, regardless of their control of fusion, which indicated that the near stereoacuity measured by the TST is not sensitive for assessing the disease severity.Citation1
Conclusion
Various stereotests are used clinically to measure stereopsis in the visual cortex; however, the results are not consistent among tests. As reported by Holmes et alCitation3 the DR test appears very sensitive to slight failure in binocular vision. The FD2 test may be useful to evaluate whether the patient can use stereoacuity in daily life. The current results suggest that the SC test can evaluate the extent of stereoacuity associated with the control in patients with IXT.
Recently, some authors reported new stereoacuity tests.Citation19–Citation22 These tests are expected to be applied in clinical practices. Further studies are needed to investigate the characteristics of each device and the relationship between stereoacuity thresholds and clinical findings, including these new devices. Clinicians should understand the characteristics of the stereotests and apply the results for the individual patient.
Disclosure
The authors report no conflicts of interest in this work.
References
- HolmesJMLeskeDAHattSRBrodskyMCMohneyBGStability of near stereoacuity in childhood intermittent exotropiaJ AAPOS201115546246722108358
- StathacopoulosRARosenbaumALZanoniDDistance stereoacuity: assessing control in intermittent exotropiaOphthalmology199310044955008479706
- HolmesJMBirchEELeskeDAFuVLNMohneyBGNew tests of distance stereoacuity and their role in evaluating intermittent exotropiaOphthalmology200711461215122017241665
- AdamsWELeskeDAHattSRImprovement in distance stereoacuity following surgery for intermittent exotropiaJ AAPOS200812214114418082437
- FengXZhangXJiaYImprovement in fusion and stereopsis following surgery for intermittent exotropiaJ Pediatr Ophthalmol Strabismus2015521525725643371
- BuckDClarkeMPHaggertyHGrading the severity of intermittent distance exotropia: the revised newcastle control scoreBr J Ophthalmol200892457718369078
- HattSRLeskeDALiebermannLHolmesJMQuantifying variability in the measurement of control in intermittent exotropiaJ AAPOS2015191333725727584
- MohneyBGHolmesJMAn office-based scale for assessing control in intermittent exotropiaStrabismus200614314715016950743
- WangJHattSRO’ConnorARFinal version of distance randot stereotest: normative data, reliability, and validityJ AAPOS201014214214620199880
- KimJYangHKKimYLeeBHwangJMDistance stereotest using a 3-dimensional monitor for adult subjectsAm J Ophthalmol201115161081108621257155
- FawcettSLAn evaluation of the agreement between contour-based circles and random dot-based near stereoacuity testsJ AAPOS20059657257816414526
- AnketellPMSaundersKJLittleJAStereoacuity norms for school-age children using the frisbystereotestJ AAPOS201317658258724321423
- YildirimCAltinsoyHIYakutEDistance stereoacuity norms for the mentor B-VAT II-SG video acuity tester in young children and young adultsJ AAPOS199821263210532363
- LeskeDABirchEEHolmesJMReal depth vs randot stereotestsAm J Ophthalmol2006142469970117011876
- WrightKWBinocular fusion and introduction to strabismusWrightKWPediatric Ophthalmology and Strabismus3rd edNew YorkOxford University Press2012217230
- SaxenaRKakkarAMenonVSharmaPPhuljheleSEvaluation of factors influencing distance stereoacuity on Frisby-Davis Distance Test (FD2) in intermittent exotropiaBr J Ophthalmol20119581098110120935306
- SinghASharmaPSinghDSaxenaRSharmaAMenonVEvaluation of FD2 (Frisby Davis distance) stereotest in surgical management of intermittent exotropiaBr J Ophthalmol201397101318132123902676
- BohrIReadJCStereoacuity with Frisby and revised FD2 stereo testsPLoS One2013812e8299924349416
- HanSBYangHKKimJHongKLeeBHwangJMNew stereoacuity test using a 3-dimensional display system in childrenPLoS One2015102e011662625693034
- MaDJYangHKHwangJMReliability and validity of an automated computerized visual acuity and stereoacuity test in children using an interactive video gameAm J Ophthalmol2013156119520123582763
- SingmanELMattaNSSilbertDITianJComparison of the INNOVA visual acuity system stereotest with the Frisby-Davis 2 stereotest for the evaluation of distance stereoacuityBinocul Vis Strabolog Q Simms Romano2013282788323822912
- HanJHanSYLeeSKLeeJBHanSHReal stereopsis test using a three-dimensional display with Tridef softwareYonsei Med J20145561672167725323907