
Abstract
Purpose
To record the normative values for macular thickness and macular volume in normal Nepalese eyes.
Methods
In all, 126 eyes of 63 emmetropic subjects (mean age: 21.17±6.76 years; range: 10–37 years) were assessed for macular thickness and macular volume, using spectral domain-optical coherence tomography over 6×6 mm2 in the posterior pole. A fast macular thickness protocol was employed. Statistics such as the mean, median, standard deviation, percentiles, and range were used, while a P-value was set at 0.05 to test significance.
Results
Average macular thickness and total macular volume were larger in males compared to females. With each year of increasing age, these variables decreased by 0.556 μm and 0.0156 mm3 for average macular thickness and total macular volume, respectively. The macular thickness was greatest in the inner superior section and lowest at the center of the fovea. The volume was greatest in the outer nasal section and thinnest in the fovea. The central subfield thickness (r=−0.243, P=0.055) and foveal volume (r=0.216, P=0.09) did not correlate with age.
Conclusion
Males and females differ significantly with regard to macular thickness and macular volume measurements. Reports by other studies that the increase in axial length reduced thickness and volume, were negated by this study which found a positive correlation among axial length, thickness, and volume.
Video abstract
Point your SmartPhone at the code above. If you have a QR code reader the video abstract will appear. Or use:
Introduction
A healthy macula offers the most acute vision and is crucial to tasks with high visual demands. Any disorder – a macular hole or macular edema, for instance – reduces visual acuity. The success of the treatment for these conditions is often determined by the presenting thickness and depends on posttreatment thickness. The conventional practice of assessing the macula for its thickness, involving slit-lamp biomicroscopy, fundus photography, and fluorescein angiography, is less sensitive to subtle changes and is only qualitative,Citation1 and is not a common practice even in developing countries such as Nepal where a more accurate and sophisticated instrument, optical coherence tomography (OCT), is used. OCT, an optical analog of ultrasound,Citation2 is unique on account of its combined features: an objective method of quantitatively determining the macular characteristics,Citation3 ability to produce high resolution and cross-sectional images accurately and precisely,Citation4,Citation5 and yet purely noninvasive; all of which enable diagnosis, management, and monitoring of patients with retinal diseases.
Decision making while comparing the normative population database information stored in the OCT software with results obtained from the population under examination in Nepal has the probability to be flawed, as we might have different values for the macular variables compared with the normative database in the software, and hence puts the reliability of the test in question. As a unique study, this aims to determine the normal macular thickness and volume measurements in normal Nepalese eyes.
Materials and methods
Subjects
This cross-sectional, quantitative, and hospital-based study comprised 126 eyes of 28 male and 35 female subjects (mean age, 21.17±6.72 years; age range, 10–37 years). They were recruited between February and December 2013 from the Department of Ophthalmology, Institute of Medicine in Nepal. Ethical clearance approval was obtained from the Institutional Review Board at the Institute of Medicine. The study fully adhered to the tenets of the Declaration of Helsinki. Before their inclusion, informed verbal consent was sought from the subjects who were 18 years or over and from the parents or attendants when the subjects were under 18 years. Sixty-three subjects (126 eyes) diagnosed as having healthy normal eyes following a complete anterior and posterior segment evaluation and refraction, and not having diseases and conditions (diabetes mellitus; hypertension; transplant; autoimmune disease; high intraocular pressure, ie, greater than 21 mmHg; and refractive error, ie, greater than ±0.25 D spherical equivalent) underwent a fast mode macular scanning with the commercially available spectral domain (SD) OCT (Spectra lis HRA + OCT; Heidelberg Engineering, Inc., Heidelberg, Germany) immediately after retinoscopy was carried out by an optometrist when the pupils were still dilated (>5 mm diameter). The basic working principles have already been explained in great detail.Citation6,Citation7 The scan was performed over a 6×6 mm2 area in the posterior pole to achieve a high quality image. The subjects were asked to focus on the target. The center point of each scan direction represented minimum foveal thickness (central minimum thickness, or foveola).Citation8 A traditional Early Treatment Diabetic Retinopathy Study (ETDRS) grid which contains three concentric rings of diameters 1, 3, and 6 mm, and two reticules to divide the macula into nine sections was employed. Scanning results were then analyzed by using the OCT Version 5.6.4 software. Any obscure images and artifacts were not considered. Axial length measurements were taken using an ultrasound A-scan biometer (Axis-II PR; Quantel Medical, Inc., Clermont-Ferrand, France).
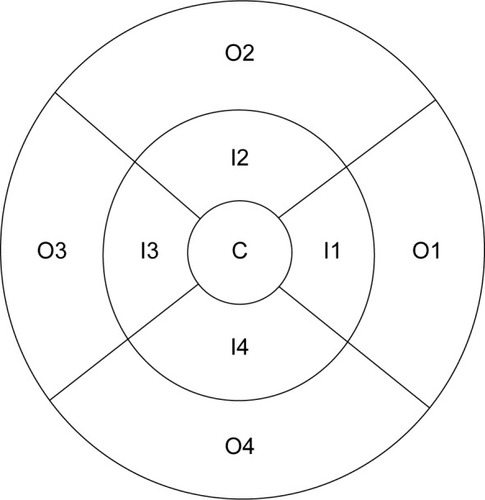
Central subfield thickness (CST), also known as foveal thickness, was defined as the average thickness of the macula in the central 1 mm ETDRS grid.Citation9,Citation10 Average macular thickness was defined as the mean of thicknesses in nine sections.Citation11 Macular volume was defined as the sum of all volumes of all nine sections. The grid is shown in .
Figure 1 The ETDRS plot of macular topography containing variables and statistics for nine sections represented in the alphanumeric form in which the alphabets C, I, and O, respectively, define the central macula, inner macula, and outer macula, and each number uniquely defines one of the remaining eight sections.
Statistical analysis
All data were entered into EpiData v3.1 (The EpiData Association, Odense, Denmark) and, then for analysis, were exported to SPSS version 20 (IBM Corporation, Armonk, NY, USA). The Shapiro–Wilk test (P>0.05) was used to test the normality of the distribution.Citation12,Citation13 A Student’s t-test and one-way analysis of variance (for approximately normally distributed data) and Mann–Whitney U-test and Kruskal–Wallis test (for skewed data) were used to generate P-values between groups. A regression model was used to assess any correlation between 1) age and axial length, 2) age and macular thickness, 3) age and macular volume, 4) axial length and macular thickness, 5) axial length and macular volume, and 6) macular thickness and macular volume.
Results
The results were obtained from 126 eyes of 63 subjects. The age distribution of participants as shown in was based on Sturges’ formula and followed an approximately normal distribution curve (P=0.194 and 0.333 for males and females, respectively). The measures of central tendency involved the mean and/or the median, depending on the distribution of data. The statistics of the macular thickness section-wise are shown in and .
Table 1 Age distribution of participants
Table 2 Macular thickness measurements (μm) (right eyes, n=63)
Table 3 Macular thickness measurements (mm) (left eyes, n=63)
The average macular thickness was higher in males than in females (U=334, P=0.031, right eyes; t (61) =2.094, P=0.04, left eyes) ( and ). Using the Wilcoxon signed-ranks test, we observed that the right and the left eyes differed significantly over inner temporal thickness (P=0.007), inner superior thickness (P=0.019), and outer nasal thickness (P=0.001).
Table 4 Statistics of the macular measurements, for right eyes of all subjects, with subdivision into males and females
Table 5 Statistics of the macular measurements, for left eyes of all subjects, with subdivision into males and females
Only total macular volume (P=0.007), inner superior volume (P=0.000), and outer nasal volume (P=0.007) were different between the right and the left eyes. Also, intersex variability in the left eyes was observed to be the same as that of the right eyes for macular volume measurements ( and ).
Table 6 Macular volume measurements (mm3) (right eyes, n=63)
Table 7 Statistics of the macular volume measurements, for right eyes of all subjects, with subdivision into males and females
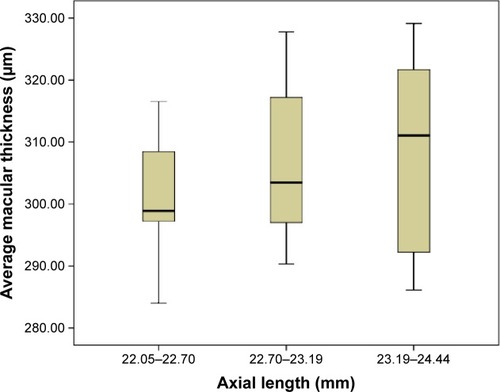
Unless otherwise stated, the values will pertain to right eyes only. Upon comparing three axial length groups (22.05–22.70 mm, 22.70–23.19 mm, and 23.19–24.44 mm), the average macular thickness (Kruskal–Wallis test, P=0.202) () and macular volume measurements (Kruskal–Wallis test, P=0.543) were not statistically different.
Figure 2 The box-and-whisker’s plots showing distribution of average macular thickness by the axial length group.
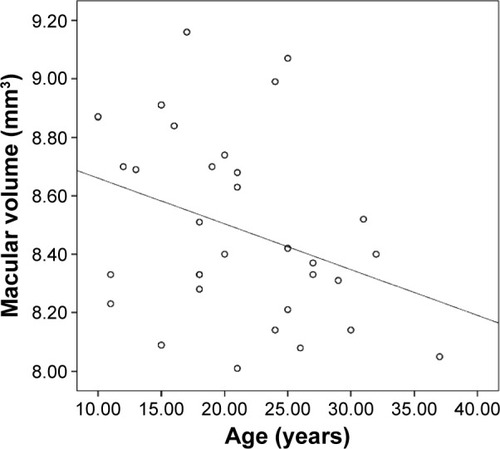
Average macular thickness and macular volume correlated with each other (r=0.944, P=0.000). Average macular thickness (r=−0.30, P=0.017) and macular volume (r=−0.335, P=0.007) negatively correlated with age ( and ). Macular thickness and macular volume decreased by 0.556 μm and 0.0156 mm3, respectively, for each year of increasing age. Age significantly correlated with central minimum thickness (r=−0.342, P=0.006). However, CST and foveal volume (r=0.216, P=0.09) did not significantly correlate with age (r=−0.243, P=0.055). Macular thickness and volume increased with axial length; however, not all sections had a significant correlation. Nevertheless, the correlation study showed that the average macular thickness (r=0.254, P=0.044), CST (r=0.363, P=0.003), and foveal volume (r=0.387, P=0.002) increased with axial length. Total macular volume did not correlate with axial length (r=0.178, P=0.163).
Figure 3 Scatterplot of average macular thickness versus age.
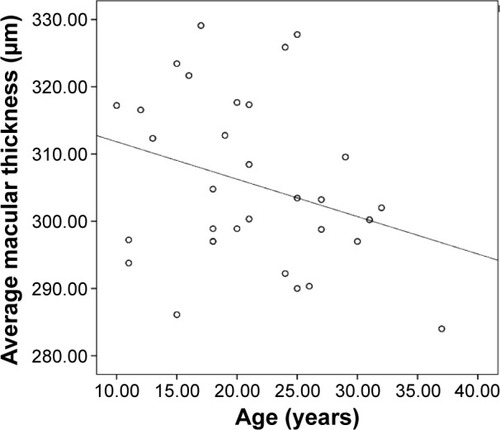
Figure 4 Scatterplot of total macular volume versus age.
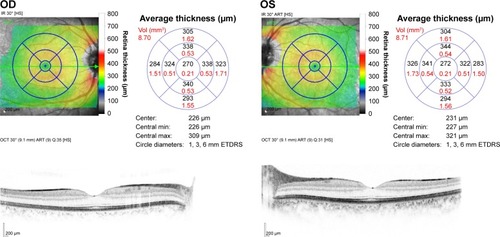
The upper limits of the average macular thickness and CST never overshot 330 and 287 μm, respectively. The thinnest region was within the central section and measured only 180 μm, while the thickest region was the inner superior section, which measured as high as 372 μm. The nasal sections were thicker than the temporal sections. The outer sections were significantly relatively thin compared with inner sections. For both the right and left eyes, the central maximum thickness carried the smallest P-value to show the difference in thickness between males and females. Except for the inner nasal volume in the inner macula, and the outer nasal volume and outer inferior volume in the outer macula, all other volumes decreased significantly with age. is the OCT report of two eyes of one of our subjects.
Figure 5 The optical coherence tomography report of the maculae of right and left eyes.
Discussion
Used as a diagnostic and monitoring tool for vitreomacular disorders, SD-OCT on account of increased scan resolution and reliability, is becoming increasingly useful. Unlike time domain-OCT (TD-OCT) with an axial resolution of ~10 μm, SD has an increased axial resolution of ~5 μm. More information on axial resolution and image acquisition protocols of various commercially available OCT instruments can be found elsewhere.Citation14 The increase in resolution, which is a cutting-edge technology, makes possible the visualization of even imperceptible pathologic changes and helps with much better clinical use.
Similar previous study resultsCitation10,Citation11,Citation14–Citation20 involved either SD-OCT or TD-OCT or both in healthy eyes with refractive error.
This study is unique because 1) it involved only healthy emmetropic eyes undergoing SD-OCT (Spectralis HRA + OCT, Heidelberg Engineering Inc.) and 2) it is of a maiden kind. We cannot therefore claim to accurately compare the findings from similar studies with those from the current study. One of the reasons for discrepancy is the difference in the domain. TD-OCT marks the inner–outer segment interface as the posterior retinal boundary, while SD-OCT generally marks the retinal pigment epithelium as the posterior surface. In light of this, TD-OCT underestimates the thickness and volume measurements by 50–60 μm.Citation21 In the same vein, the type of SD-OCT used in this study uses the Bruch’s membrane as the posterior boundary, and hence there is an additional increased 20 μm thickness compared to SD-OCT in general.Citation15,Citation16 Other sources of discrepancy include, but are not limited to, ethnicity variation and scan (radial versus linear). This, therefore, calls for exercising caution while comparing the data obtained from different studies.
We tabulated data of right and left eyes because we cannot deny that anatomical differences may exist between two eyes, and we believe normative data of right and left eyes separately help in comparing corresponding eyes. In addition, this study serves as a pool of data for the Nepalese population, which will be used for comparison with findings from future studies to be conducted in Nepal and abroad.
This study is in line with an earlier studyCitation17 that reported 1) a significant correlation between age and minimum foveal thickness and 2) no significant correlation between age and CST. CST bears no correlation with age.Citation18 On the contrary, studiesCitation22,Citation23 reported a relationship of CST with age. The finding from a studyCitation22 that foveola does not thin with age is countered by our study while the same study had a finding of parafoveal attenuation consistent with ours.
Similar to previous studies,Citation11,Citation19,Citation24–Citation27 the average macular thickness was significantly greater in males compared to females. In contrast, studiesCitation9,Citation15 reported no difference in retinal thickness between males and females. The fact that thickness and volume measurements were almost always greater for males than for females could be explained by the smaller, thinner physique of females. Further studies are required of the Nepalese eyes to demonstrate differences, if any, in ocular biometry between male and female eyes. Average macular thickness observed in this study was different from other studies, with measurements ranging from 258 to 300 μm reported by studies.Citation10,Citation18,Citation28 Based on studies,15,19,20,26,27,29–31 our understanding is that ethnicity has an effect on macular thickness, for we have observed higher values for almost every macular region. We side with Chauhan and MarshallCitation32 on the effect of much darker pigmentation of the retinal pigment epithelium on the light signal, which is rendered attenuated, leading to reduced retinal thickness in African Americans.
In line with one study,Citation11 where the male foveae measured significantly thicker than the female foveae, our study findings are consistent with previous findings that inner regions are thicker than outer ones, which are thicker than CST. Nevertheless, there is a debate over which of the inner four sections measures thickest. StudiesCitation33,Citation34 reported maximal thickness in the superior and inferior regions, which could be attributed to the papillomacular bundle course along these regions. However, recent reports remain divided. Some reportsCitation10,Citation11,Citation16,Citation17 mentioned the inner nasal section as the thickest region, which is in keeping with the dense ganglion nerve fiber layer in the nasal section. Quite the opposite, reportsCitation20,Citation35–Citation37 and our study showed that the inner superior region was the thickest of all. Just as a studyCitation17 had reported, the intersex difference in thickness in the outer regions and inner nasal region was not observed, while a significant difference was observed in relation to the rest of the regions. This could indicate that the sex-wise variation occurs predominantly more toward the center of the macula. This variation of thickness between males and females may account for a female preponderance in macular hole.Citation38,Citation39 The studyCitation40 done in Nepal also reported a female preponderance. CST obtained in our study differs By ~3 to 31 μm from that obtained in the literatureCitation11,Citation16,Citation37 which used SD-OCT, whereas CST was thicker by ~35 to 60 μm upon comparing this study and the literature,Citation10,Citation17,Citation20,Citation37 which used TD-OCT. Our study therefore reports larger values for almost all nine sections compared to other studies with the exception of one study,Citation11 which reports a value less by 3.68 μm.
Minimum foveolar thickness was not statistically different between males and females, and the range of mean minimum foveolar thicknesses spanned from 149 to 182 μm.Citation10,Citation17,Citation20,Citation37 However, our study reports a larger value and an intersex difference.
The studiesCitation11,Citation16 that reported smaller macular thickness in all nine regions in comparison with our study had mean total macular volumes of 9.95±0.49 mm3 and 10.01±0.6 mm3, respectively. In addition, one studyCitation24 that reported all nine thinner regions except the fovea which was thicker had a mean total macular volume of 9.74±0.71 mm3. Interestingly enough, the macular volume in our study was smaller. Nevertheless, this statistics was larger than other studies.Citation17,Citation19 ReportsCitation11,Citation17,Citation24 that males had greater macular volume compared to females are consistent with our study. All inner sections, except for the inner superior section, differed between males and females.Citation17 The same observation was observed in this study. Our study and a previous studyCitation17 agreed that outer nasal volume is greatest and foveal volume is lowest. The increase in axial length was associated with decreased retinal thickness and volume.Citation36 In contrast, we observed an increase in thickness and volume. Such an observation could be limited to emmetropes only and once ametropia occurs, our understanding of the relationship of axial length with thickness and volume may not apply. We therefore hypothesize that some other retinal changes might follow, which can bring about anatomical changes.
We recruited participants from an age group of 10–37 years because in children under ten, biometry and OCT measurements were difficult to obtain as the children remained uncooperative, while in participants over 40, cataract (however mild it may be), undiagnosed diabetes mellitus, and systemic hypertension could be present. A small sample size should not deter us from interpreting and generalizing our findings because OCT is a highly reliable and reproducible sophisticated technology. Nonetheless, a small sample size, the OCT model, and acquisition protocol may have given rise to discrepancy. This study does not take into account healthy eyes with refractive error. Even so, this study will be enormously useful for it is unique.
Conclusion
By providing a pool of normative data of the macular measurements, this study will help differentiate a healthy macula from a diseased one, and assist with diagnosis, monitoring, and management of macular diseases, and aid similar studies in the future.
Disclosure
The authors report no conflicts of interest in this work.
References
- ShahidiMOguraYBlairNPRusinMMZeimerRRetinal thickness analysis for quantitative assessment of diabetic macular edemaArch Ophthalmol19911098111511191867554
- FujimotoJGDrexlerWMorgnerUKärtnerFIppenEOptical coherence tomography: high resolution imaging using echoes of lightOpt Photonics News20001112431
- HeeMRPuliafitoCAWongCQuantitative assessment of macular edema with optical coherence tomographyArch Ophthalmol19951138101910297639652
- KoozekananiDRobertsCKatzSEHerderickEEIntersession repeatability of macular thickness measurements with the Humphrey 2000 OCTInvest Ophthalmol Vis Sci20004161486149110798667
- MassinPVicautEHaouchineBErginayAPaquesMGaudricAReproducibility of retinal mapping using optical coherence tomographyArch Ophthalmol200111981135114211483079
- NassifNCenseBHyle ParkBIn vivo human retinal imaging by ultrahigh-speed spectral domain optical coherence tomographyOpt Lett200429548048215005199
- ChomaMSarunicMYangCIzattJSensitivity advantage of swept source and Fourier domain optical coherence tomographyOpt Express200311182183218919466106
- ChanADukerJSA standardized method for reporting changes in macular thickening using optical coherence tomographyArch Ophthalmol2005123793994316009835
- SullACVuongLNPriceLLComparison of spectral/Fourier domain optical coherence tomography instruments for assessment of normal macular thicknessRetina201030223519952997
- ChanADukerJSKoTHFujimotoJGSchumanJSNormal macular thickness measurements in healthy eyes using Stratus optical coherence tomographyArch Ophthalmol2006124219319816476888
- FaghihiHFaghihiSGhassemiFMeasurement of normal macular thickness using cirrus optical coherence tomography instrument in Iranian subjects with normal ocular conditionIran J Ophthalmol2013252107114
- ShapiroSSWilkMBAn analysis of variance test for normality (complete samples)Biometrika1965591611
- RazaliNMWahYBPower comparisons of Shapiro-Wilk, Kolmogorov-Smirnov, Lilliefors and Anderson-Darling testsJ Statist Model Analyt2011212133
- Wolf-SchnurrbuschUEKCeklicLBrinkmannCKMacular thickness measurements in healthy eyes using six different optical coherence tomography instrumentsInvest Ophthalmol Vis Sci20095073432343719234346
- GroverSMurthyRKBrarVSChalamKVComparison of retinal thickness in normal eyes using Stratus and Spectralis optical coherence tomographyInvest Ophthalmol Vis Sci20105152644264720007831
- SongAPWuXYWangJRLiuWSunYYuTMeasurement of retinal thickness in macular region of high myopic eyes using spectral domain OCTInt J Ophthalmol20147112224634877
- TewariHKWaghVBSonyPVenkateshPSinghRMacular thickness evaluation using the optical coherence tomography in normal Indian eyesIndian J Ophthalmol200452319915510458
- LiuTHuAYKainesAYuFSchwartzSDHubschmanJ-PA pilot study of normative data for macular thickness and volume measurements using Cirrus high-definition optical coherence tomographyRetina20113191944195021499190
- DuanXRLiangYBFriedmanDSNormal macular thickness measurements using optical coherence tomography in healthy eyes of adult Chinese persons: the Handan Eye StudyOphthalmology201011781585159420472290
- WuPCChenYJChenCHAssessment of macular retinal thickness and volume in normal eyes and highly myopic eyes with third-generation optical coherence tomographyEye200822455155517464309
- KakinokiMSawadaOSawadaTKawamuraHOhjiMComparison of macular thickness between Cirrus HD-OCT and Stratus OCTOphthalmic Surg Lasers Imaging200940213514019320302
- KanaiKAbeTMurayamaKYoneyaSRetinal thickness and changes with ageJpn J Ophthalmol2002465595596
- AlamoutiBFunkJRetinal thickness decreases with age: an OCT studyB J Ophthalmol2003877899901
- SongWKLeeSCLeeESKimCYKimSSMacular thickness variations with gender, age, and axial length in healthy subjects, a spectral domain optical coherence tomography studyInvest Ophthalmol Vis Sci2010 iovs-09
- WongACMChanCWNHuiSPRelationship of gender, body mass index, and axial length with central retinal thickness using optical coherence tomographyEye(Lond)200519329229715258609
- KeltyPJPayneJFTrivediRHKeltyJBowieEMBurgerBMMacular thickness assessment in healthy eyes based on ethnicity using Stratus OCT optical coherence tomographyInvest Ophthalmol Visual Sci20084962668267218515595
- KashaniAHZimmer-GallerIEShahSMRetinal thickness analysis by race, gender, and age using Stratus OCTAm J Ophthalmol2010149349650220042179
- MenkeMNDabovSSturmVComparison of three different optical coherence tomography models for total macular thickness measurements in healthy controlsOphthalmologica2008223635235619571601
- El-AshryMHegdeVJamesPPagliariniSAnalysis of macular thickness in British population using optical coherence tomography (OCT): an emphasis on interocular symmetryCurr Eye Res200833869369918696345
- HuynhSCWangXYRochtchinaEMitchellPDistribution of macular thickness by optical coherence tomography: findings from a population-based study of 6-year-old childrenInvest Ophthalmol Vis Sci20064762351235716723444
- AsefzadehBCavalleranoAAFischBMRacial differences in macular thickness in healthy eyesOptom Vis Sci20078410E941E945
- ChauhanDSMarshallJThe interpretation of optical coherence tomography images of the retinaInvest Ophthalmol Vis Sci199940102332234210476800
- HeeMRPuliafitoCADukerJSTopography of diabetic macular edema with optical coherence tomographyOphthalmology199810523603709479300
- MassinPErginayAHaouchineBMehidiABPaquesMGaudricARetinal thickness in healthy and diabetic subjects measured using optical coherence tomography mapping softwareEur J Ophthalmol200112210210812022281
- XieRZhouX-TLuFCorrelation between myopia and major biometric parameters of the eye: a retrospective clinical studyOptom Vis Sci2009865E503E50819349927
- LuoH-DGazzardGFongAMyopia, axial length, and OCT characteristics of the macula in Singaporean childrenInvest Ophthalmol Vis Sci20064772773278116799013
- LeungCK-SCheungCY-lWeinrebRNComparison of macular thickness measurements between time domain and spectral domain optical coherence tomographyInvest Ophthalmol Vis Sci200849114893489718450592
- EvansJRSchwartzSDMcHughJDASystemic risk factors for idiopathic macular holes: a case-control studyEye (Lond)19981222562599683950
- Eye Disease Case-Control StudyGRisk factors for idiopathic rhegmatogenous retinal detachmentAm J Epidemiol199313777497578484366
- ThapaRPaudyalGAnatomical and visual outcome following macular hole surgery at a Tertiary Eye Care Centre in NepalJ Nepal Med Assoc201151183122127