
Abstract
In recent years, advanced diagnostic instruments have become widely available in optometric practices, offering various functions that optimize clinical information gathering. This article focuses on the Medmont Meridia™, a state-of-the-art multipurpose diagnostic device with corneal topography and cutting-edge features. Corneal topography is pivotal in the early diagnosis of corneal disorders, determining baseline ocular surface assessment, helping in contact lens fitting, and monitoring ocular health over time. The Medmont Meridia boasts Placido-disc-based imaging with extensive corneal coverage. Furthermore, the Meridia accurately measures the horizontal visible iris diameter, pupil diameter, and palpebral fissure width, which assists in making contact lens parameter decisions. Additionally, it offers sagittal height data for scleral lens design and first lens selection, streamlining the fitting process. Beyond its topography capabilities, the Meridia excels as a comprehensive dry eye assessment tool. With features like tear meniscus height, tear film surface quality, and meibography capabilities, it aids in diagnosing dry eye and monitoring its progression. The device also provides customizable dry eye reports with integrated grading scales and questionnaires, making dry eye management, patient education, and compliance more accessible. In conclusion, the Medmont Meridia consolidates a multitude of examination tools in a single instrument, enhancing practice efficiency and elevating patient care and communication. Its versatility and accuracy make it an invaluable asset in optometric practices worldwide.
Introduction
Advanced, multi-functional diagnostic devices have only become widely available within optometric practices over the last few years.Citation1 These devices undertake a variety of functions, providing savings in physical space, cost, and time to gather clinical information. Many of these instruments include the assessment of corneal topography.
Corneal topography is fundamental to the early diagnosis of a variety of corneal disorders (notably keratoconus),Citation2–4 to examine and document the baseline ocular surface before contact lens fitting,Citation5 to determine the ocular surface shape, curvature, sagittal height, and corneal power and thickness,Citation6 to optimize contact lens fitting,Citation3 and to monitor ocular health over time.Citation5 Prior to the development of topography, the corneal shape was measured with the keratometer, limiting the information obtained to the central 3–4 mm only. Corneal mapping has now evolved through the development of videokeratography and has expanded from simply mapping the corneal profile to assessing a wide variety of ocular surface characteristics.
Topographers are broadly classified into two main categories, Placido-disc based systems, and elevation systems. Placido-disc systems project a series of concentric light rings on the cornea, capture the image of the reflected rings, and analyze the data along the rings.Citation1,Citation7,Citation8 By measuring the distance between the rings and their relationship with each other, these topographers provide accurate information on the anterior surface, such as corneal curvature and tear layer quality.Citation3,Citation5,Citation7–11 Two types of Placido-disc systems are available, small and large-cone. Compared to large-cone topographers, small-cone units use a shorter working distance and project a greater number of rings on the cornea. Elevation systems use a light ray to directly measure the elevation of the anterior and posterior surfaces, generating corneal pachymetry across the entire cornea. They provide corneal curvature of both anterior and posterior corneal surfaces based on the elevation data using sophisticated algorithms.Citation12
The Medmont Meridia™ (Medmont International Pty Ltd; VIC, Australia) is a relatively new multipurpose diagnostic device containing a Placido-disc-based, small-cone topographer. In addition to measuring corneal topography, the Meridia Professional modelCitation13–15 includes a variety of useful imaging options and acts as a dry eye assessment tool, with tear film analysis and meibomian gland (MG) evaluation, resulting in an instrument that has a wide variety of clinical uses ().
Table 1 Examination Tools Available in the Medmont Meridia™
Corneal Topography Assessments
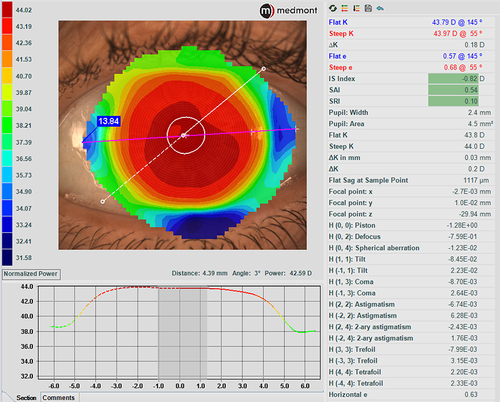
A major advantage for Medmont topographers relates to the extensive corneal coverage of the Placido-disc imaging due to the small cone head size, which typically provides data up to a chord length of 10–11 mm, which is larger than the typical range of 6mm to 10mm for Placido imaging of the cornea, depending on the specific instrument being used (). This area may be further extended to the edge of the sclera by capturing five images in different gaze directions and stitching them into one image, creating a composite topography image (), which can be valuable when fitting scleral lenses.
Figure 1 Topography analysis covering the entire cornea in (A) (11.14mm) and up to a chord length of 11.47mm in (B).
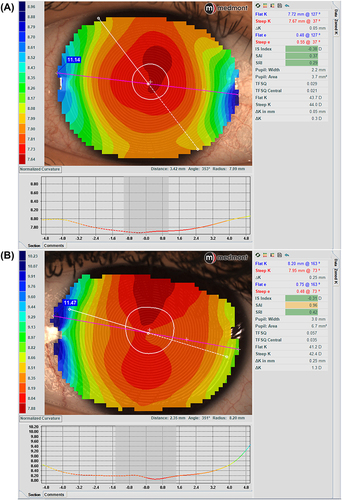
Figure 2 Composite topography covering up to chord length of 13.84 mm.
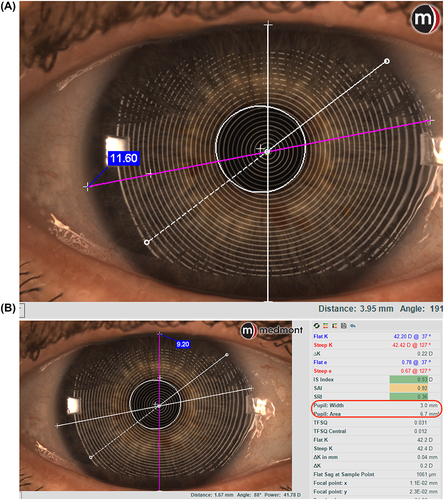
The corneal topography data also permits accurate measurement of the horizontal visible iris diameter (HVID), pupil diameter, and palpebral fissure width, all of which provide assistance with contact lens parameter decisions ().
Figure 3 Measurement of HVID (A) and palpebral aperture (B). In (B), on the right, information about the pupil is also provided.
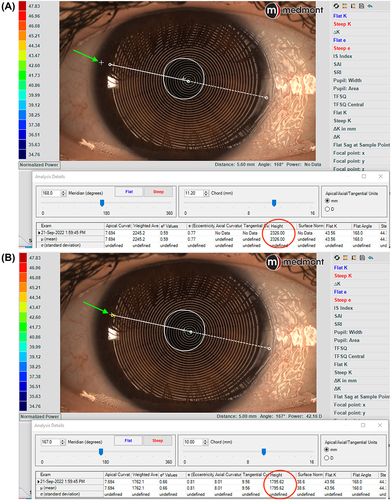
For scleral lens design and first lens selection, the Meridia provides the sagittal height of the cornea at a certain chord length (). This value can be used to calculate the sagittal height of the first diagnostic scleral lens, avoiding the application of multiple lenses on the eye, and reducing the time needed to fit the lens.
Figure 4 Ocular sagittal height at 11.20 mm chord, shown by the white cross close to the limbus on image (A), and at 10.00mm with the cross moving inside the corneal area (B). The green arrow indicates the position of the white cross in both figures.
A subtraction map, also called a difference map, is also available. This map subtracts previous map data from a more recent one to show differences in corneal shape and power changes over time (). A subtraction map is important to display corneal flattening after refractive surgery, to monitor keratoconus advancement and locate the cone position changes, and in ortho-k treatments, to determine the changes that occur after lens wear. The Medmont Meridia also helps clinicians to diagnose corneal abnormalities through the in-built disease detection indices (IS index, SAI, SRI). This is particularly helpful when communicating with patients interested in refractive surgery, which might be contraindicated, or in monitoring other corneal disease states over time and determining if crosslinking is indicated in patients with keratoconus.Citation3
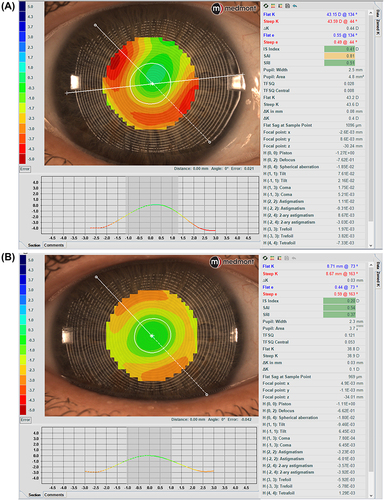
Besides the typical topography maps, the Meridia provides multiple maps displaying high-order aberration (HOA) distribution (Zernike fit, Ray Error, Wavefront Error) and tear film analysis (tear film quality and break-up). Measuring baseline corneal HOAs and then obtaining topography data over a corneal or scleral lens provides information on whether a lens may compensate for some HOAs when applied to the eye ().Citation16 It can also be used to assess HOAs post-removal of an ortho-k lens, especially spherical aberrations, and coma.Citation17
Figure 5 The subtraction map (the larger map) was obtained by subtracting the pre-ortho-k map (upper left) from the post-ortho-k map (lower left). (A) Tangential maps. (B) Axial maps. The subtraction maps show the changes after 7 consecutive nights of lens wear. Images courtesy of Randy Kojima & Patrick Caroline, Pacific University.
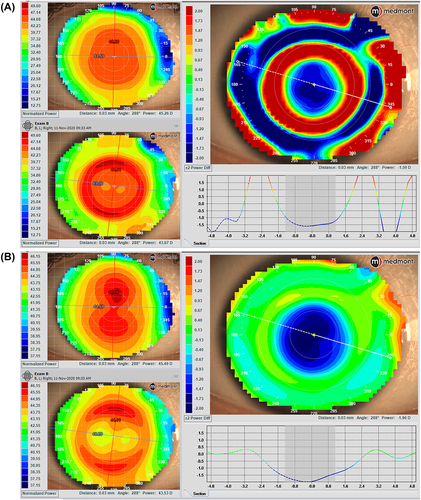
Figure 6 Wavefront Error Zernike Fit maps to measure baseline (A) and over a scleral lens (B) HOAs, detecting any variation or compensation.
Lens Fitting Simulation and Design
The contact lens module includes various lens designs that allow a corneal, ortho-k, and scleral lens fitting simulation over the captured topography image (). The lens simulation program allows a more rapid and appropriate selection of the first diagnostic set and reduces the number of lenses applied to the eye.Citation5,Citation18 Additionally, the lens fitting simulation software enables the practitioner to make adjustments to the lens design while comprehending the effects of individual modifications on other parameters. All images and topographies saved in the same patient’s file can be sent directly to the manufacturing lab, where lab consultants can assist clinicians in the lens fitting process and make appropriate changes to the lens design. Lens simulation from different designs available in the software and the free-form option also allow for an empirical fitting, providing a customized contact lens for each eye. One notable advantage of the Medmont Meridia is its coverage of up to approximately 14 mm. This extended range provides precise data for corneal lens fitting, especially in the mid and peripheral regions of the cornea, as well as for scleral lens parameters.
Figure 7 Ortho-k (A) and scleral lens (B) fitting simulation.
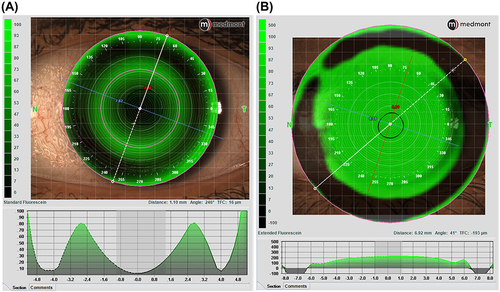
Image and Video Capturing with Diffuse Illumination
A feature of the Medmont Meridia Professional model is the ability to capture high-quality images and videos of the eye with diffuse illumination in white light and cobalt blue light for fluorescein evaluation.
White Light Image Capture
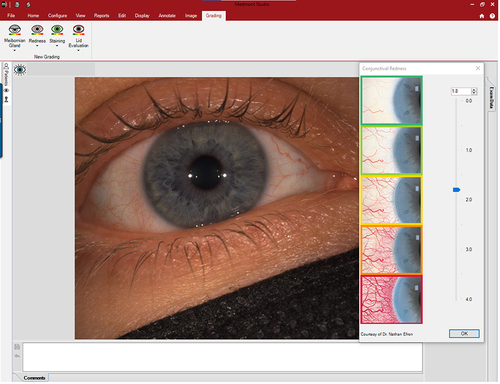
The image capture option using diffuse illumination with white light is crucial to document baseline findings, assess lens fitting (), and monitor changes to the ocular surface over time. Clinicians may use the integrated grading scales for the observed clinical signs during the eye examination and photo capturing (). Recording the findings with the incorporated grading scales is valuable for monitoring changes during the follow-up visits and generating clinical reports. The video recording option provides dynamic evaluations of blinking, tear film distribution and quality, and lens centration and movement on the eye.
Figure 8 Assessment of a diagnostic scleral lens fit.
Figure 9 Image capture to document baseline findings. The Efron grading scaleCitation19–21 is used to grade eye redness.
Cobalt Blue Image Capture
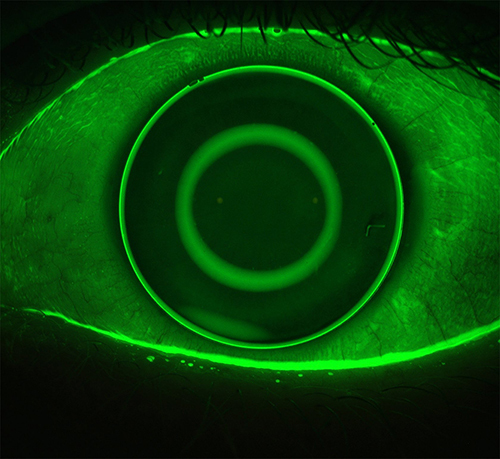
It is also possible to take images and videos using the cobalt blue light integrated into the topographer’s cone. Following the instillation of fluorescein, this capture capability is important to document baseline ocular surface staining, assist with fitting corneal, ortho-k, and scleral lenses and monitor ocular health during the follow-up visits ( and ). The in-built software uses the Efron grading scalesCitation19–23 to grade staining and the BHVI (formerly CCLRU) scalesCitation20,Citation22,Citation24–26 in the dry eye reports.
Figure 10 Capturing baseline ocular surface staining and grading the degree of corneal staining using the Efron grading scale.
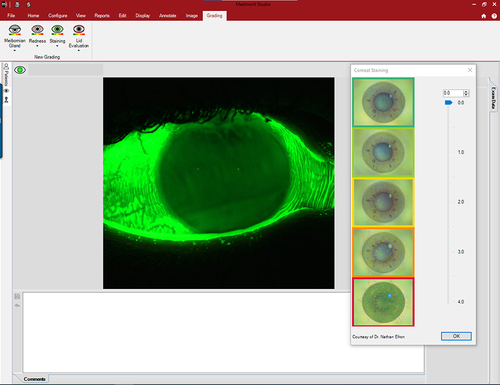
Figure 11 Assessment of an ortho-k lens fit using cobalt blue light and fluorescein. Image courtesy of Randy Kojima & Patrick Caroline, Pacific University.
Dry Eye Assessment Tools
A major development for the Medmont Meridia™ Professional model relates to the provision of a wide array of dry eye assessment tools.
Tear Meniscus Height (TMH)
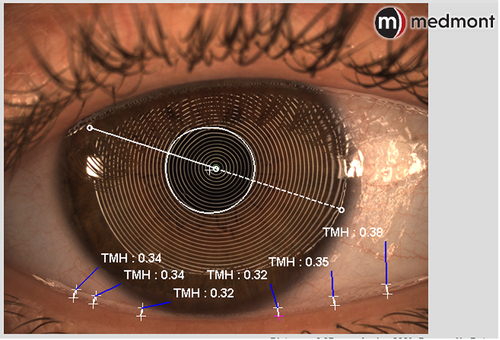
The device can measure upper and lower tear meniscus height (TMH), which is a proxy for tear volume, and has been shown to be helpful in the diagnosis of dry eye ().Citation27 In normal eyes, a TMH is typically 0.2–0.5 mm, and when it is <0.2mm, it is suggestive of dry eye.Citation27–31
Figure 12 Lower tear meniscus height (TMH) measurements. The values are >0.2mm, indicating a normal amount of tears over the ocular surface.
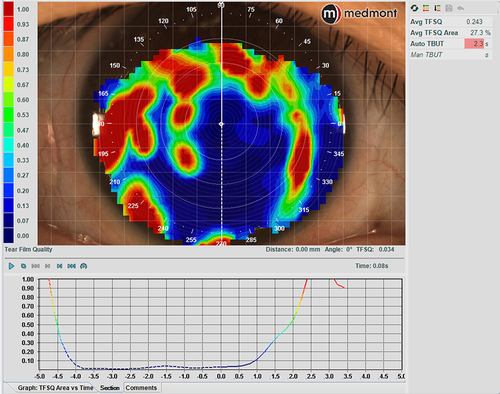
Tear Film Surface Quality (TFSQ)
The Meridia also incorporates the tear film surface quality (TFSQ) value, an automated non-invasive measurement of tear stability derived from dynamic-area high-speed Placido-disc videokeratography.Citation32–37 It has proven to be a valuable marker for diagnosing dry eye relative to a current standard of tear hyperosmolarity.Citation37 The TFSQ measurement allows a better understanding of the tear film quality between blinks and provides the non-invasive tear break-up time (NI-TBUT). This measurement, along with other metrics, can be used to diagnose dry eye and also help with a selection of contact lens modality and material. The TFSQ may be obtained over the cornea to monitor tear film stability over timeCitation32,Citation33,Citation38 and can also be obtained over a contact lens surface to verify if the tear film quality is altered by the lens material fitted ().Citation33,Citation34,Citation39,Citation40
Figure 13 Tear film surface quality (TFSQ) over a scleral lens. The auto tear break-up time (TBUT) values on the top right of the screen are highlighted in red, indicating a critical dry surface condition.
Meibography
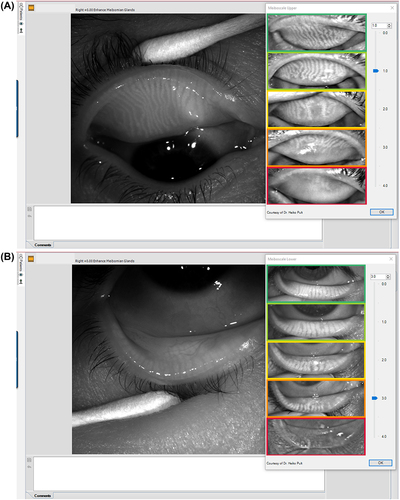
Meibography provides an image of the morphology of the meibomian glands (MG) and is valuable in the diagnosis of meibomian gland dysfunction (MGD).Citation41–46 It has been shown that age and dry eye disease are correlated to MG structural and functional alterations.Citation47 Additionally, MG changes have been associated with contact lens wear; the duration of contact lens wear has been significantly correlated to MG morphological and functional changes that become apparent within the first two years of lens wear.Citation45,Citation48–51 The Medmont Meridia Professional model uses infrared light to image the MG, and uses an integrated grading scale (Meiboscale) to grade the findings ().Citation27,Citation43,Citation52–54
Figure 14 Upper (A) and lower (B) meibography using the meiboscale to grade the meibomian glands. Meiboscale is property of Dr. Heiko Pult.Citation54 Enhance Meibomian Glands function was used to enhance the visibility of the glands.
In addition to the meiboscale, a variety of other grading scales are integrated into the Meridia software system to grade the various captured images (see , ). These provide the capability to grade the meibomian gland images,Citation43,Citation52–54 assess the degree of MGD (Efron),Citation19,Citation21 grade conjunctival hyperemia (using both EfronCitation19–21,Citation23 and BHVI scalesCitation20,Citation24), record ocular surface staining (corneal via EfronCitation19–23 and BHVI scales;Citation20,Citation22,Citation24–26 conjunctival staining via Efron scalesCitation19–23), and finally provide an evaluation of the palpebral conjunctiva (Efron).Citation19–21,Citation23
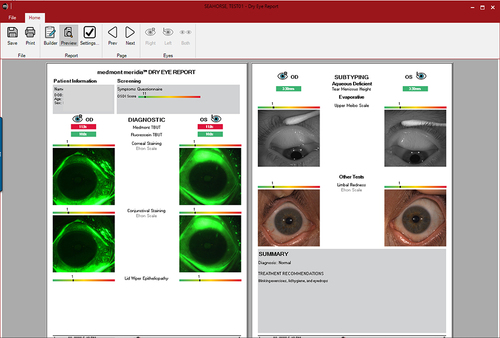
One final dry eye tool is the Dry Eye Report. The in-built software allows customization of a dry eye disease report by including imaging and several pieces of information, including grading scales and dry eye questionnaires such as SPEED, McMonnies, DEQ-5, and OSDI (). The different values are highlighted in green, yellow, or red, depending on the severity of the condition. This is explained in the exported report in a colored bar, where the grading is displayed between the green and red colors (). These reports allow practitioners to improve their communication and education with patients, ultimately leading to better compliance with the recommendations provided.
Figure 15 Building a customized dry eye report by reporting the grading scale values of different clinical signs and the results of questionnaires that have been given to the patient. Various exams are available to select and include in the customized report with different grading scale options.
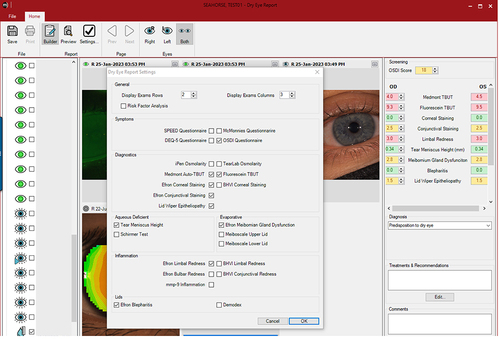
Figure 16 A customized dry eye report presenting the findings in a clear graphic manner.
Conclusion
The Medmont Meridia is a sophisticated multipurpose diagnostic device. The corneal topographer provides very accurate,Citation55 reliable,Citation13 and wide field corneal topography, from limbus to limbus. In addition, new imaging methods within the Meridia Professional model provide a device that can obtain external still and video images, along with a suite of valuable tools for dry eye assessment. The imaging options involve a variety of scans for specific purposes, each requiring different patient instructions. Having such a plethora of examination tools in one instrument increases practice efficiency and enhances the care of patients, their education, and compliance with clinician’s recommendations.
Furthermore, this integration not only saves chair time and space but also proves to be a more economical investment. Like other topographers, accurate results depend on patients’ cooperation in keeping their eyes steady and open during scans, a challenge for some, especially those with severe dry eyes. Expertise is crucial for interpreting the topographer’s data, as misinterpretation can result in inaccurate diagnoses or prescriptions.
Disclosure
The author reports no conflicts of interest in this work.
References
- Jones L, Ng A, Schulze M, Walsh K. Clinical Diagnostic Instruments. In: Efron N, editor. Contact Lens Practice. 4th ed. Elsevier; 2023:357–387.
- Bevara A, Vaddavalli PK. The evolution of diagnostics for keratoconus: from ophthalmometry to biomechanics. Semin Ophthalmol. 2023;38(3):265–274. doi:10.1080/08820538.2022.2152716
- Fan R, Chan TC, Prakash G, Jhanji V. Applications of corneal topography and tomography: a review. Clin Exp Ophthalmol. 2018;46(2):133–146. doi:10.1111/ceo.13136
- Santodomingo-Rubido J, Carracedo G, Suzaki A, Villa-Collar C, Vincent SJ, Wolffsohn JS. Keratoconus: an updated review. Cont Lens Anterior Eye. 2022;45(3):101559. doi:10.1016/j.clae.2021.101559
- Walker M. Mapping out corneal topography. Rev Optom. 2017;154(8):60–64.
- Young G, Schnider C, Hunt C, Efron S. Corneal topography and soft contact lens fit. Optom Vis Sci. 2010;87(5):358–366. doi:10.1097/OPX.0b013e3181d9519b
- Binder PS. Videokeratography. CLAO J. 1995;21(2):133–144.
- Seitz B, Behrens A, Langenbucher A. Corneal topography. Curr Opin Ophthalmol. 1997;8(4):8–24. doi:10.1097/00055735-199708000-00003
- Swartz T, Marten L, Wang M. Measuring the cornea: the latest developments in corneal topography. Curr Opin Ophthalmol. 2007;18(4):325–333. doi:10.1097/ICU.0b013e3281ca7121
- Read SA, Collins MJ, Iskander DR, Davis BA. Corneal topography with scheimpflug imaging and videokeratography: comparative study of normal eyes. J Cataract Refract Surg. 2009;35(6):1072–1081. doi:10.1016/j.jcrs.2009.01.020
- Kanclerz P, Khoramnia R, Wang X. Current developments in corneal topography and tomography. Diagnostics. 2021;11(8):1466. doi:10.3390/diagnostics11081466
- Belin MW, Khachikian SS. An introduction to understanding elevation-based topography: how elevation data are displayed - A review. Clin Exp Ophthalmol. 2009;37(1):14–29. doi:10.1111/j.1442-9071.2008.01821.x
- Cho P, Lam AK, Mountford J, Ng L. The performance of four different corneal topographers on normal human corneas and its impact on orthokeratology lens fitting. Optom Vis Sci. 2002;79(3):175–183. Erratum in: Optom Vis Sci. doi:10.1097/00006324-200203000-00012
- Gonzalez-Meijome JM, Jorge J, Queiros A, Almeida JB, Parafita MA. A comparison of the ARK-700A autokeratometer and medmont E300 corneal topographer when measuring peripheral corneal curvature. Ophthalmic Physiol Opt. 2004;24(5):391–398. doi:10.1111/j.1475-1313.2004.00203.x
- Chui WS, Cho P. A comparative study of the performance of different corneal topographers on children with respect to orthokeratology practice. Optom Vis Sci. 2005;82(5):420–427. doi:10.1097/01.opx.0000162642.24885.71
- Gumus K, Gire A, Pflugfelder SC. The impact of the Boston ocular surface prosthesis on wavefront higher-order aberrations. Am J Ophthalmol Apr. 2011;151(4):682–690 e2. doi:10.1016/j.ajo.2010.10.027
- Vincent SJ, Cho P, Chan KY, et al. CLEAR - orthokeratology. Cont Lens Anterior Eye. 2021;44(2):240–269. doi:10.1016/j.clae.2021.02.003
- Sindt C, Grout T, Kojima R. Evaluating virtual fitting for keratoconus. CL Spectrum. 2011;26(5):39–43.
- Efron N, Morgan PB, Katsara SS. Validation of grading scales for contact lens complications. Ophthalmic Physiol Opt. 2001;21(1):17–29. doi:10.1046/j.1475-1313.1999.00420.x-i1
- Peterson RC, Wolffsohn JS. Objective grading of the anterior eye. Optom Vis Sci. 2009;86(3):273–278. doi:10.1097/OPX.0b013e3181981976
- Efron N. Grading scales for contact lens complications. Ophthalmic Physiol Opt. 1998;18(2):182–186. doi:10.1016/s0275-5408(97)00066-5
- Begley C, Caffery B, Chalmers R, Situ P, Simpson T, Nelson JD. Review and analysis of grading scales for ocular surface staining. Ocul Surf Apr. 2019;17(2):208–220. doi:10.1016/j.jtos.2019.01.004
- Schulze MM, Hutchings N, Simpson TL. The perceived bulbar redness of clinical grading scales. Optom Vis Sci. 2009;86(11):E1250–8. doi:10.1097/OPX.0b013e3181bb4225
- Terry RL, Schnider CM, Holden BA, et al. CCLRU standards for success of daily and extended wear contact lenses. Optom Vis Sci. 1993;70(3):234–243. doi:10.1097/00006324-199303000-00011
- Sook Chun Y, Park IK. Reliability of 4 clinical grading systems for corneal staining. Am J Ophthalmol. 2014;157(5):1097–1102. doi:10.1016/j.ajo.2014.02.012
- Woods J, Varikooty J, Fonn D, Jones LW. A novel scale for describing corneal staining. Clin Ophthalmol. 2018;12(12):2369–2375. doi:10.2147/OPTH.S178113
- Wolffsohn JS, Arita R, Chalmers R, et al. TFOS DEWS II diagnostic methodology report. Ocul Surf. 2017;15(3):539–574. doi:10.1016/j.jtos.2017.05.001
- Lamberts DW, Foster CS, Perry HD. Schirmer test after topical anesthesia and the tear meniscus height in normal eyes. Arch Ophthalmol. 1979;97(6):1082–1085. doi:10.1001/archopht.1979.01020010536004
- Savini G, Barboni P, Zanini M. Tear meniscus evaluation by optical coherence tomography. Ophthalmic Surg Lasers Imaging. 2006;37(2):112–118. doi:10.3928/1542-8877-20060301-06
- Miller WL, Doughty MJ, Narayanan S, et al. A comparison of tear volume (by tear meniscus height and phenol red thread test) and tear fluid osmolality measures in non-lens wearers and in contact lens wearers. Eye Cont Lens. 2004;30(3):132–137. doi:10.1097/01.icl.0000138714.96401.2b
- Srinivasan S, Chan C, Jones L. Apparent time-dependent differences in inferior tear meniscus height in human subjects with mild dry eye symptoms. Clin Exp Optom. 2007;90(5):345–350. doi:10.1111/j.1444-0938.2007.00174.x
- Alonso-Caneiro D, Turuwhenua J, Iskander DR, Collins MJ. Diagnosing dry eye with dynamic-area high-speed videokeratoscopy. J Biomed Opt. 2011;16(7):076012. doi:10.1117/1.3598837
- Szczesna-Iskander DH, Iskander DR, Read SA, Alonso-Caneiro D. Noninvasive in vivo assessment of soft contact lens type on tear film surface quality. Invest Ophthalmol Vis Sci. 2012;53(1):525–531. doi:10.1167/iovs.11-8257
- Tyagi G, Alonso-Caneiro D, Collins M, Read S. Tear film surface quality with rigid and soft contact lenses. Eye Cont Lens. 2012;38(3):171–178. doi:10.1097/ICL.0b013e31824da99c
- Szczesna-Iskander DH. Comparison of tear film surface quality measured in vivo on water gradient silicone hydrogel and hydrogel contact lenses. Eye Cont Lens. 2014;40(1):23–27. doi:10.1097/ICL.0000000000000008
- Szczesna-Iskander DH, Iskander DR. Tear film dynamics on soft contact lenses. Optom Vis Sci. 2014;91(12):1406–1411. doi:10.1097/OPX.0000000000000416
- Downie LE. Automated tear film surface quality breakup time as a novel clinical marker for tear hyperosmolarity in dry eye disease. Invest Ophthalmol Vis Sci. 2015;56(12):7260–7268. doi:10.1167/iovs.15-17772
- Szczesna DH, Alonso-Caneiro D, Iskander DR, Read SA, Collins MJ. Predicting dry eye using noninvasive techniques of tear film surface assessment. Invest Ophthalmol Vis Sci. 2011;52(2):751–756. doi:10.1167/iovs.10-5173
- Serramito M, Privado-Aroco A, Batres L, Carracedo GG. Corneal surface wettability and tear film stability before and after scleral lens wear. Cont Lens Anterior Eye. 2019;42(5):520–525. doi:10.1016/j.clae.2019.04.001
- Alonso-Caneiro D, Iskander DR, Collins MJ. Tear film surface quality with soft contact lenses using dynamic-area high-speed videokeratoscopy. Eye Cont Lens. 2009;35(5):227–231. doi:10.1097/ICL.0b013e3181b3350f
- Wong S, Srinivasan S, Murphy PJ, Jones L. Comparison of meibomian gland dropout using two infrared imaging devices. Cont Lens Anterior Eye. 2019;42(3):311–317. doi:10.1016/j.clae.2018.10.014
- Srinivasan S, Menzies K, Sorbara L, Jones L. Infrared imaging of meibomian gland structure using a novel keratograph. Optom Vis Sci. 2012;89(5):788–794. doi:10.1097/OPX.0b013e318253de93
- Arita R, Minoura I, Morishige N, et al. Development of definitive and reliable grading scales for meibomian gland dysfunction. Am J Ophthalmol. 2016;169:125–137. doi:10.1016/j.ajo.2016.06.025
- Tomlinson A, Bron AJ, Korb DR, et al. The international workshop on meibomian gland dysfunction: report of the diagnosis subcommittee. Invest Ophthalmol Vis Sci. 2011;52(4):2006–2049. doi:10.1167/iovs.10-6997f
- Arita R, Fukuoka S, Morishige N. New insights into the morphology and function of meibomian glands. Exp Eye Res. 2017;163(163):64–71. doi:10.1016/j.exer.2017.06.010
- Petricek I, Tomic M, Bulum T, Lesin Gacina D, Vidas Pauk S. Meibomian gland assessment in routine ophthalmology practice. Metabolites. 2023;13(2):157. doi:10.3390/metabo13020157
- Nichols KK, Foulks GN, Bron AJ, et al. The international workshop on meibomian gland dysfunction: executive summary. Invest Ophthalmol Vis Sci. 2011;52(4):1922–1929. doi:10.1167/iovs.10-6997a
- Gu T, Du B, Bi H, et al. Meibomian gland dropout, not distortion, can distinguish dry eyes from normal eyes in contact lens wearers. Curr Eye Res. 2020;45(8):897–903. doi:10.1080/02713683.2020.1731829
- Alghamdi WM, Markoulli M, Holden BA, Papas EB. Impact of duration of contact lens wear on the structure and function of the meibomian glands. Ophthalmic Physiol Opt. 2016;36(2):120–131. doi:10.1111/opo.12278
- Na KS, Yoo YS, Hwang HS, Mok JW, Kim HS, Joo CK. The influence of overnight orthokeratology on ocular surface and meibomian glands in children and adolescents. Eye Cont Lens. 2016;42(1):68–73. doi:10.1097/ICL.0000000000000196
- Osae EA, Jones L, Nichols JJ. The impact of contact lenses on meibomian gland morphology. Ocul Surf. 2022;24:148–155. doi:10.1016/j.jtos.2022.04.001
- Schiffman RM, Christianson MD, Jacobsen G, Hirsch JD, Reis BL. Reliability and validity of the ocular surface disease index. Arch Ophthalmol. 2000;118(5):615–621. doi:10.1001/archopht.118.5.615
- Nishant P, Ramawat A, Shrinkhal N, Gupta N, Mittal SK. Correlation of meiboscale symptom score and sign score for primary meibomian gland dysfunction in Indian eyes - A cross-sectional study. Indian J Ophthalmol. 2022;70(6):1958–1962. doi:10.4103/ijo.IJO_10_22
- Pult H. Improved meiboscale for meibography; 2016. Available from: https://wwwheiko-pultde/media/files/MEIBOSCALE-2016--Einseiterpdf. Accessed November 14, 2023.
- Tang W, Collins MJ, Carney L, Davis B. The accuracy and precision performance of four videokeratoscopes in measuring test surfaces. Optom Vis Sci. 2000;77(9):483–491. doi:10.1097/00006324-200009000-00009