
Abstract
The discovery of clinically relevant inhibitors of mammalian target of rapamycin (mTOR) for anticancer therapy has proved to be a challenging task. The quantitative structure–activity relationship (QSAR) approach is a very useful and widespread technique for ligand-based drug design, which can be used to identify novel and potent mTOR inhibitors. In this study, we performed two-dimensional QSAR tests, and molecular docking validation tests of a series of mTOR ATP-competitive inhibitors to elucidate their structural properties associated with their activity. The QSAR tests were performed using partial least square method with a correlation coefficient of r2=0.799 and a cross-validation of q2=0.714. The chemical library screening was done by associating ligand-based to structure-based approach using the three-dimensional structure of mTOR developed by homology modeling. We were able to select 22 compounds from two databases as inhibitors of the mTOR kinase active site. We believe that the method and applications highlighted in this study will help future efforts toward the design of selective ATP-competitive inhibitors.
Background
Mammalian target of rapamycin (mTOR) is a member of a family of serine/threonine kinases involved in the regulation of cell functions, including growth, proliferation, apoptosis, and autophagy,Citation1 and is an attractive target for the development of anticancer therapeutics.Citation2,Citation3
Recently, several structural classes of compounds have been synthesized as mTOR inhibitors, including different scaffolds such as methylpyrido pyrimidinones,Citation4 imidazopyridine and imidazopyridazine,Citation5 quinazoline motif,Citation6 imidazolopyrimidine,Citation7 and sulfonyl-morpholino-pyrimidine.Citation8 Though these mTOR inhibitors bear a certain amount of inhibitory activities, it is still difficult for these agents to obtain desirable characteristics to overcome cancer diseases. As such, developing the potential and selective mTOR inhibitors is still a point of concern as the comprehension of the underlying relationships between the structural variations in the inhibitors and their inhibition capacity of mTOR kinase is a crucial step to identify or to optimize their potency and hence to develop potential drug candidates.
Computational methods (in silico) have been used more and more in the new drug development process, to reduce time and cost by increasing the number of analyzed molecules. This approach finds its place in the early development phases before the preclinical stage, especially in the investigation of physicochemical, pharmacodynamic, and pharmacokinetic properties. Computational methods are diverse with some dynamic approaches, such as molecular dynamic simulation, which is used to predict the macromolecules interactions, especially protein–protein interactions, and for the prediction of the genotype-based phenotype.Citation9–Citation12
The quantitative structure–activity relationship (QSAR) approach establishes a quantitative relationship between chemical structures and their properties.Citation13 In theory, QSAR models can be used to predict the properties of chemical structures provided their structural information is available. In recent years, there had been a growing awareness about QSARs and their applications, especially their use for regulatory purposes. A new European legislation on chemicals – REACH (Registration, Evaluation, Authorization, and restriction of Chemicals) came into force in 2007, allows and encourages the use of QSAR model predictions when the experimental data available are not sufficient.Citation14
QSAR approach which is based on the assumption that the variations in the properties of the compounds can be correlated with changes in their molecular features,Citation15 has become a very useful and largely widespread tool for the prediction of biological activities, particularly in the field of drug design.
In this study, we used the QSAR approach combined with molecular docking studies to determine physicochemical structural properties required for the mTOR inhibition to obtain predictive QSAR models. Our previously three-dimensional (3D) mTOR kinase structure obtained by homology modeling approachCitation16 was used to study the binding mode of the most active compounds by structure-based drug design docking (SBDD) approach. The combined finding from QSAR and SBDD was used to rationalize the inhibition of mTOR kinase and provide guidance to medicinal chemists to identify or optimize new and potent mTOR kinase inhibitors.
Materials and methods
Study design
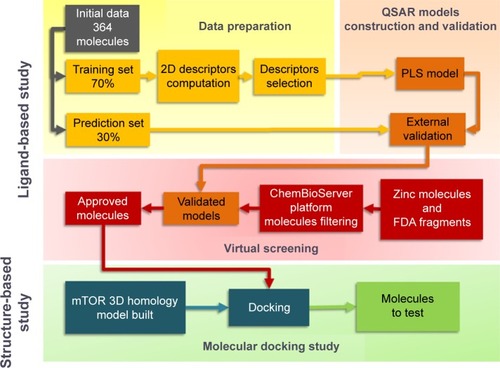
The flowchart in describes the methodology used in this study.
Figure 1 Flowchart for the computational drug design used in this study.
Data set and QSAR study
A QSAR analysis was performed on a data set of 364 molecules with inhibitory activity against mTOR in competition with ATP. Initially known structures of ATP competitive mTOR inhibitors have been selected from the PubChem compound and PubChem BioAssay DataBases on the basis of their IC50 and molecular weight. The QSAR approach was used after calculating descriptors of all molecules.
The data set was randomly divided into training set (70% of the data) and prediction set (30% of the data). The training set was initially used for the predictive model building step, and the prediction set was used to evaluate the prediction and the extrapolation capacity of the obtained model. The training set was subjected to the partial least square (PLS) to build different models, and the best model was used in the prediction step (prediction set).
Data preparation and descriptor selection
The mTOR inhibition was expressed by the IC50 (molecule concentration leading to 50% inhibition), which was transformed to the logarithmic scale (pC50) to avoid the influence of the dynamic value range on the linear algebra [pC50=−log (IC50×10−6)].
The descriptors calculation step concerned the use of two-dimensional (2D) descriptors only and over 184 descriptors contained within molecular operating environment (MOE)Citation17 were calculated for each molecule in the series. The calculated descriptors were initially screened for invariant nature, insignificance using QuaSAR-Contingency module of MOE which is a statistical application designed to assist in the selection of descriptors for QSAR. Furthermore, intercorrelation between the pairs of descriptors was performed to limit the number of descriptors considered for the study. A final set of 66 molecular descriptors identified by the aforementioned screening procedures was used in the construction step of QSAR models.
Generation of QSAR models
During the model construction step, we used the PLS as statistical analysis method to derive predictive models, which were established on a training set of 253 molecules and tested on a set of 112 molecules.
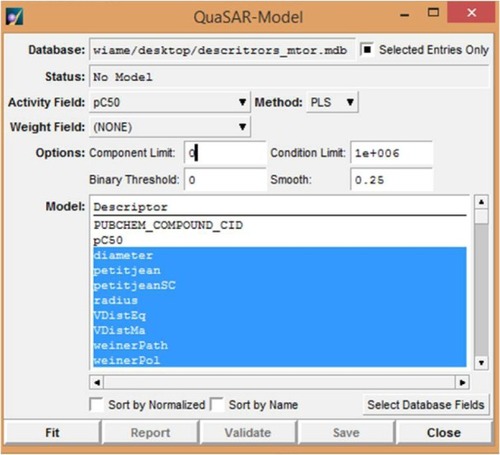
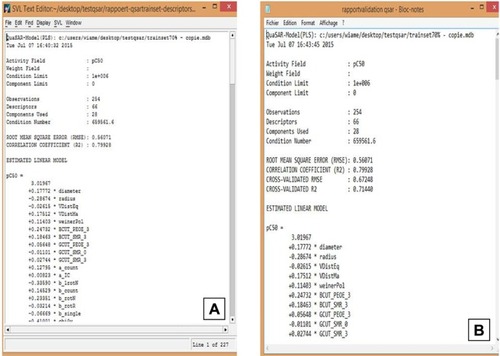
The module QuaSAR-Model in MOE () was used to generate the PLS QSAR modelCitation17 and its building step was performed in a step-by-step manner as follows: 1) assemble a database of experimental results and molecular structures; 2) calculate molecular descriptors for each molecule in the training set and the prediction set; 3) estimate the parameters of a numerical model in the training set (correlation coefficient [R2] and root mean square error [RMSE], ); 4) remove outliers from the training set; and 5) assess the predictiveness of the model (cross-validated correlation coefficient [q2]), and if the model is not satisfactory, adjust by returning to step 3 to increase the cited coefficients values in the best model.
Figure 2 Fitting the experimental data in the training set to generate the quantitative structure–activity relationship model in the MOE module QuaSAR-Model.
At the end, the report of calculation was obtained and the model was saved as a (.FIT) file and was used to predict the activities of the candidates in the test data set in the external validation.
Model validation
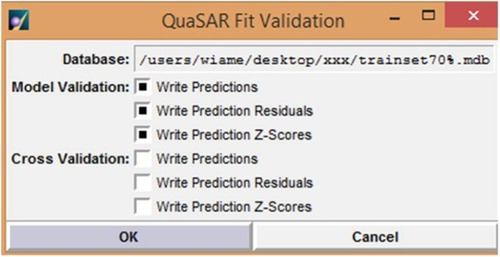
Each obtained model was validated in two steps. A first internal validation is obtained using the cross-validation leave-one-out (LOO) leading to the calculation of cross-validated correlation coefficient (q2). The internal validation procedure that evaluates the predicted activities and the residuals for the molecules in the training set is shown in . The second validation was external by estimating the activities of the prediction set using the model and calculating the numerical model parameters.
Figure 3 The QuaSAR fit validation panel.
Virtual screening
A chemical library was built from:
1,965 compounds extracted from drug-like Zinc database, a free database of commercially available compounds for virtual screening.Citation18
1,491 compounds extracted from e-LEA3D: ChemInformatic Tools and Databases.Citation19 This group represents the US Food and Drug Administration (FDA) fragments consisting of the commercial fragments extracted from the FDA approved drugs (04-02-2014: 1491 molecules).
Before predicting the activities of these compounds by the developed QSAR model, a compound filtering step was conducted using the ChemBioServer platform.Citation20 ChemBioserver hosts a group of tools and web services developed in the Biomedical Research Foundation of the Academy of Athens. Its main aim is to facilitate computational compound screening and analysis. We performed the filtering using the Lipinski’s Rule-of-Five and then the toxicity filtering which is allowed to search for the toxic moieties and display them in red based on a list of 25 known organic toxic compounds.
The filtered compounds were screened using the final QSAR model in order to select molecules with predicted activity exceeding a set threshold described later.
Docking studies
All predicted molecules with pC50 more than 6 were studied using docking tools. The docking files (ligand + protein active site) were prepared with Autodock Vina software,Citation21 by using AutoDock Tools (v1.5.6).Citation22,Citation23 The following parameters were adjusted in this preparation step: 1) the Gasteiger charges and polar hydrogens were added; 2) the grid-box dimensions were set at 23.54 Å (X), 63.13 Å (Y), and 21.02 Å (Z); and 3) the center of the box was positioned at the midpoint of the active site, and the box volume covered the entire active site area plus a significant portion of the protein’s solvent-exposed surface.
The following docking parameters were used in Autodock Vina: 1) all bonds in the inhibitor structures were allowed to rotate freely, except for the multiple bonds and the bonds in aromatic entities; 2) the kinase 3D structures were considered to be rigid; 3) a Lamarckian genetic algorithm was used for searching the conformational space in the active site; 4) the default grid spacing was set at 1 Å; 5) 100 different conformations were assessed, and the nine highest scoring binding modes were maintained for visual inspection; 6) the maximum energy difference between the best and the worst binding modes was set at 3 kcal/mol; 7) the scoring function was a stochastic global optimization method inspired chiefly by X-score;Citation24 and 8) visual inspection of the docking results and image building was done using PyMOL software.
Software and packages
The MOE (2008.10) modules used included QuaSAR Descriptor module, QuaSAR-Contingency module, QuaSAR-Model module, and QuaSAR Model-evaluate module.Citation17
The MGL Tools 1.5.6 package of programs from Scripps Research Institute,Citation22,Citation23 with AutoGrid4 and AutoDock vina (Scripps), were used for docking studies.Citation21
The PyMol (DeLano Scientific; www.pymol.org/funding.html) was used for molecular visualization, for production of most figures, and for preset analyses of ligand sites.Citation25
Results
Data set preparation and descriptors calculation
For the QSAR study, 364 structures were collected from PubChem. The descriptors calculation is shown as additional data 1 in Table S1 with the chemical structures of the 364 compound mTOR inhibitors and the experimental activities – presented in pC50 – used in this study. The table also contains the values for several molecular descriptors calculated for the structures using MOE software.
Several types of descriptors, including electrotopological and structural ones, were used to derive a quantitative relationship between catalytic blocking activity and structural properties.Citation26–Citation28 The linear regression methods using PLSCitation29 were used to generate the 2D-QSAR models.
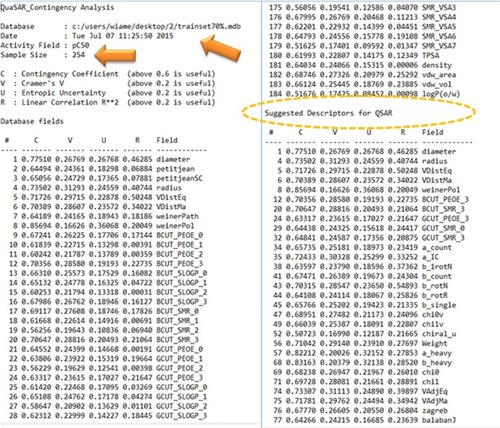
One hundred eighty-four 2D descriptors were done by MOE, and 66 molecular descriptors were selected among them after analysis of the training set (254 compounds) by the QuaSAR-Contingency module (). Fundamentally, QSAR-Contingency permits a bivariate contingency analysis for each descriptor and the activity or property value. It produces a table of coefficients that users can then use to select “important” descriptors.
Figure 4 QuaSAR-Contingency report and descriptors selection in the training set.
Abbreviation: QSAR, quantitative structure–activity relationship.
2D-QSAR analysis
QSAR models were constructed based on the 66 molecular descriptors as independent variables and the biologic activity (mTOR inhibition parameters) as a dependent variable using forward stepwise regression analysis using the QuaSAR-Model module in MOE. The regression analysis of QuaSAR-Model was used to build the QSAR model using PLS for the training set (254 compounds) with a correlation coefficient (R2) of 0.79928 and a RMSE of 0.56071 (). For QSAR validation, several parameters such as R2, q2, standard error of training and prediction sets, Y-scrambling analyses, and confidence interval estimators were used to discriminate between the QSAR Models.Citation30–Citation32 and the best one was evaluated and tested using a LOO method (LOO cross-validation). The predictive performance on cross-validation was represented by cross-validated RMSE of 0.67248 and cross-validated R2 of 0.71440 ().
Figure 5 (A) Quantitative structure–activity relationship report using 66 selected descriptors. (B) Report of the cross-validation of the model generated by molecular operating environment.
Chemical library screening
The developed and validated QSAR model was used to screen two chemical structure sets. The first set was extracted from drug-like Zinc database (1,965 compounds)Citation18,Citation33 and the second one with 1,491 compounds from e-LEA3D: ChemInformatic Tools and Databases web site.Citation19 To reduce the number of tested compounds, “ChemBioServer platform”Citation20 was used in two steps. The first filtering using the Lipinski’s Rule-of-Five reduced the number of compounds to 1,929 for drug-like Zinc database and to 1,199 compounds for FDA fragment database. The second filtering was done by toxicity test and we were able to reduce the number to 1,865 compounds for the drug-like Zinc database and 1,122 compounds for the FDA fragments.
After calculating the predicted activity of the selected compounds (2,987), the pC50 threshold of 6 was used to discriminate between them. Seven hundred fifty compounds from the drug-like Zink database and 235 compounds from the FDA fragments went into molecular docking using the mTOR 3D structure developed by homology modeling.
Molecular docking studies
Our mTOR 3D model, developed by homology modeling,Citation16 was used to dock the selected compounds with the catalytic site of mTOR using the MGL tools 1.5.6 with Auto Grid4 and AutoDock vina (Scripps).Citation21 The compounds with the best docking scores were analyzed to evaluate the interaction with the mTOR kinase active site. The docking scores (affinity) were set between −7.9 and −3.4 kcal/mol for the drug-like Zink database and between −8.1 and −3.4 kcal/mol for FDA fragments, leading to the selection of 12 compounds from Zinc database (affinity between −7.9 and −7.1 kcal/mol) and 10 compounds from FDA fragments database (affinity between −8.1 and −7.5 kcal/mol).
Discussion
In this paper, we described the 2D-QSAR studies and the molecular docking using online and open-source computational tools to elucidate the structural properties required for the inhibition of mTOR activity. The PLSCitation29 was used to generate the 2D-QSAR models structures collected from PubChem and selected 22 compounds after virtual screening as potential inhibitors of the mTOR kinase active site.
Recent studies have evaluated the relationship between the structure and activity of mTOR inhibitors applying the 3D-QSAR and using other computational tools.Citation34,Citation35 In this study, we analyzed a larger number of molecules (364) using 2D molecular descriptors calculated by MOE. These descriptors were defined to be numerical properties that can be calculated from the connection table representation of a molecule (eg, elements, formal charges, and bonds, but not atomic coordinates). The 2D descriptors are, therefore, not dependent on the conformation of a molecule and are most suitable for large data sets. It is sometimes necessary to prune a set of descriptors in order to select the optimum set for the molecules under consideration. QuaSAR-Contigency module which is a statistical application in MOE designed to assist users in the selection of descriptors for QSAR or QSPR proposes a set of descriptors that best describe the molecules in the training set. The regression analysis of QuaSAR-Model was used to build the QSAR model through the PLS of the training set (254 compounds) with correlation coefficient (R2) of 0.79928 and RMSE of 0.56071. For QSAR validation, several parameters such as R2, q2, standard error of training and prediction sets, Y-scrambling analyses, and confidence interval estimators were used to judge the QSAR models.Citation30–Citation32,Citation36 In our study, the model was evaluated and tested using the LOO and predictive performance on cross-validation.
The Z-score method in this study was adopted for the detection of outliers and can be defined as absolute difference between the value of the model and the activity field, divided by the square root of the mean square error of the data set. Any compound with a Z-score value higher than 2.5 was considered as an outlier.Citation37 In our case, six compounds (2.36% in training set) were defined as outliers.
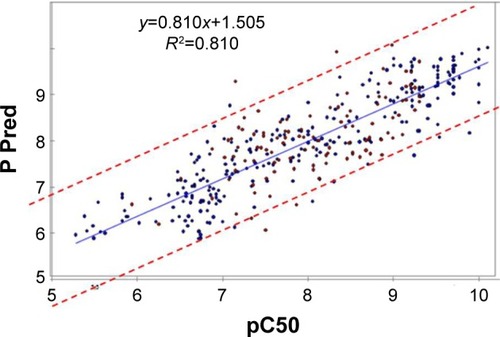
In our study, we took in consideration the r2 and the interval of confidence to judge the QSAR models. Many studies uses only the r2 to do so with the risk of QSAR over-fitting or over-estimation leading if their values are high;Citation30,Citation38 however, Thai et al and Liao et al show that the QSAR model with high r2 value does not necessarily correlate with a good predictive model,Citation39,Citation40 and for classic QSAR studies, 95% confidence interval is commonly used for models validation. In our study, the 2D-QSAR model was determined as having a good ability to predict accurately based on an interval of confidence of 95% (blue dots for training set and red dots for prediction set in ).
Figure 6 Relationship between observed and predicted data from QSAR model and the mammalian target of rapamycin inhibitors from two-dimensional QSAR (95% confidence interval).
Abbreviations: QSAR, quantitative structure–activity relationship; Pred, predicted.
The chemical library screening was done on two sets. Thousand nine hundred and sixty-five compounds from drug-like Zinc database and 1,491 compounds from e-LEA3D: ChemInformatic Tools and Databases. Both sets were filtered by ChemBioServer platformCitation20 to remove compounds with a high level of potential toxicity effect and compounds that do not meet the Lipinski’s Rule-of-Five.Citation41 A total of 2,987 compounds have passed both filters and were used to predict the activities by the developed QSAR model. After calculating the predicted activity, we selected compounds with pC50 ≥6. This approach resulted in selecting 750 compounds for drug-like Zink database and 235 compounds for FDA fragments for molecular docking into mTOR 3D structure developed by homology modeling.Citation16
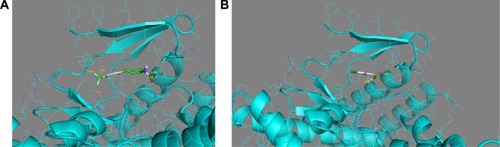
After the docking, compounds of drug-like Zink data-base scores (affinity) were between −7.9 and −3.4 kcal/mol and the FDA fragments ones showed scores between −8.1 and −3.4 kcal/mol. Compounds with the best score were taken to analyze the mode of interaction with mTOR catalytic site. As 12 compounds were selected from Zinc database (affinity between −7.9 and −7.1 kcal/mol), 10 compounds were selected from FDA fragments database (affinity between −8.1 and −7.5 kcal/mol). The complex modeling with compounds in Zinc database indicated that the different compounds fit the ATP-binding site forming one or two hydrogen bonds with the backbone groups of Gly2097 and W2098, which are considered to be the hinge residues of mTOR. Two compounds were interesting as they interact with the binding site. The compound no 745 () mimicks the binding mode of the purine ring in ATP. However, the compound no 209 does not interact with the hinge, but it makes interactions with Y2085 residue, suggesting an interaction with the internal hydrophobic pocket (). This compound may be optimized to enhance the binding to the hinge while interacting with the internal pocket.
Figure 7 (A) Compound no 745 makes two hydrogen bonds with the hinge and connected to the helix. (B) Compound no 209 making an interaction with the internal pocket of the catalytic site of mTOR. Blue areas mean nitrogen atom, red areas mean oxygen atom, and green areas mean other. Numbers represent the size of the hydrogen bonds established between the ligand and the receptor. The bonds are represented by the dotted yellow line.
On the basis of these findings, four of these compounds were selected to go through rounds of in vitro and in vivo testing as lead compounds.
Conclusion
The aim of our study was to build a 2D-QSAR model to characterize the interactions of mTOR ATP-competitive inhibitors with the mTOR catalytic site.
With its high accuracy and fast prediction, our QSAR model was applied to screen chemical libraries to look for compounds that can be a starting point for new classes of selective mTOR inhibitors and design new analogs with higher antitumor activity. Promising results were obtained and the method and applications highlighted in this study will help us to design more selective ATP-competitive inhibitors with better structural characteristics and improved selective antikinase activity of mTOR.
Author contributions
All authors contributed toward data analysis, drafting and revising the paper and agree to be accountable for all aspects of the work.
Acknowledgments
This work was carried out under National Funding from the Moroccan Ministry of Higher Education and Scientific Research (PPR program) to AI. This work was also supported by a grant from the NIH for H3Africa BioNet to AI.
Disclosure
The authors report no conflicts of interest in this work.
References
- MurakamiMIchisakaTMaedaMmTOR is essential for growth and proliferation in early mouse embryos and embryonic stem cellsMol Cell Biol200424156710671815254238
- RichardDJVerheijenJCZaskARecent advances in the development of selective, ATP-competitive inhibitors of mTORCurr Opin Drug Discov Devel2010134428440
- ZhangY-JDuanYZhengXFSTargeting the mTOR kinase domain: the second generation of mTOR inhibitorsDrug Discov Today2011167–832533121333749
- LePTChengHNinkovicSDesign and synthesis of a novel pyrrolidinyl pyrido pyrimidinone derivative as a potent inhibitor of PI3Kα and mTORBioorg Med Chem Lett201222155098510322749419
- PetersonEABoezioAAAndrewsPSDiscovery and optimization of potent and selective imidazopyridine and imidazopyridazine mTOR inhibitorsBioorg Med Chem Lett201222154967497422765895
- LiuKKCHuangXBagrodiaSQuinazolines with intra-molecular hydrogen bonding scaffold (iMHBS) as PI3K/mTOR dual inhibitorsBioorg Med Chem Lett20112141270127421269826
- LeeWOrtwineDFBergeronPA hit to lead discovery of novel N-methylated imidazolo-, pyrrolo-, and pyrazolo-pyrimidines as potent and selective mTOR inhibitorsBioorg Med Chem Lett201323185097510423932790
- FinlayMRVButtarDCritchlowSESulfonyl-morpholino-pyrimidines: SAR and development of a novel class of selective mTOR kinase inhibitorBioorg Med Chem Lett201222124163416822607682
- KumarAPurohitRComputational investigation of pathogenic nsSNPs in CEP63 proteinGene20125031758222555018
- RajendranVSethumadhavanRDrug resistance mechanism of PncA in Mycobacterium tuberculosisJ Biomol Struct Dyn201432220922123383724
- PurohitRRole of ELA region in auto-activation of mutant KIT receptor: a molecular dynamics simulation insightJ Biomol Struct Dyn20143271033104623782055
- KumarAPurohitRUse of long term molecular dynamics simulation in predicting cancer associated SNPsPLoS Comput Biol2014104e100331824722014
- NetzevaTIWorthAAldenbergTCurrent status of methods for defining the applicability domain of (quantitative) structure-activity relationships. The report and recommendations of ECVAM Workshop 52Altern Lab Anim200533215517316180989
- WorthABassanAGallegosAThe Characterisation of (Quantitative) Structure-Activity Relationships: Preliminary GuidanceIspra, ItalyEuropean Commission, Joint Research Centre
- DarnagRMostapha MazouzELSchmitzerAVilleminDJaridACherqaouiDSupport vector machines: development of QSAR models for predicting anti-HIV-1 activity of TIBO derivativesEur J Med Chem20104541590159720110136
- LakhliliWChevéGYasriAIbrahimiADetermination and validation of mTOR kinase-domain 3D structure by homology modelingOncoTargets Ther2015819231930
- MOE: Molecular Operating Environment2013 Available from: http://www.chemcomp.com/MOE-Molecular_Operating_Environment.htmAccessed August 15, 2013
- IrwinJJShoichetBK database on the InternetZINC – a free database of commercially available compounds for virtual screeningJ Chem Inf Model2005451177182 Available from: http://zinc.docking.org/Accessed July 1, 201215667143
- DouguetD database on the Internete-LEA3D: a computational-aided drug design web serverNucleic Acids Res201038Suppl 2W615W621 Available from: http://chemoinfo.ipmc.cnrs.fr/lea.htmlAccessed July 1, 201220444867
- AthanasiadisECourniaZSpyrouG database on the InternetChemBioServer: a web-based pipeline for filtering, clustering and visualization of chemical compounds used in drug discoveryBioinformatics2012282230023003 Available from: http://bioserver-3.bioacademy.gr/Bioserver/ChemBioServer/Accessed July 1, 201222962344
- TrottOOlsonAJAutoDock Vina: improving the speed and accuracy of docking with a new scoring function, efficient optimization, and multithreadingJ Comput Chem201031245546119499576
- MorrisGMHueyRLindstromWAutoDock4 and AutoDockTools4: automated docking with selective receptor flexibilityJ Comput Chem200930162785279119399780
- MorrisGMHueyROlsonAJUsing AutoDock for ligand-receptor dockingCurr Protoc Bioinformatics2008 Chapter 8: Unit 8.14
- WangRLaiLWangSFurther development and validation of empirical scoring functions for structure-based binding affinity predictionJ Comput Aided Mol Des2002161112612197663
- SeeligerDde GrootBLLigand docking and binding site analysis with PyMOL and autodock/vinaJ Comput Aided Mol Des201024541742220401516
- ErtlPRohdeBSelzerPFast calculation of molecular polar surface area as a sum of fragment-based contributions and its application to the prediction of drug transport propertiesJ Med Chem200043203714371711020286
- HallLHKierLBThe molecular connectivity chi indexes and kappa shape indexes in structure-property modelingLipkowitzKBBoydDBReviews in Computational ChemistryNew JerseyJohn Wiley & Sons, Inc1991367422
- BalabanATHighly discriminating distance-based topological indexChem Phys Lett1982895399404
- WoldHEstimation of principal components and related models by iterative least squaresKrishnaiahPKMultivariate AnalysisNew York, NYAcademic Press1966391420
- GramaticaPPrinciples of QSAR models validation: internal and externalQSAR Comb Sci2007265694701
- DietrichSWDreyerNDHanschCBentleyDLConfidence interval estimators for parameters associated with quantitative structure-activity relationshipsJ Med Chem19802311120112057452669
- RoyKMitraIKarSOjhaPKDasRNKabirHComparative studies on some metrics for external validation of QSPR modelsJ Chem Inf Model201252239640822201416
- IrwinJJSterlingTMysingerMMBolstadESColemanRGZINC: a free tool to discover chemistry for biologyJ Chem Inf Model20125271757176822587354
- ChenLWangLGuQXuJAn in silico protocol for identifying mTOR inhibitors from natural productsMol Divers201418484185225156384
- KhanfarMATahaMOElaborate ligand-based modeling coupled with multiple linear regression and k nearest neighbor QSAR analyses unveiled new nanomolar mTOR inhibitorsJ Chem Inf Model201353102587261224050502
- TropshaAGolbraikhAPredictive QSAR modeling workflow, model applicability domains, and virtual screeningCurr Pharm Des200713343494350418220786
- Manoj KumarPKarthikeyanCHari Narayana MoorthyNSTrivediPQuantitative structure-activity relationships of selective antagonists of glucagon receptor using QuaSAR descriptorsChem Pharm Bull (Tokyo)200654111586159117077558
- FriedmanJHTibshiraniRHastieTThe Elements of Statistical Learning: Data Mining, Inference, and Prediction2nd edNew YorkSpringer2002
- ThaiKMBuiQHTranTDHuynhTNPQSAR modeling on benzo[c] phenanthridine analogues as topoisomerase I inhibitors and anti-cancer agentsMolecules20121755690571222580401
- LiaoSYQianLLuHLShenYZhengKCA combined 2D- and 3D-QSAR study on analogues of ARC-111 with antitumor activityQSAR Comb Sci2008276740749
- LipinskiCALombardoFDominyBWFeeneyPJExperimental and computational approaches to estimate solubility and permeability in drug discovery and development settingsAdv Drug Deliv Rev2001461–332611259830