
Abstract
Astrocytoma is one of the most common types of brain tumor, which is histologically and clinically classified into four grades (I–IV): I (pilocytic astrocytoma), II (diffuse astrocytoma), III (anaplastic astrocytoma), and IV (glioblastoma multiforme). A higher grade astrocytoma represents a worse prognosis and is more aggressive. In this study, we compared the differential proteome profile of astrocytoma from grades I to IV. The protein samples from clinical specimens of grades I, II, III, and IV astrocytoma were analyzed by two-dimensional liquid chromatography–tandem mass spectrometry and isobaric tags for relative and absolute quantitation and quantification. A total of 2,190 proteins were identified. Compared to grade I astrocytoma, 173 (12.4%), 304 (14%), and 462 (21.2%) proteins were aberrantly expressed in grades II, III, and IV, respectively. By bioinformatics analysis, the cell proliferation, invasion, and angiogenesis-related pathways increase from low- to high-grade of astrocytoma. Five differentially expressed proteins were validated by Western blot. Within them, matrix metalloproteinase-9 and metalloproteinase inhibitor 1 were upregulated in glioblastoma multiforme group; whereas fibulin-2 and -5 were downregulated in grade II/III/IV astrocytoma, and the negative expression was significantly associated with advanced clinical stage. Functional analysis showed that both fibulin-2 and -5 may exert an antitumor effect by inhibiting cell proliferation, in vitro migration/invasion in glioma cells. New molecular biomarkers are likely to be used for accurate classification of astrocytoma and likely to be the target for drug development.
Introduction
Astrocytoma is the most common type of brain tumor (glioma) originating in astrocytes, which is a group of star-shaped brain cells located in the cerebrum. Astrocytoma can be categorized into four grades: grade I (pilocytic astrocytoma), II (diffuse astrocytoma), III (anaplastic astrocytoma), and IV (glioblastoma multiforme, GBM). Low clinical grade (grade I or II) astrocytoma has a better prognosis or less aggressive features than higher grade (III or IV) astrocytoma. Grade I astrocytoma are featured as slow growing, benign, and associated with long-term survival of patients, while patients with grade II astrocytoma have a median survival of ~7–8 years.Citation1–Citation3 At the same time, patients with grade III astrocytoma have a median survival of ~2–3 years, and patients with GBM of only 9–14 months.Citation1–Citation3 GBM is the most aggressive astrocytoma and the most common of all primary central nervous system tumors.Citation4 Thus it would be valuable to reveal the detailed mechanisms and identify biomarkers/indicators of astrocytoma, especially highly aggressive astrocytoma, that is, GBM.
Until now, multiomics data integration and analysis for astrocytoma data provided more information about astrocytoma pathogenesis. By proteomics analysis, many important signaling pathways, such as receptor tyrosine kinase signaling (including epidermal growth factor receptor [EGFR], platelet-derived growth factor receptor, and vascular endothelial growth factor receptor),Citation5,Citation6 calcium signaling (including S100 proteins, annexins, integrins, and receptors), mechanistic target of rapamycin (mTOR), Notch or Wnt/β-catenin, have been identified that are dysregulated in GBM.Citation3,Citation7,Citation8 Some other groups reported that CD90, CD133, and NPM (nucleophosmin) are aberrantly expressed in astrocytoma.Citation9–Citation12 Sallinen et alCitation13 used transcriptome analyses and found that various genes related to cell metastasis and angiogenesis were upregulated in astrocytoma.Citation13 He also found that some cell cycle-related genes were downregulated in astrocytoma. Although several potential biomarkers have been identified in astrocytoma, especially in GBM, more accurate candidate biomarkers of astrocytoma with different clinical degrades are required, which could better understand the differentiation between low- or high-grade astrocytoma, and would benefit clinical research and its application.
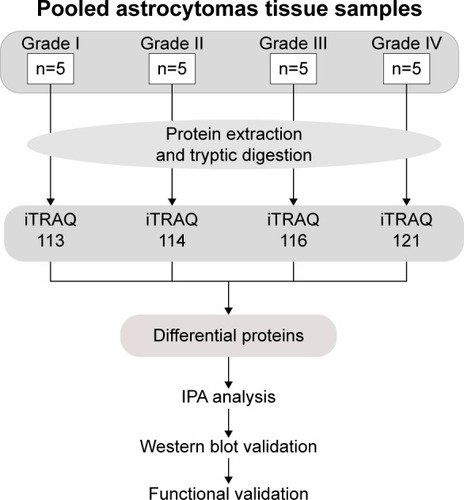
In this work, we used a proteomic approach to examine the proteomic feature among low- and high-grade astrocytomas. The pooled low- and high-grade astrocytoma protein samples were tryptic digested, labeled by 8-plex isobaric tags for relative and absolute quantitation (iTRAQ) reagents, and then mixed and analyzed by Reversed Phase-Reversed Phase high-performance liquid chromatography tandem mass spectrometry (LC–MS/MS). By iTRAQ quantification, proteins with an over twofold changes were considered as differential proteins. After that, the biological functions and canonical pathways belonging of the differentially presented proteins were annotated by ingenuity pathway analysis (IPA). Then, five candidate proteins were validated in multiple individual samples using Western blot. Furthermore, effects of two candidate biomarkers, fibulin-2 and -5, on proliferation and metastasis of astrocytoma cells were tested ().
Figure 1 Work flow of differential proteome analysis of low- to high-grade astrocytomas.
Materials and methods
Case selection criteria
The collection of tissues and the study protocol was all approved by the Ethics Committee of Chinese PLA General Hospital, with written informed consent from all patients. Tumor pathological diagnosis was confirmed by two independent pathology experts according to World Health Organization histological classification. Frozen samples were collected intraoperatively and immediately frozen to −80°C in a refrigerator; the samples included five specimens each of grade I (PS), II (diffuse astrocytoma), III (anaplastic astrocytoma), and IV (GBM). The study was approved by the review board in accordance with ethical norms. All clinical investigations were conducted according to the principles expressed in the Declaration of Helsinki.
iTRAQ sample preparation
Fifty milligram sections from each of the 20 frozen tissue samples were selected for proteomics analysis. Each sample was rinsed with phosphate-buffered saline and then lyzed with lysis buffer (containing 2.5 M thiourea, 8 M urea, 65 mM dithiothreitol). Cell debris was removed by centrifugation at 14,000× g at 4°C for 10 minutes. The protein concentration of each sample was measured by the Bradford method.Citation14
Proteins from each sample were pooled together with the same total protein amount and digested with filter-aided sample preparation method. Digested peptides from the grade I, II, III, and IV samples were desalted in C18 columns (1cc, 30 mg, Oasis®, Waters Company, Milford City, Massachusetts, USA). The desalted peptides were dried by vacuum centrifugation and stored at −80°C.
The pooled grade I, II, III, and IV samples were labeled with 114, 115, 118, and 121 8-plex iTRAQ reagents, respectively, according to the manufacturer’s protocol (AB SCIEX Company, Farmingham City, Massachusetts, USA). After labeling, the labeled samples were mixed equally and dried by vacuum centrifugation.Citation14
Two dimensional LC–MS/MS
The mixed labeled samples were first separated using a high-performance reverse phase liquid chromatography column (4.6×250 mm, C18, 3 μm, Waters Company, Milford City, Massachusetts, USA). The samples were loaded onto the column in buffer A (pH =10, 2% acetonitrile, ACN), and gradient eluted by 5%–35% buffer B (90% ACN, pH =10; flow rate, 0.6 mL/min) for 60 minutes. The eluted peptide were collected at one fraction per minute, and the 60 total fractions were pooled into 15 samples by combining fractions 1, 16, 31, 46; 2, 17, 32, 47, and so on. A total of 15 fractions were analyzed by LC–MS/MS.
Each fraction was analyzed with a self-packed capillary reverse phase high-performance liquid chromatography column (75 μm ×100 mm, C18, 3 μm). The samples were loaded onto the column in buffer A (0.1% formic acid, 2% ACN), and gradient eluted by 5%–30% buffer B (0.1% formic acid, 99.9% ACN; flow rate, 0.3 μL/min) for 40 minutes. An LTQ-orbitrap Velos mass spectrometer (Thermo Fisher Scientific Corporation, Waltham City, Massachusetts, USA) was used to analyze the LC eluted peptides. Mass spectrometry data were obtained using the following parameters: ten data-dependent MS/MS scans per full scan, full scans acquired at a resolution of 30,000 and MS/MS scans at a resolution of 7,500, charge state screening (including precursors with +2 to +4 charge state), dynamic exclusion (exclusion duration 60 seconds).Citation14
Data processing
Mascot software (Matrix Science, London, UK; version 2.4.01) was used for database searching of all samples. In Mascot, the database was set to Swissprot human database and the digestion enzyme was set to trypsin. The parent mass tolerance was 10 ppm and fragment ion was 0.5 Da. Carbamidomethyl of cysteine was set as a fixed modification, and a maximum of two miscleavage sites were allowed. For protein identification, Scaffold (version Scaffold_4.0.7, Proteome Software Inc., Portland, OR, USA) was used. Protein identification was set at false discovery rate (FDR) <1% on both peptide and protein level and contained at least one unique peptide. Proteins containing similar peptides and could not be distinguished based on MS/MS analysis were grouped separately in order to meet the principle of simplicity. Scaffold Q+ (version Scaffold_4.3.2, Proteome Software Inc.) was used for iTRAQ quantification. Acquired intensities in the experiment were normalized globally at all runs. The reference channels were normalized to produce a 1:1 fold change. To normalize data, all normalization-calculations used medians multiply methods.Citation14
Gene Ontology (GO) and IPA analysis
For GO analysis, all differential proteins were analyzed in the Panther database (http://www.pantherdb.org/), and compared with the whole human genome. Proteins were classified based on molecular function, biological processes, and cellular component categories in GO annotations.
For IPA analysis, the differential proteins were analyzed in IPA software (Ingenuity Systems, Mountain View, CA, USA). The proteins were mapped to the IPA database and other databases in the disease and functional category, and the canonical pathways category, respectively, with Z-score and P-values rankings.Citation14
Western blotting analysis
Five selected candidate biomarkers, including EGFR, matrix metalloproteinase-9 (MMP9), metalloproteinase inhibitor 1 (TIMP1), fibulin-2 and -5, were validated by Western blot by the individual samples. All the primary antibodies against EGFR (Cat# ab131498), MMP9 (Cat# ab76003), TIMP1 (Cat# ab61224), fibulin-2 (Cat# ab125256), and fibulin-5 (Cat# ab66339) were purchased from the Abcam (Cambridge, MA, USA). Quantificational analysis of Western blot data was done using ImageJ (National Institutes of Health, Bethesda City, Maryland, USA) and statically analyzed by one way analysis of variance in SPSS 18.0 (SPSS Inc., Chicago, IL, USA).
RNA isolation and quantitative real-time polymerase chain reaction
Total RNA samples were harvested following the methods described by Serra et al.Citation15 The Taqman primers and probes for fibulin-2 and -5, and glyceraldehyde 3-phosphate dehydrogenase were obtained from validated and predesigned Gene Expression Assays (Life Technologies, Carlsbad, CA, USA). Total RNA extracting and real-time reverse transcriptase polymerase chain reaction experiments were performed following the methods described by Serra et al.Citation15
Cell proliferation assays
MTT ((3-(4,5-dimethyl-2-thiazolyl)-2,5-diphenyl-2-H-tetrazolium bromide)) experiment was used to analyze anchor-independent growth of U251 cells. U251 cells were transfected with empty vectors or fibulin-2 and -5 expression vectors. Cell proliferation assays (MTT- experiment) was performed following the protocols described in references.Citation16,Citation17
Anchorage-independent proliferation assay
U251 cells were transfected with empty vectors or fibulin-2 and -5 expression vectors. The anchorage-independent proliferation was performed following the protocols described in references.Citation18,Citation19
Transwell (in vitro invasion and migration) assay
U251 cells were transfected with empty vectors or fibulin-2 and -5 expression vectors. The in vitro invasion or migration of cells was identified by transwell analysis. Transwell assays were performed following the methods provided in Zhao et al.Citation20
Results
Quantitative analysis of differential proteome
The tissue protein samples extracted from grade I, II, III, and IV astrocytomas were pooled respectively. The four pooled samples were iTRAQ-labeled and then analyzed by 2D LC-MS/MS. By querying the human Swissprot database with the Mascot algorithm, at 1% FDR both in peptide and protein levels, 19,793 spectrums were matched from 130,959 spectrums. A total of 9,570 peptides were identified. A total of 2,190 proteins were identified from matched spectrums with ≥1 peptides and 2,177 proteins were quantified by iTRAQ. By a ratio-fold change >2, compared to grade I astrocytomas, 173 (12.4%), 304 (14%), and 462 (21.2%) proteins were differentially expressed in grade II, grade III, and grade IV astrocytomas, respectively ( and S1). By analyzing the distribution of the protein fold change (), in all the three groups, the data set showed nearly symmetric distribution of fold change across the samples.
Figure 2 Distribution of proteins fold change in grade II (A), grade III (B), and grade IV (C) versus grade I astrocytoma.
Abbreviation: FDR, false discovery rate.
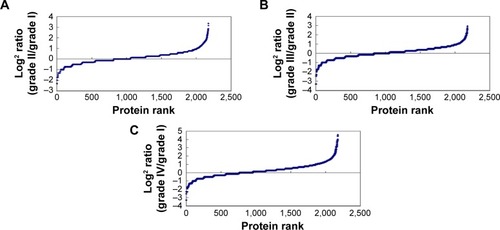
Table 1 Number of upregulated proteins and downregulated proteins in different grades of astrocytomas analyzed by LC-MS/MS
PANTHER and IPA analysis
To further study the biological function of the differential proteins between the different grades of astrocytoma, the differential proteins were analyzed by GO and IPA.
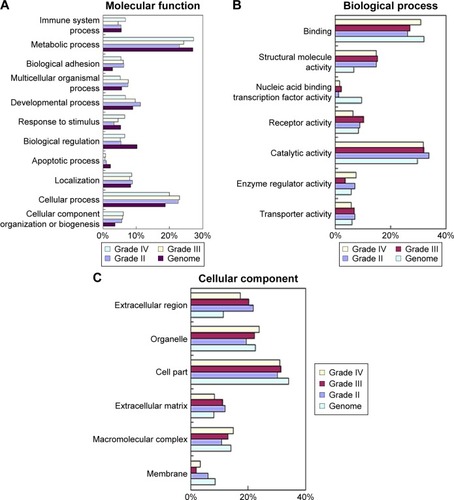
Next, to explore the possible function of differential proteins in grade II, III, and IV astrocytomas, the PANTHER classification systemCitation21 was used to search for the enrichment of the GO terms in differential proteins comparing to the whole human genome data. The cellular compartment, molecular function, and biological process of the differentially expressed proteins are presented in . In the molecular function category (), the percentage of structural molecular activity were much higher, while the percentage of nucleic acid binding transcription factor were much lower in the differential proteins in grade II, III, and IV astrocytomas compared with the whole genome data. In biological process category (), the biological adhesion function, cellular component organization, and biogenesis were overrepresented, whereas the biological regulation were underpresented. In the cellular component category (), extracellular region was overrepresented in all the three grades of astrocytoma, extracellular matrix (ECM) was overrepresented in grade II and III astrocytomas, whereas the membrane proteins were underrepresented, indicating that the ECM proteins play a role in the pathologic process of astrocytomas.
Figure 3 GO analysis of differential proteins from low- to high-grade astrocytomas.
Abbreviation: GO, Gene Ontology.
To further analyze the detailed difference between the different grades of astrocytoma, from low to high, IPA analysis was performed. In disease and function analysis, cell survival, cell viability, cell activation, cell proliferation, cell migration, cell invasion, cell movement and angiogenesis were increasingly activated from low- to high-grade of astrocytoma (). These results indicated that cell proliferation, cell invasion, and angiogenesis increase from low- to high-grade astrocytomas, and all these were consistent with previous laboratory investigations and clinical observations of higher malignancy and worse prognosis from low- to high-grade astrocytomas.Citation1–Citation3,Citation10 As a member of fibulin family, fibulin-5 was observed to be downregulated in all grade II/III/IV astrocytomas, and inhibit cell growth, cell invasion, and angiogenesis.Citation22 The proteins participating in metabolism and molecular transporters were activated in GBM, indicating high tumor metabolic levels in GBM. Inflammatory response and accumulation of neutrophils were activated in GBM (), reflecting tumor-induced inflammatory reaction in GBM.
Figure 4 IPA analyses of differential proteins from low- to high-grade astrocytomas.
Abbreviations: eIF2, eukaryotic initiation factor 2; IPA, ingenuity pathway analysis; mTOR, mechanistic target of rapamycin; Wnt, Wingless and int 1.
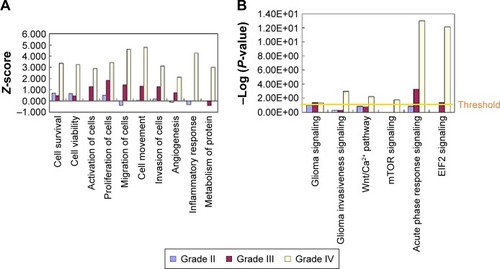
To further detect the detailed molecular mechanism of tumor development in low- and high-grade astrocytomas, pathway analysis was performed. Pathway analysis showed that the pathway of glioma signaling were enriched in grades III and IV, and glioma invasive signaling, Wnt/Ca2+ pathway, mTOR pathway were enriched in GBM, which were consistent with the previous study,Citation3,Citation7,Citation8 indicating that our proteomic data indeed reflected the pathological process of glioma (). In the glioma signaling pathway, EGFR were activated in grade II/III/IV astrocytomas, which were consistent with the previous studies showing amplification/overexpression of EGFR in GBM.Citation7,Citation23 The data suggested that the EGFR/ERK/MEK pathway were increasingly activated from low- to high-grade astrocytomas, which activated cell growth and cell proliferation. In GBM, levels of several important ECM and extracellular proteins belonging to the invasion-related signaling pathways, such as MMP9, plasminogen, vitronectin, increased significantly but there were no such obvious changes in low-grade astrocytomas, indicating that in the high-grade astrocytomas, glioma invasiveness signaling was significantly activated, which led to activation of cell invasion and further metastasis (see our graphical abstract shown in ). On the contrary, a metalloproteinase inhibitor, TIMP3, was downregulated in both GBM and low-grade astrocytomas. Surprisingly, another metalloproteinase inhibitor, TIMP1 was remarkably increased in GBM. We also observed that the eukaryotic initiation factor 2 pathway and acute phase response signaling were dramatically enriched in GBM, indicating that exuberant protein synthesis and serious tumor-induced inflammatory reaction occur in the high-grade astrocytomas ().
Western blot validations
Through biofunction and pathway analysis, five differential expressing proteins, for example, EGFR, TIMP1, MMP9, fibulin-2 and -5 were selected for Western blot validation. As shown in , results from iTRAQ and Western blot had a similar trend. EGFR, a previous reported biomarker, was upregulated in grade II/III/IV astrocytomas, which proves our experimental results were credible. Four newly reported candidate biomarkers, MMP9 and TIMP, were upregulated in the GBM group, whereas fibulin-2 and -5 were statistically downregulated in grade II/III/IV astrocytomas, and the decrease of these proteins was significantly correlated with advanced clinical stage ().
Figure 5 Western blot validations for five differential proteins.
Abbreviations: EGFR, epidermal growth factor receptor; GRB2, growth factor receptor-bound protein 2; MMP9, matrix metalloproteinase-9; TIMP, tissue inhibitor of metalloproteinase; MEK, Mitogen-activated protein kinase kinase; p-MEK, phosphorylated MEK.
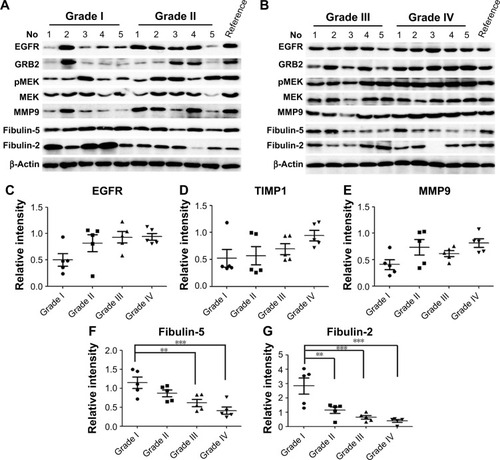
Table 2 Quantitative value of candidate biomarkers by iTRAQ and Western blot quantitation methods
Overexpression of fibulin-2 and -5 inhibit in vitro growth, migration, or invasion of glioma cells
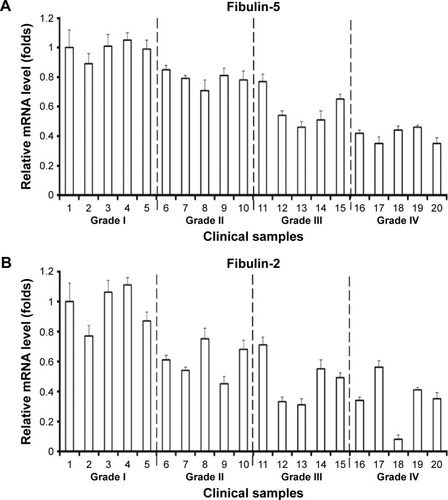
It is necessary to identify whether mRNA level of fibulins is downregulated in grade II/III/IV astrocytomas. The results showed that the mRNA level of fibulin-2 and -5 was statistically downregulated in grade II/III/IV astrocytomas, and low level of mRNA was significantly correlated with advanced clinical stage ().
Figure 6 The mRNA level of fibulin-2 and fibulin-5 in clinical specimens.
Abbreviation: mRNA, messenger RNA.
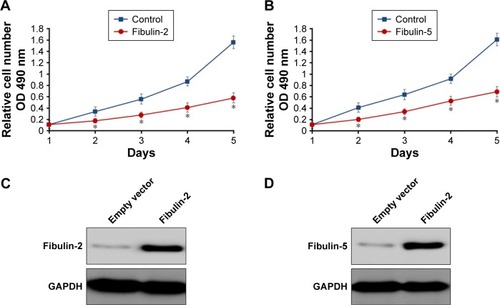
To identify the potential roles of fibulin-2 and -5 in glioma, U251 cells were transfected with pCMV-fibulin-5 or pCMV-fibulin-2 vectors, with empty vector as control. Overexpression of both fibulin-2 and -5 reduced the proliferation ability of U251 cells (P<0.05, respectively; ). The expression of fibulin-2 or -5 was significantly enhanced after transfection of fibulin-2 and -5 expression vectors ().
Figure 7 Fibulin-5 (A) and fibulin-2 (B) decrease glioma cells proliferation in vitro.
Abbreviations: GAPDH, glyceraldehyde 3-phosphate dehydrogenase; SD, standard deviation; OD, optical density; MTT, 3-(4,5-dimethyl-2-thiazolyl)-2,5-diphenyl-2-H-tetrazolium bromide.
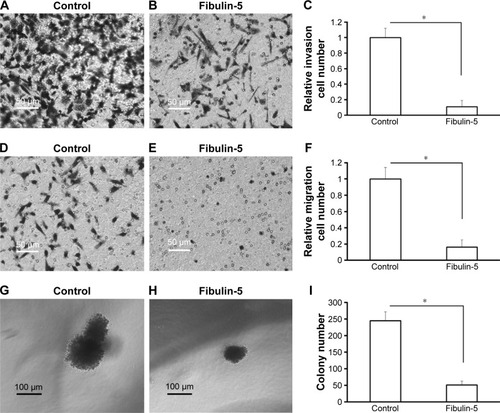
Next, in vitro anchorage-independent growth, invasion, and migration of U251 cells were tested. Overexpression of fibulin-2 and -5 decreased colony formation, migration, and invasion of U251 cells (P<0.05, respectively; and ). Taken together, both fibulin-2 and -5 might have an anticancer effect in glioma.
Figure 8 Fibulin-2 overexpression inhibits cell migration (A–C), cell invasion (D–F), and anchorage-independent growth (G–I) in glioma cells.
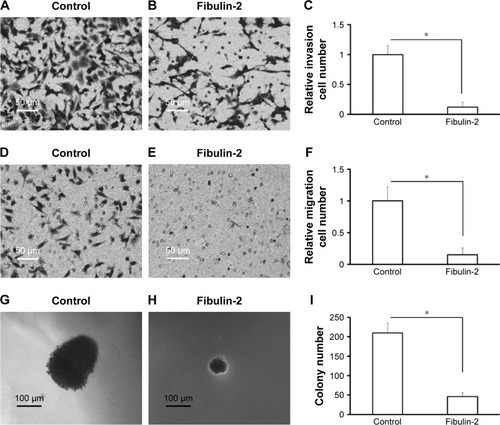
Figure 9 Fibulin-5 overexpression inhibits cell migration (A–C), cell invasion (D–F) and anchorage-independent growth (G–I) in glioma cells.
Discussion
Astrocytoma is a heterogeneous neoplasms originating from astrocytes. There were significant differences in prognosis and therapeutic decisions between low- and high-grade astrocytomas. However, given the extensive heterogeneity of astrocytic tumors, accurate differentiation between malignant high- and low-grade astrocytoma is difficult on the basis of their microscopic appearance. To identify the more accurate biomarkers between low- and high-grade astrocytomas, we preformed proteomics profiling of these glioma subtypes to discover differentially expressed protein biomarkers. We performed a proteomic analysis of these subtypes of gliomas and found differential expression of protein biomarkers.
By differential proteomics study, we found that some ECM proteins were upregulated or downregulated in different grades of astrocytomas, including MMPs, TIMPs, and fibulins.Citation24 The breakdown or degradation of extra-cellular matrix mediated by MMPs, especially MMp-2 or MMp-9, would participate in tumor progress via promoting cancer cells invasion or migration.Citation25–Citation28 In this article, we identified and validated the upregulation of MMP9 in GBM and the downregulation of TIMP3 in both low- and high-grade astrocytomas, which could promote the breakdown of ECM, and then promote tumor invasion in GBM. This result was consistent with previous studies.Citation29–Citation32 However, as another inhibitor of the zinc-dependent endopeptidase, TIMP1 was significantly upregulated in GBM by the observation of both proteomic data and individual Western blot validation. Traditionally, tissue inhibitors of MMPs have played a protective role in the invasion and metastasis of tumor. The possibility of the upregulation of TIMP1 in GBM is caused by some kind of feedback mechanism to antagonize the increase of MMPs in GBM. Other than metalloproteinase inhibition function, Nalluri et alCitation33 and Rojiani et alCitation34 provided evidence that the elevated TIMP messenger RNA levels are also associated with poor clinical outcome in patients with aggressive malignant lung adenocarcinoma. Functional analysis showed that overexpressed TIMP-1 promotes tumor development through alterations in angiogenesis, increased tumorigenicity, and invasive behavior. Therefore, we speculated another possibility that the upregulation of TIMP-1 might play a role in the angiogenesis and invasion of GBM in a MMP-independent way.
Fibulins are composed of a globular fibulin-type module in C-terminal and calcium-binding epidermal growth factor-like modules.Citation35 In mammalian cells, the fibulin protein family consists of seven members, fibulins 1–7. Fibulins stabilize the structure and integrity of ECM.Citation36–Citation38 In addition, fibulins are also involved in tumorigenesis or vasculogenesis.Citation22,Citation37 Among seven fibulins, fibulin-5 has recently been identified as a potential tumor suppressor in human cancers. Several studies showed that fibulin-5 expression is downregulated in many types of tumors and fibulin-5 may be a negative regulator of growth and metastasis of human cancers, for example, bladder cancer, prostate carcinoma, renal cancer, or hepatocellular carcinoma.Citation39–Citation42 Yi et al,Citation43 Law et al,Citation44 and Alcendor et alCitation45 showed that low level of fibulin-5 associated with a shorter overall survival in patients with glioma. Moreover, no previous study reported the relationship between fibulin-2 and astrocytoma.Citation46 Albig et alCitation47 reported that fibulin-3 is downregulated in peripheral tumors and is considered to inhibit tumor growth. However, Hu et al found that fibulin-3 were highly expressed in glioma and cultured glioma cells compared with normal brain tissues or cultured astrocytes and would results in increasing growth of glioma cells.Citation48–Citation50
In this study, we identified three fibulin proteins, fibulin-1, -2, and -5, in astrocytomas. Fibulin-1 was slightly upregulated in high-grade astrocytomas. This result was similar to IHC data.Citation51 Both fibulin-2 and -5 were downregulated in grade II/III/IV astrocytomas compared with grade I astrocytoma. To confirm the effect of fibulin-2 and -5, U251 cells, a typical glioma cell line, were transfected with the expression vectors of fibulin-2 and -5. Overexpression of fibulin-2 and -5 reduced in vitro proliferation, migration, and invasion by cells. Thus we suggested that fibulin-2 and -5 function as tumor suppressors in glioma. On the contrary, fibulin-3 was highly expressed in glioma, and promotes the movement and invasion of tumor cells and angiogenesis. Although the function was unknown, fibulin-1 was also upregulated in glioma. The fibulin family has a potential role as a diagnostic biomarker and therapeutic target of astrocytoma, and its molecular mechanism needs further study.
Previous studies have identified several candidate biomarkers in different stage of astrocytomas, such as upregulation of calcylin, tubulin-specific chaperone A in grade IV glioma, overexpression of phosphoprotein enriched in astrocytes 15 in grade II and III gliomas, which were consistent with our proteomic study.Citation52–Citation54 The integration of multiomics data analysis by different laboratories would provide more comprehensive information to differentiate and discriminate between different kinds of glioma.
Conclusion
In summary, this study compared the differential tumor tissue proteome among grade I, II, III, and IV astrocytomas. By bioinformatics analysis, cell proliferation, cell invasion, and angiogenesis increased from low- to high-grade astrocytomas. The ECM-related proteins play roles in the pathologic process of astrocytoma. Five identified differential expressing proteins, for example, EGFR, MMP9, TIMP, fibulin-2 and -5 were validated by Western blot. Functional analysis showed that both fibulin-2 and -5 may perform an anticancer effect by inhibiting in vitro cell proliferation, cell migration, and cell invasion in glioma cells. The novel molecular biomarkers are likely to be used for accurate classification of astrocytoma and likely to be the target for drug development.
Author contributions
All authors made substantial contributions to the design and conception; acquisition, analysis or interpretation of data. Authors took part in either drafting or revising the manuscript. TR, SL, and AS carried out experiments and drafted the manuscript. ZW participated in experiments. AS designed the study. At the same time, authors gave final approval of the version to be published; and agree to be accountable for all aspects of the work in ensuring that questions related to the accuracy or integrity of any part of the work are appropriately investigated and resolved.
Acknowledgments
This work is supported by a State Key Laboratory Program Funding (No SKLMN 2014001) from State Key Laboratory of Medical Neurobiology, Fudan University. We thank Dr Zhengguang Guo from the Chinese Academy of Medical Sciences and Peking Union Medical College (Beijing, People’s Republic of China) and Prof Liang in General Hospital of Shenyang Military Area Command (Shenyang, People’s Republic of China) for the help and advice.
Disclosure
The authors report no conflicts of interest in this work.
References
- DeAngelisLMBrain tumorsN Engl J Med2001344211412311150363
- MaherEAFurnariFBBachooRMMalignant glioma: genetics and biology of a grave matterGenes Dev200115111311133311390353
- JayaramSGuptaMKPolisettyRVChoWCSirdeshmukhRTowards developing biomarkers for glioblastoma multiforme: a proteomics viewExpert Rev Proteomics201411562163925115191
- WestermarkBGlioblastoma – a moving targetUps J Med Sci2012117225125622512247
- MerloAGenes and pathways driving glioblastomas in humans and murine disease modelsNeurosurg Rev200326314515812783270
- SoniDKingJAKayeAHHovensCMGenetics of glioblastoma multiforme: mitogenic signaling and cell cycle pathways convergeJ Clin Neurosci20051211515639402
- Cancer Genome Atlas Research NetworkComprehensive genomic characterization defines human glioblastoma genes and core pathwaysNature200845572161061106818772890
- RaoRDJamesCDAltered molecular pathways in gliomas: an overview of clinically relevant issuesSemin Oncol200431559560415497113
- HeJLiuYZhuTCD90 is identified as a candidate marker for cancer stem cells in primary high-grade gliomas using tissue microarraysMol Cell Proteomics2012116M111.010744
- GimenezMSouzaVCIzumiCProteomic analysis of low-to high-grade astrocytomas reveals an alteration of the expression level of raf kinase inhibitor protein and nucleophosminProteomics201010152812282120533335
- PolisettyRVGautamPGuptaMKHeterogeneous nuclear ribonucleoproteins and their interactors are a major class of deregulated proteins in anaplastic astrocytoma: a grade III malignant gliomaJ Proteome Res20131273128313823741984
- OdremanFVindigniMGonzalesMLProteomic studies on low-and high-grade human brain astrocytomasJ Proteome Res20054369870815952716
- SallinenSLSallinenPKHaapasaloHKIdentification of differentially expressed genes in human gliomas by DNA microarray and tissue chip techniquesCancer Res200060236617662211118044
- GuoZLiuXLiMDifferential urinary glycoproteome analysis of type 2 diabetic nephropathy using 2D-LC-MS/MS and iTRAQ quantificationJ Transl Med20151337126608305
- SerraNRosalesRMasanaLVallvéJCSimvastatin increases fibulin-2 expression in human coronary artery smooth muscle cells via RhoA/Rho-kinase signaling pathway inhibitionPLoS One2015107e013387526207907
- QinHShaJJiangCmiR-122 inhibits metastasis and epithelial-mesenchymal transition of non-small-cell lung cancer cellsOncoTargets Ther2015831753184
- ZhuMLiMZhangFFBI-1 enhances ETS-1 signaling activity and promotes proliferation of human colorectal carcinoma cellsPLoS One201495e9804124857950
- CaoPFengFDongGFEstrogen receptor α enhances the transcriptional activity of ETS-1 and promotes the proliferation, migration and invasion of neuroblastoma cell in a ligand dependent mannerBMC Cancer20151549126122040
- JiaHYangQWangTRhamnetin induces sensitization of hepatocellular carcinoma cells to a small molecular kinase inhibitor or chemotherapeutic agentsBiochim Biophys Acta2016186071417143027091611
- ZhaoJBaiZFengFCross-talk between EPAS-1/HIF-2α and PXR signaling pathway regulates multi-drug resistance of stomach cancer cellInt J Biochem Cell Biol201672738826783937
- MiHLazareva-UlitskyBLooRThe PANTHER database of protein families, subfamilies, functions and pathwaysNucleic Acids Res200533Database issueD284D28815608197
- ShengXDChenHWangHFibulin-5 is a prognostic marker that contributes to proliferation and invasion of human glioma cellsAsian Pac J Cancer Prev201516276977325684523
- SangarVFunkCCKusebauchUCampbellDSMoritzRLPriceNDQuantitative proteomic analysis reveals effects of epidermal growth factor receptor (EGFR) on invasion-promoting proteins secreted by glioblastoma cellsMol Cell Proteomics201413102618263124997998
- KumarAEl-OstaAHussainAAMarshallJIncreased sequestration of matrix metalloproteinases in ageing human Bruch’s membrane: implications for ECM turnoverInvest Ophthalmol Vis Sci20105152664267020042661
- YangQFengFZhangFLINE-1 ORF-1p functions as a novel HGF/ETS-1 signaling pathway co-activator and promotes the growth of MDA-MB-231 cellCell Signal201325122652266024012497
- GialeliCTheocharisADKaramanosNKRoles of matrix metalloproteinases in cancer progression and their pharmacological targetingFEBS J20112781162721087457
- WengCJChauCFHsiehYSYangSFYenGCLucidenic acid inhibits PMA-induced invasion of human hepatoma cells through inactivating MAPK/ERK signal transduction pathway and reducing binding activities of NF-kappaB and AP-1Carcinogenesis200829114715618024477
- MurphyGTissue inhibitors of metalloproteinasesGenome Biol2011121123322078297
- TabouretEBoudouresqueFFarinaPMMP2 and MMP9 as candidate biomarkers to monitor bevacizumab therapy in high-grade gliomaNeuro Oncol20151781174117626142442
- MaDJiaHQinMMiR-122 induces radiosensitization in non-small cell lung cancer cell lineInt J Mol Sci2015169221372215026389880
- ChenYFengFGaoXDMiRNA153 reduces effects of chemotherapeutic agents or small molecular kinase inhibitor in HCC cellsCurr Cancer Drug Targets201515317618725714700
- ZerrouqiAPyrzynskaBFebbraioMBratDJVan MeirEGP14ARF inhibits human glioblastoma-induced angiogenesis by upregulating the expression of TIMP3J Clin Invest201212241283129522378045
- NalluriSGhoshal-GuptaSKutiyanawallaATIMP-1 inhibits apoptosis in lung adenocarcinoma cells via interaction with Bcl-2PLoS One2015109e013767326366732
- RojianiMVGhoshal-GuptaSKutiyanawallaAMathurSRojianiAMTIMP-1 overexpression in lung carcinoma enhances tumor kinetics and angiogenesis in brain metastasisJ Neuropathol Exp Neurol201574429330425756591
- HwangCFShiuLYSuLJOncogenic fibulin-5 promotes nasopharyngeal carcinoma cell metastasis through the FLJ10540/AKT pathway and correlates with poor prognosisPLoS One2013812e8421824386352
- NakamuraTLozanoPRIkedaYFibulin-5/DANCE is essential for elastogenesis in vivoNature2002415686817117511805835
- SchiemannWPBlobeGCKalumeDEPandeyALodishHFContext-specific effects of fibulin-5 (DANCE/EVEC) on cell proliferation, motility, and invasion. Fibulin-5 is induced by transforming growth factor-beta and affects protein kinase cascadesJ Biol Chem200227730273672737712021267
- PapkeCLYanagisawaHFibulin-4 and fibulin-5 in elastogenesis and beyond: Insights from mouse and human studiesMatrix Biol20143714214924613575
- WlazlinskiAEngersRHoffmannMJDownregulation of several fibulin genes in prostate cancerProstate200767161770178017929269
- HuZAiQXuHFibulin-5 is down-regulated in urothelial carcinoma of bladder and inhibits growth and invasion of human bladder cancer cell line 5637Urol Oncol201129243043519767220
- OharaHAkatsukaSNagaiHStage-specific roles of fibulin-5 during oxidative stress-induced renal carcinogenesis in ratsFree Radic Res201145221122020942562
- TuKDouCZhengXFibulin-5 inhibits hepatocellular carcinoma cell migration and invasion by down-regulating matrix metalloproteinase-7 expressionBMC Cancer20141493825494879
- YiCHSmithDJWestWWHollingsworthMALoss of fibulin-2 expression is associated with breast cancer progressionAm J Pathol200717051535154517456760
- LawEWCheungAKKashubaVIAnti-angiogenic and tumor-suppressive roles of candidate tumor-suppressor gene, Fibulin-2, in nasopharyngeal carcinomaOncogene201231672873821743496
- AlcendorDJKnobelSDesaiPZhuWQHaywardGSKSHV regulation of fibulin-2 in Kaposi’s sarcoma: implications for tumorigenesisAm J Pathol201117931443145421741351
- BairdBNSchliekelmanMJAhnYHFibulin-2 is a driver of malignant progression in lung adenocarcinomaPLoS One201386e6705423785517
- AlbigARNeilJRSchiemannWPFibulins 3 and 5 antagonize tumor angiogenesis in vivoCancer Res20066652621262916510581
- HuBThirtamara-RajamaniKKSimHViapianoMSFibulin-3 is uniquely upregulated in malignant gliomas and promotes tumor cell motility and invasionMol Cancer Res20097111756177019887559
- HuBNandhuMSSimHFibulin-3 promotes glioma growth and resistance through a novel paracrine regulation of Notch signalingCancer Res201272153873388522665268
- NandhuMSHuBColeSEErdreich-EpsteinARodriguez-GilDJViapianoMSNovel paracrine modulation of Notch-DLL4 signaling by fibulin-3 promotes angiogenesis in high-grade gliomasCancer Res201474195435544825139440
- TownerRAJensenRLVaillantBExperimental validation of 5 in-silico predicted glioma biomarkersNeuro Oncol201315121625163424158112
- SchwartzSAWeilRJThompsonRCProteomic-based prognosis of brain tumor patients using direct-tissue matrix-assisted laser desorption ionization mass spectrometryCancer Res200565177674768116140934
- KalininaJPengJRitchieJCVan MeirEGProteomics of gliomas: Initial biomarker discovery and evolution of technologyNeuro Oncol201113992694221852429
- SurowkaADAdamekDSzczerbowska-BoruchowskaMThe combination of artificial neural networks and synchrotron radiation-based infrared micro-spectroscopy for a study on the protein composition of human glial tumorsAnalyst201514072428243825537755