
 ?Mathematical formulae have been encoded as MathML and are displayed in this HTML version using MathJax in order to improve their display. Uncheck the box to turn MathJax off. This feature requires Javascript. Click on a formula to zoom.
Abstract
This study aimed to identify the genes and pathways associated with smoking-related lung adenocarcinoma. Three lung adenocarcinoma associated datasets (GSE43458, GSE10072, and GSE50081), the subjects of which included smokers and nonsmokers, were downloaded to screen the differentially expressed feature genes between smokers and nonsmokers. Based on the identified feature genes, we constructed the protein–protein interaction (PPI) network and optimized feature genes using closeness centrality (CC) algorithm. Then, the support vector machine (SVM) classification model was constructed based on the feature genes with higher CC values. Finally, pathway enrichment analysis of the feature genes was performed. A total of 213 down-regulated and 83 up-regulated differentially expressed genes were identified. In the constructed PPI network, the top ten nodes with higher degrees and CC values included ANK3, EPHA4, FGFR2, etc. The SVM classifier was constructed with 27 feature genes, which could accurately identify smokers and nonsmokers. Pathways enrichment analysis for the 27 feature genes revealed that they were significantly enriched in five pathways, including proteoglycans in cancer (EGFR, SDC4, SDC2, etc.), and Ras signaling pathway (FGFR2, PLA2G1B, EGFR, etc.). The 27 feature genes, such as EPHA4, FGFR2, and EGFR for SVM classifier construction and cancer-related pathways of Ras signaling pathway and proteoglycans in cancer may play key roles in the progression and development of smoking-related lung adenocarcinoma.
Introduction
Lung cancer is the leading cause of cancer deaths worldwide.Citation1 Non-small cell lung cancer (NSCLC) represents about 85% of all diagnosed lung cancer casesCitation2 and is usually diagnosed in advanced or metastatic stages with a poor overall 5-year survival rate.Citation3 Lung adenocarcinoma is a common histological form of NSCLC and nearly half of the lung cancers diagnosed in the USA are adenocarcinoma. Most cases of lung adenocarcinoma are associated with smoking.Citation4 Bryant and CerfolioCitation5 have reported that cigarette smoking is responsible for ~90% of lung cancers.
Up to now, many studies have been done to explore the gene expression altered by cigarette smoking. For instance, Spira et alCitation6 reported a smoking-related alteration of CYP1B1. NEK2 and CENPF have also been found to be differentially expressed in smoking-related lung cancer.Citation7 Additionally, polymorphisms of CYPIA1 and OST1 have been suggested to be associated with susceptibility to lung cancer in relation to cigarette smoking.Citation8 A recent study by Vucic et alCitation9 found that microRNAs disrupted in a smoking status-dependent manner affected distinct cellular pathways and differentially influenced lung cancer patient prognosis in current, former, and never smokers. Moreover, Karlsson et alCitation10 identified some genomic and transcriptional alterations in lung adenocarcinoma in relation to smoking history. In spite of these findings, we think it is not enough in the clinical practice.
Therefore, in this study, we used three lung adenocarcinoma associated datasets, the subjects of which included smokers and nonsmokers, to screen the differentially expressed feature genes between smokers and nonsmokers. Based on the identified feature genes, we constructed the protein–protein interaction (PPI) network and optimized feature genes using closeness centrality (CC) algorithm. Then, the support vector machine (SVM) classification model was constructed based on the feature genes with higher CC values. Finally, we performed pathway enrichment analysis for the feature genes. To the best of our knowledge, the current approaches, such as PPI network analysis, feature genes optimization, and SVM classification model construction, have not been comprehensively applied in the relevant studies. We aimed to identify the genes associated with smoking in lung adenocarcinoma.
Data and methods
Microarray data
We searched the expression profile datasets from the Gene Expression Omnibus (http://www.ncbi.nlm.nih.gov/geo/) database based on the keywords of lung cancer, homo sapiens, and smoke. The datasets that met the following criteria were included in this study: 1) the data were gene expression profile data; 2) the data were identified from the lung cancer tissues samples in patients with lung adenocarcinoma; 3) the lung adenocarcinoma patients included smokers and nonsmokers; and 4) the number of samples in each dataset was ≥50.
After screening, three gene expression profile datasets, GSE43458, GSE10072, and GSE50081, were selected in this study. GSE43458 contained 110 samples, including 40 smokers, 40 nonsmokers and others (only 80 samples were used in this study); GSE10072 contained 107 samples, including 16 smokers, 42 nonsmokers and others (only 58 samples were used in this study); and GSE50081 contained 116 samples, including 23 smokers and 93 nonsmokers.
Data preprocessing and feature gene identification
In the original microarray data in CEL format, background correction,Citation11 and quartile data normalizationCitation12 using the Affy package (http://www.bioconductor.org/packages/release/bioc/html/affy.html)Citation13 in R were carried out. For the original data in TXT format, the probes were converted into gene symbols through the expression annotation platform and the empty probes were removed. If multiple probes corresponded to the same gene symbol, the mean value was calculated as the gene expression value of this gene. Then the data in GSE10072 and GSE43458 were integrated and the differentially expressed genes (DEGs) were selected using the limma package (http://www.bioconductor.org/packages/release/bioc/html/limma.html).Citation14 The P-value was adjusted according to the Benjamini-HochbergCitation15 method. The adjusted P-value <0.05 and |log2 (fold change)| >0.585 were regarded as the cut-off values. The identified DEGs were considered as feature genes and clustering analysis was then performed. The GSE50081 dataset was used for verification.
PPI network construction
Human protein reference database (HPRD, http://www.hprd.org/)Citation16 is a database of experimentally derived human proteomic information, which includes PPIs, post-translational modifications, and tissue expression. In the present study, we downloaded this database and mapped the identified feature genes to the PPI network. The PPI network was visualized using the Cytoscape (http://www.cytoscape.org/)Citation17 software.
Feature gene optimization
The centrality study is a popular subject in the analysis of networks. CC highlights the players who will be able to contact all other members of the network easily.Citation18 In this study, the close connectivity degree of nodes in the PPI network was calculated based on the CC algorithm as follows:
where V represents the node set; t represents a certain node in the node set; and dG (v,t) represents the sum of the distance from node t to the other nodes. The CC value is between 0 and 1. The greater the value, the stronger the CC of the node.
SVM classification model construction and classification efficiency evaluation
SVM has become a popular classification tool. In this study, based on the CC values of the feature genes, we sorted these genes in the descending order. The integrated data of GSE10072 and GSE43458, including 56 nonsmokers and 82 smokers, were used as the training dataset, on which was then performed optimal SVM classifier training using the R package e1071 (version: 1.6–7).Citation19 The significant feature genes in classifier were used for further analysis.
The remaining dataset of GSE50081 was used as the verification dataset to evaluate the classification efficiency of the constructed optimal SVM classifier. The evaluation indexes included sensitivity, specificity, positive predictive value, negative predictive value, as well as areas under the receiver operating characteristic (ROC) curve.Citation20 In addition, based on the survival time and terminal state of the clinical samples in GSE50081, we conducted the Kaplan–Meier (KM) survival analysis and drew the KM curve.Citation21
Pathways enrichment analysis
Kyoto Encyclopedia of Genes and Genomes (KEGG) pathway enrichment analysis of the feature genes were carried out using the fisher algorithm.Citation22 The formula was as follows:
where N represents the number of genes in whole genome; M represents the number of genes in pathway gene set; K represents the number of DEGs. The Fisher’s score represents the probability of at least x genes being pathway genes in K DEGs.
Results
DEGs analysis
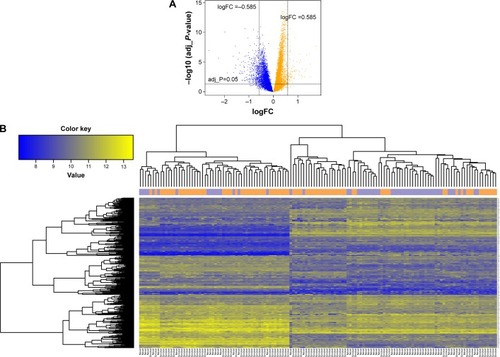
A total of 296 DEGs were selected, including 213 downregulated and 83 upregulated DEGs. The distribution of DEGs is shown in the volcano plot (). In addition, hierarchical clustering analysis of the DEGs and samples showed that DEGs could cluster most of the similar sample together ().
Figure 1 (A) The distribution of DEGs. The orange color represents upregulated genes and blue color represents downregulated genes. (B) The tree diagram of hierarchical clustering analysis of DEGs for smoker and nonsmoker samples. The purple and orange vertical bars above the heat map, respectively, represent lung adenocarcinoma samples of smokers and nonsmokers.
PPI network construction
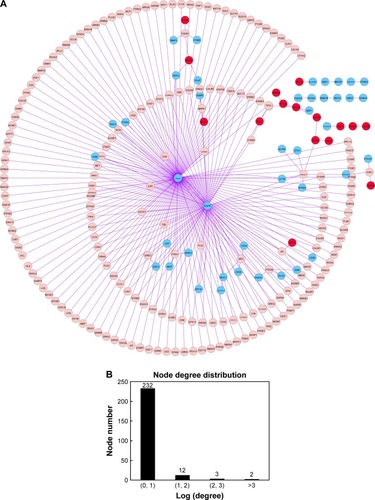
Based on the HPRD database and Cytoscape software, the PPI network was constructed, which included 249 nodes and 263 edges (). There were two kinds of gene nodes: feature gene nodes (58) and extension gene nodes (191). Extension gene was the gene that had direct interactions with at least five feature genes. Additionally, the result of node degree analysis showed that the number of nodes decreased with the increase of node degree, indicating that the PPI network had scale-free feature ().
Figure 2 (A) The constructed PPI network with DEGs. The red node represents upregulated feature genes (DEGs) and the blue node represents downregulated feature genes. The pink node represents extension gene that had direct interactions with at least five feature genes. (B) Node degree distribution of genes in the PPI network. Horizontal axis represents the log-transformed degree and vertical axis represents the number of nodes.
Feature gene optimization
The CC value of each node was calculated based on the CC algorithm. The top 10 nodes with higher CC values, such as ankyrin 3, node of Ranvier (ankyrin G) (ANK3), EPH receptor A4 (EPHA4), fibroblast growth factor receptor 2 (FGFR2), and midline 1 (MID1), are shown in .
Table 1 The top 10 nodes with high CC
SVM classification model construction and classification efficiency evaluation
After sorting the CC values of gene nodes in the descending order, we selected the top 200 gene nodes (including 27 feature genes []) and performed optimal SVM classifier training based on GSE10072 and GSE43458. As shown in , the constructed SVM classifier could accurately identify 55 nonsmokers (55/56, 98.21%) and 80 smokers (80/82, 97.56%). The overall classification accuracy was 97.83% (135/138). Then the expression values of 27 feature were extracted and performed hierarchical clustering analysis for all the training set samples to differentiate the lung adenocarcinoma patients into smokers and nonsmokers. As shown in , the expression values of 27 feature genes could classify the samples.
Figure 3 Sample classification in (A) training set and (B) validation set by SVM classifier.
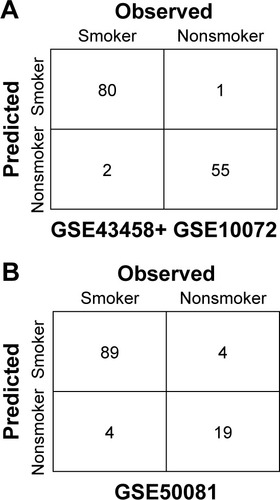
Figure 4 The tree diagram of hierarchical clustering analysis of 27 feature genes for smoker and nonsmoker samples.
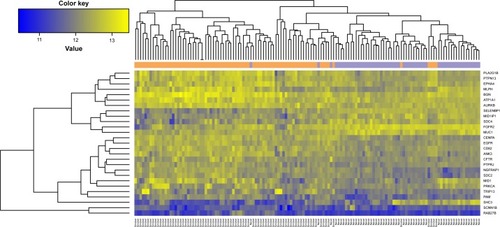
Table 2 The expression difference parameters of 27 feature genes
We used the GSE50081 dataset to verify the repeatability and portability of the classifier constructed by the selected 27 feature genes. As displayed in , the SVM classifier could identify 89 smokers (89/93, 95.7%) and 19 nonsmokers (19/23, 82.61%), and the classification accuracy was 93.10% (108/116). The classification scatter plots of the training and validation sets are shown in and .
Figure 5 Classification spot diagrams of (A) training set and (B) validation dataset, and receiver operating characteristic curves of (C) training set and (D) validation dataset. Green and orange nodes respectively represent lung adenocarcinoma samples of smokers and nonsmokers.
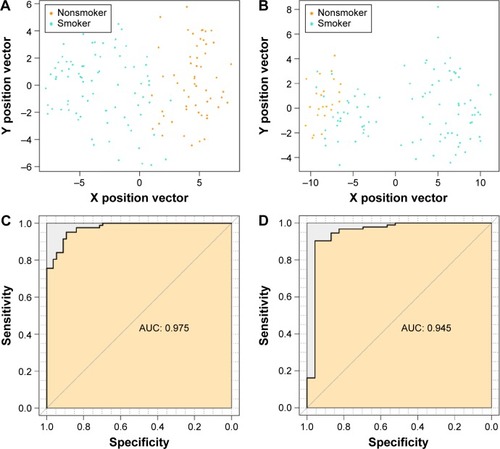
In addition, we evaluated the classification efficiency of the constructed optimal SVM classifier using the indexes of correct rate, sensitivity, specificity, positive predictive and negative predictive values, and areas under the ROC curve. The evaluation result is shown in and and . Furthermore, based on the clinical information of samples in the GSE50081 dataset, which was divided into two groups (nonsmokers and smokers) by SVM classifier, we performed KM survival analysis. There were significant differences in survival time between the samples of smokers and nonsmokers identified from SVM classifier (P=0.0198). The survival rates of smokers decreased very fast in a comparatively short time, while the survival rates of nonsmokers decreased more slowly than that of smokers ().
Figure 6 Kaplan–Meier survival curve of samples in GSE50081 dataset.
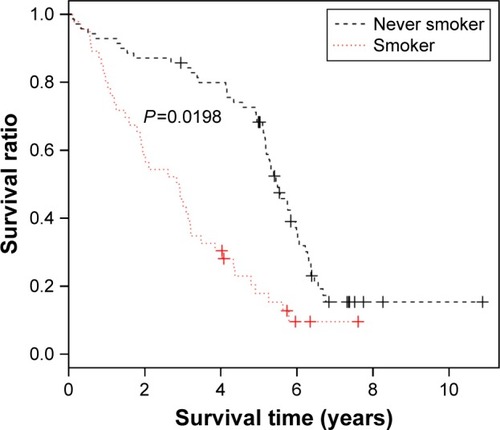
Table 3 The evaluation indexes of SVM classifier in (A) training set and (B) validation set
Pathways enrichment analysis
The 27 feature genes were significantly enriched in five pathways, including pancreatic secretion (PLA2G1B, CFTR, ATP1A1, etc.), aldosterone-regulated sodium reabsorption (ATP1A1, SCNN1B, and PRKCA), proteoglycans in cancer (SDC4, ANK3, EGFR, SDC2, and PRKCA) (http://www.kegg.jp/kegg-bin/show_pathway?hsa05205+8066513+7933772+8132860+8147461+8009301), Ras signaling pathway (FGFR2, PLA2G1B, EGFR, etc.) (http://www.kegg.jp/kegg-bin/show_pathway?hsa04014+7936734+7967034+8132860+8162216+8009301), and ErbB signaling pathway (EGFR, SHC3, and PRKCA) ().
Table 4 Pathways enriched by 27 feature genes
Discussion
Cigarette smoke consists of a complex mixture of chemicals that can cause direct or indirect damage to the respiratory epithelium and its genome.Citation23 Accumulation of genomic alterations has been observed in lung cancers arising in smokers compared to never smokers.Citation24 In this study, we identified 296 DEGs between smokers and nonsmokers. Based on these DEGs and genes in the HPRD database, the PPI network was constructed. The top ten nodes with higher degrees and CC values included ANK3, EPHA4, FGFR2, etc. The SVM classifier constructed with 27 feature genes could accurately identify smokers and nonsmokers. Additionally, KM survival analysis of nonsmokers and smokers indicated that smoking had significant reduction effect on the survival rates of lung adenocarcinoma patients. Therefore, the 27 feature genes may provide reliable data basis and research direction for the diagnosis and treatment of smoking-related lung adenocarcinoma. Pathway enrichment analysis for the 27 feature genes revealed that they were significantly enriched in proteoglycans found in cancer (EGFR, SDC4, ANK3, SDC2, and PRKCA) and Ras signaling pathway (FGFR2, PLA2G1B, EGFR, etc.).
EPHA4 was one of the significant feature genes for SVM classifier construction. EPHA4 is a member of the Eph receptor kinase family, which constitutes one of the largest groups of transmembrane receptor tyrosine kinases.Citation25 The receptor tyrosine kinases play important roles in the regulation of cellular proliferation and differentiation.Citation26 Importantly, studies have found that several members of Eph receptor kinase family have been found to be overexpressed in various cancers.Citation27,Citation28 For instance, EPHA4 expression is frequently functionally altered in breast cancer, gastric cancer, pancreatic adenocarcinoma, and lung adenocarcinoma.Citation29–Citation32 Given the role of EPHA4 in SVM classifier, we speculated that EPHA4 may serve as a smoking-related biomarker in lung adenocarcinoma. In this study, EPHA4 was downregulated in smokers and upregulated in nonsmokers. Therefore, the changes of EPHA4 expression (from upregulation to downregulation) may reflect the development of lung adenocarcinoma from nonsmokers to smokers.
The fibroblast growth factor 2 and its transmembrane tyrosine kinase receptors (FGFRs) make up a complex family of signaling molecules, the dysregulation of which has been implicated in the progression and development of cancer.Citation33 Overexpression of FGFR2 has been detected in NSCLC cell lines.Citation34 In this study, FGFR2 was a key feature gene in the PPI network with higher degree and CC value. Behrens et alCitation35 found that in lung adenocarcinoma specimens, the expression of FGFR2 is significantly higher in never smokers than in smokers. In accordance with the previously mentioned findings, our study also found that FGFR2 was upregulated in nonsmokers compared with smokers. Therefore, the downregulation of this gene may be a biomarker of smoking-related lung cancer.
Interestingly, FGFR2 was enriched in Ras signaling pathway. Ras signaling pathway is one of the best characterized pathways in cancer biology that can be activated by somatic mutation and gene amplification.Citation36 Ras signaling pathway is involved in growth factor receptor activation in tumors.Citation37 Alteration of this pathway has been reported in cancers frequently because of gain-of-function mutations mainly in Ras gene.Citation38 Activating mutations in Ras protein result in constitutive signaling, thereby inhibiting apoptosis and stimulating cell proliferation. Oncogenic mutations in Ras gene have been shown in about 30% of human cancers.Citation39 Presently, Ras signaling pathway has been used as a target in cancer therapy, including lung cancer therapy.Citation40
In addition to FGFR2, EGFR was also enriched in Ras signaling pathway. EGFR is an attractive candidate for a receptor tyrosine kinase mediating autocrine growth in NSCLC.Citation41 Molecular analysis of the responsive lung tumors reveals a significant enrichment for gain-of-function mutations in EGFR.Citation42 About 10%–40% of lung adenocarcinoma displays activating mutations in EGFR.Citation43 Especially, a study by Yanagawa et alCitation44 found that smoking was correlated with the frequencies of EGFR mutations in lung adenocarcinoma. In the PPI network of the present study, EGFR interacted with a large number of genes and occupied the hub position, suggesting its important role in smoking-related lung adenocarcinoma. Taken together, FGFR2 and EGFR may play important roles in the development of smoking-related lung adenocarcinoma through Ras signaling pathway.
Furthermore, in this study, EGFR was also found to be involved in the pathway of Proteoglycans in cancer (hsa05205). Proteoglycans control many normal and pathological processes, such as cell proliferation, adhesion, tissue repair, vascularization, inflammation, and cancer metastasis. Due to the diverse functions, proteoglycans are implicated in tumorigenesis in human cancers.Citation45,Citation46 Altered proteoglycans expression in tumors can affect cancer cell signaling, growth, migration, and angiogenesis.Citation47 The role of proteoglycans in cancer pathways in lung cancer has not been widely investigated, but we speculated that this pathway and its enriched feature genes (EGFR, SDC4, ANK3, SDC2, and PRKCA) may play an important role in smoking-related lung adenocarcinoma.
In conclusion, changes in the expression levels for the 27 feature genes, such as EPHA4, FGFR2, and EGFR for SVM classifier construction may play key roles in the progression and development of smoking-related lung adenocarcinoma, and may be useful biomarkers and therapeutic targets for the treatment of this cancer. Additionally, cancer-related pathways of Ras signaling and proteoglycans found in cancer may also play important roles in smoking-related lung adenocarcinoma. However, validation experiments are needed in the future to confirm our results.
Disclosure
The authors report no conflicts of interest in this work.
References
- SiegelRNaishadhamDJemalACancer statistics, 2012CA Cancer J Clin2012621102922237781
- JemalASiegelRXuJWardECancer statistics, 2010CA Cancer J Clin201060527730020610543
- GoldstrawPCrowleyJChanskyKThe iaslc lung cancer staging project: proposals for the revision of the tnm stage groupings in the forthcoming (seventh) edition of the tnm classification of malignant tumoursJ Thorac Oncol20072870671417762336
- SubramanianJGovindanRLung cancer in never smokers: a reviewJ Clin Oncol200725556157017290066
- BryantACerfolioRJDifferences in epidemiology, histology, and survival between cigarette smokers and never-smokers who develop non-small cell lung cancerChest2007132118519217573517
- SpiraABeaneJShahVEffects of cigarette smoke on the human airway epithelial cell transcriptomeProc Natl Acad Sci U S A200410127101431014815210990
- PetersenSAninat-MeyerMSchlünsKGellertKDietelMPetersenIChromosomal alterations in the clonal evolution to the metastatic stage of squamous cell carcinomas of the lungBr J Cancer2000821657310638968
- NakachiKImaiKHayashiSKawajiriKPolymorphisms of the cyp1a1 and glutathione s-transferase genes associated with susceptibility to lung cancer in relation to cigarette dose in a Japanese populationCancer Res19935313299429998319207
- VucicEAThuKLPikorLASmoking status impacts microrna mediated prognosis and lung adenocarcinoma biologyBMC Cancer201414177825342220
- KarlssonARingnérMLaussMGenomic and transcriptional alterations in lung adenocarcinoma in relation to smoking historyClin Cancer Res201420184912492425037737
- TroyanskayaOCantorMSherlockGMissing value estimation methods for DNA microarraysBioinformatics200117652052511395428
- RaoYLeeYJarjouraDA comparison of normalization techniques for microrna microarray dataStat Appl Genet Mol Biol20087122
- GautierLCopeLBolstadBMIrizarryRAAffy – analysis of affymetrix genechip data at the probe levelBioinformatics200420330731514960456
- SmythGKLimma: linear models for microarray dataGentlemanRCareyVDudoitSIrizarryRHuberWBioinformatics and computational biology solutions using r and bioconductorNew YorkSpringer2005397420
- Reiner-BenaimAFdr control by the bh procedure for two-sided correlated tests with implications to gene expression data analysisBiom J200749110712617342953
- PrasadTKGoelRKandasamyKHuman protein reference database – 2009 updateNucleic Acids Res200937suppl 1D767D77218988627
- ShannonPMarkielAOzierOCytoscape: a software environment for integrated models of biomolecular interaction networksGenome Res200313112498250414597658
- RochatYCloseness centrality extended to unconnected graphs: the harmonic centrality indexASNA2009114
- MukherjeeSRifkinRSupport Vector Machine Classification Of Microarray DataAi Memo Massachusetts Institute of Technology20101514
- FriesRCComputational intelligence in biomedical engineering (Begg R, et al; 2008) [book reviews]IEEE Eng Med Biol Mag200952866
- JagerKJvan DijkPCZoccaliCDekkerFWThe analysis of survival data: the Kaplan–Meier methodKidney Int200874556056518596735
- SubramanianATamayoPMoothaVKGene set enrichment analysis: a knowledge-based approach for interpreting genome-wide expression profilesProc Nat Acad Sci U S A2005102431554515550
- AlavanjaMCBiologic damage resulting from exposure to tobacco smoke and from radon: implication for preventive interventionsOncogene200221487365737512379879
- GovindanRLiDGriffithMGenomic landscape of non-small cell lung cancer in smokers and never-smokersCell201215061121113422980976
- OshimaTAkaikeMYoshiharaKOverexpression of epha4 gene and reduced expression of ephb2 gene correlates with liver metastasis in colorectal cancerIn J Oncol2008333573577
- SchlessingerJUllrichAGrowth factor signaling by receptor tyrosine kinasesNeuron1992933833911326293
- JubbAMZhongFBheddahSEphb2 is a prognostic factor in colorectal cancerClin Cancer Res200511145181518716033834
- NakamuraRKataokaHSatoNEpha2/efna1 expression in human gastric cancerCancer Sci2005961424715649254
- JingXSonokiTMiyajimaMEpha4-deleted microenvironment regulates cancer development of isografted 4t1 murine breast cancer cells via reduction of an igf1 signalCancer Med2016561214122726923183
- DuxburyMSItoHZinnerMJAshleySWWhangEEEpha2: a determinant of malignant cellular behavior and a potential therapeutic target in pancreatic adenocarcinomaOncogene20042371448145614973554
- MiyazakiKInokuchiMTakagiYKatoKKojimaKSugiharaKEpha4 is a prognostic factor in gastric cancerBMC Clin Pathol20131311923738943
- SaintignyPPengSZhangLGlobal evaluation of eph receptors and ephrins in lung adenocarcinomas identifies epha4 as an inhibitor of cell migration and invasionMol Cancer Ther20121192021203222807579
- DaileyLAmbrosettiDMansukhaniABasilicoCMechanisms underlying differential responses to fgf signalingCytokine Growth Factor Rev200516223324715863038
- KuhnHKöpffCKonradJRiedelAGessnerCWirtzHInfluence of basic fibroblast growth factor on the proliferation of non-small cell lung cancer cell linesLung Cancer200444216717415084381
- BehrensCLinHYLeeJJImmunohistochemical expression of basic fibroblast growth factor and fibroblast growth factor receptors 1 and 2 in the pathogenesis of lung cancerClin Cancer Res200814196014602218829480
- LobodaANebozhynMKlinghofferRA gene expression signature of ras pathway dependence predicts response to pi3k and ras pathway inhibitors and expands the population of ras pathway activated tumorsBMC Med Genomics20103111120092628
- YoungALyonsJMillerALPhanVTAlarcónIRMcCormickFRas signaling and therapiesAdv Cancer Res200910211719595305
- SantarpiaLTargeting the mitogen-activated protein kinase ras-raf signaling pathway in cancer therapyPathol Int199646296676728905876
- AdjeiAABlocking oncogenic ras signaling for cancer therapyJ Nat Cancer Inst200193141062107411459867
- SantarpiaLLippmanSMEl-NaggarAKTargeting the mapk–ras–raf signaling pathway in cancer therapyExp Opin Ther Targets2012161103119
- MarekLWareKEFritzscheAFibroblast growth factor (fgf) and fgf receptor-mediated autocrine signaling in non-small-cell lung cancer cellsMol Pharmacol200975119620718849352
- SWHTYKPGHPredictive and prognostic impact of epidermal growth factor receptor mutation in non-small-cell lung cancer patients treated with gefitinibJ Clin Oncol200523112493250115710947
- PaoWChmieleckiJRational, biologically based treatment of egfr-mutant non-small-cell lung cancerNat Rev Cancer2010101176077420966921
- YanagawaNTamuraGOizumiHEndohMSadahiroMMotoyamaTInverse correlation between egfr mutation and fhit, rassf1a and runx3 methylation in lung adenocarcinoma: relation with smoking statusAnticancer Res201131311211121421508367
- PhillipsJJNovel therapeutic targets in the brain tumor microenvironmentOncotarget20123556857522643827
- IozzoRVSchaeferLProteoglycans in health and disease: novel regulatory signaling mechanisms evoked by the small leucine-rich proteoglycansFEBS J2010277193864387520840584
- TheocharisADSkandalisSSNeillTInsights into the key roles of proteoglycans in breast cancer biology and translational medicineBiochim Biophys Acta20151855227630025829250