
Abstract
Background
Despite significant advances in diagnosis and therapy, the rate of survival of patients with oral cancers still remains poor as an appropriate treatment has not been found yet, due to side effects of chemo/radiotherapy.
Aim
This study aimed to identify molecular mechanisms of cell death of oral cancer cells caused by treatment with a nonselective Cox-2 inhibitor in combination with a low-dose chemotherapeutic drug.
Methods
Squamous cell carcinoma (SCC) cells SCC9 and SCC25 were subjected to mono- and combination therapy with nimesulide and cisplatin. Fluorescence-activated cell sorting (FACS), immunohistochemistry, high-pressure liquid chromatography (HPLC), microarray gene chips, and isobaric tags for a relative and absolute quantitation (iTRAQ) system were used.
Results
Increased numbers of apoptotic and necrotic SCC9/SCC25 cells were detected after combined exposure. ATP levels and the energy charge of SCC9 cells were significantly decreased after both individual and combined treatment. We detected and quantified a responsible gene, keratin 6a, and 540 relevant proteins. In SCC25 cells, ATP levels significantly decreased only after combination therapy. After combined treatment of SCC9 cells, significant upregulation of Histon-H2A/H2B/H4 was found, with a local discovery false rate of 0.003 for Histon-H2A and 0.0027 for Histon-H2B, respectively.
Conclusion
Compared to the single-drug treatment, combined treatment of the oral cancer cells with nimesulide and cisplatin increases and induces necrosis and apoptosis through different pathways. A significant effect of the cytoplasmic increase was also observed in histones of cell lines SCC9 and SCC25 that were previously treated with combined nimesulide and cisplatin therapy.
Background
Although prevalent worldwide, oral carcinoma is especially common in India, Pakistan, Taiwan, and France.Citation1 The American Cancer Society estimated that the number of newly discovered cases of head and neck carcinoma in the USA in 2017 would be 49,670, with an estimated 9,700 deaths.Citation2 When considering the number of incident cases in both sexes by region, oral cancers are ranked in the top five in countries with a middle–low sociodemographic index (SDI), whereas it is in second place in South Asia.Citation3 A global burden of disease (GBD) study reveal that the incidence of head and neck cancer amounts to 694 cases per 100,000 persons/year.Citation3 To put this into perspective, currently more cases of oral carcinoma are diagnosed in a year than with cervical or ovarian cancer, and more deaths occur from oral cancer than from melanoma or cervical cancer.Citation3
The rate of survival of patients with oral cancer still remains poor (57%) despite significant advances in diagnosis and treatment.Citation3–Citation5 One reason for the poor prognosis of patients with cancer of the oral cavity is that the mitotic index of these cells is low.Citation6 Because of this low mitotic index, cells have a reduced ability to undergo apoptosis – the regular cell death process that should ensure an elimination of cells with genetic alterations.Citation2 Inappropriate apoptosis is a factor in many human conditions including many types of cancer. The ability to modulate the life or death of a cell is recognized for its immense therapeutic potential.Citation4,Citation5 We believe that revealing the molecular pathways and mechanisms of apoptosis and necrosis of oral cancer cells following combination treatment may not only improve our understanding of the molecular effects of the drug combination but also set the basis for future studies aimed at finding conditions where this drug combination is maximally synergistic.
The aim of this study was to identify molecular mechanisms and impact on death of oral cancer cells that was caused by treatment with the nonselective Cox-2 inhibitor drug nimesulide in combination with a low dose of the chemotherapeutic drug cisplatin by using technologies for genome and proteome analyses.
Material and methods
Cell culture and immunohistochemistry
Head and neck squamous cell carcinoma cell lines (SCC) SCC9 and SCC25 (American Type Culture Collection (ATCC) strains CRL-1628™ and CRL-1629™; American Type Culture Collection, Manassas, VA, USA) were incubated with 100 µmol/L of the nonselective Cox-2 inhibitor nimesulide and/or 0.5 µmol/L of the chemotherapeutic drug cisplatin and then counted after 48 h. Visualization of apoptotic cells was done by immunohistochemistry. Both techniques were performed in exactly the same way as previously published.Citation7 All experiments were carried out in accordance with relevant guidelines and regulations. This study was approved by the Ethics Committee of the University of Medicine, Vienna, Austria. All patient provided written informed consent.
FACS analysis
A flow cytometric apoptosis detection kit (Becton Dickinson, McKinley, MN, USA) was used according to the manufacturers’ instructions. Cell lines SCC9 and SCC25 were double-stained with 10 µL fluorescein isothiocyanate-labeled Annexin-V (R&D Systems, Minneapolis, MN, USA), to detect phosphatidylserine expression on cells during the early apoptotic phases, and with 10 µL 7-amino-actinomycin (7-AAD), to define necrotic cells. Cells positive only for Annexin-V were defined as apoptotic; cells positive for both, Annexin-V and 7-AAD, were identified as necrotic or late apoptotic cells.
cRNA microarray, hybridization, and image analysis
Double-strained cDNA from RNA was used as a template for isolation and preparation of cRNA. Isolation and hybridization of cRNA and scanning of the arrays were performed according to protocols specified by the manufacturer. Hybridization was done using three sets of human U133A GeneChips (Affymetrix, CA, USA). The arrays were scanned using the GeneArray scanner (Affymetrix). Image analysis was performed with GeneChip software (MAS 5.0; Affymetrix).
Determination of adenine nucleotides
The analytical method has been reported previously.Citation8 The program EZchrom Elite (VWR) was used for data requisition and analysis.
iTRAQ labeling
RNA and DNA protein clean up were performed by Wessel–Fluegge precipitation.Citation9 Protein concentration was measured by the Bradford method (2 µL of a 1:10 diluted extract). Purified proteins were further digested and labeled using the isobaric tag for the relative and absolute quantitation (iTRAQ) procedure as described in the “iTRAQ® Reagents Chemical Reference Guide”.Citation10
High-pressure liquid chromatography
Samples were separated on an UltiMate2 nano high-pressure liquid chromatography (HPLC) system (LC Packings, Amsterdam, the Netherlands). Prior to separation, samples were loaded onto the C18 trap column (PepMap C18, 5 mm length ×300 µm ID, 5-µm particles, 100A pore size). The loading buffer was 0.1% trifluoroacetic acid (TFA). Separation of the proteins was performed with the mobile phases A: 0.1% TFA, 5% acetonitrile (ACN); and B: 0.1% TFA, 80% ACN utilizing the following gradient: 0–33 min: 0–8% B, 33–273 min: 8%–36% B, 273–333 min: 36%–60% B, 333–338 min: 60%–90% B, 338–353 min: 90% B, followed by 47-min equilibration with 100% of mobile phase A.
MALDI plate spotting
The nano HPLC system was coupled to a Probot microfraction collector (LC Packings). Concurrent matrix flow (2 mg/mL α-CHCA in 70% ACN 0.1% TFA spiked with 10 fmol/µL Glu-Fib peptide) was 800 nL/min, spot time was 10 s; 1,790 fractions were spotted on an Applied Biosystems Opti-TOF LC/MALDI steel plate (Part No: 1018469).
Mass spectrometry
Mass spectrometry was performed on Applied Biosystems 4800 MALDI TOF mass analyzer. For increased mass accuracy, internal calibration was performed based on the mass of the peptide Glu-Fib m/z =1,570.677 which was present in the matrix. On the first plate, a maximum of three precursors with s/n ≥70 in MS were selected per spot (largest precursors first) and subjected to 5000 shots tandem mass spectrometry (MS/MS), excluding precursors within 300 resolution. The same sample was spotted a second time on another MALDI plate. On this plate, a maximum of three precursors with s/n ≥50 were selected for 4,000 shots of MS/MS, excluding precursors within 200 resolutions. In total, 1,986 MS/MS spectra were obtained from the first LC run, and 2,972 MS/MS spectra from the second LC run. Processing of MS/MS spectra involved smoothing with a Savitzky–Golay filter 7 points across the peak (FWHM) polynomial degree 4. The threshold for fragment on peak detection was s/n≥3 with a cluster threshold s/n≥7.
MS/MS spectra analysis and quantization
Data from both LC runs was analyzed with Protein Pilot 2.0.1 using the Paragon search algorithm. The protein sequence database contained all “human” sequences extracted from the AppliedBiosystems UniCombinedPANTHER_20061012. fasta (Uniprot) database, supplemented with several databases of potential contaminants: ABSciex_ContaminantDB_ 20061201.fasta, common laboratory & dust/contact proteins from the GPM cRAP (common Repository of Adventitious Proteins, http://www.thegpm.org/crap/index.html), a list of keratins extracted from UniSwissPANTHER_20061012. fasta, and a manually created list of potential contaminant proteins frequently used in our laboratory. In total, 540 protein groups could be quantified. For 321 of these protein groups, P-values were available for all three comparisons (C + N versus 0, N versus 0, and C versus 0) and this list (representative member of each protein group, ratios, P-values, and annotation) was exported for further statistical analysis.
Statistical methods
The Affymetrix chips for SCC9 and SCC25 cells were normalized using robust multi-array analysis (RMA). For the acquisition of reliable data, we used triplicate arrays although duplicate arrays are usually recommended.Citation10 Local false discovery rates (lfdr) were calculated for the three comparisons that give the probability of having no effect, given the observed test statistics for each probe set.Citation11 All probe sets with an lfdr <0.2 were considered to be “interesting”. A heat map with a dendogram of the arrays was plotted. All pre-processing steps were performed using R.2.6 and the bioconductor environment (www.bioconductor.org).
Results
Nimesulide–cisplatin treatment induces apoptosis in tumor cells
FACS analysis showed that both agents, alone or in combination, induce apoptosis in both cell lines via activation of caspases compared to the control (). In the SCC9 cell line, a significant increase of apoptotic and necrotic cells is only observed after combined treatment, compared to control (). However, in SCC25 cells, no significant differences were observed. Compared to control () and cisplatin-treated cells (), increasing numbers of apoptotic cells, along with reduction in cell number, were observed after nimesulide () or nimesulide–cisplatin treatment ().
Figure 1 SCC9 and SCC25 after exposure to nimesulide and cisplatin: induction of apoptosis (SCC9: A, SCC25: B) and necrosis (SCC9: C, SCC25: D) is detected by Annexin-V and 7-AAD using flow cytometry, respectively. Adenine nucleotide contents of SCC9 and SCC25 cells were measured after 48-h drug exposure. ATP and energy charge of SCC9 (E, F) and SCC25 (G, H) cells are illustrated. *P<0.05 versus control group indicates statistical significance. Data are mean ± SD of values from at least three experiments for each treatment. Line 1: control; line 2: cisplatin; lane 3: nimesulide, and line 4: nimesulide–cisplatin.
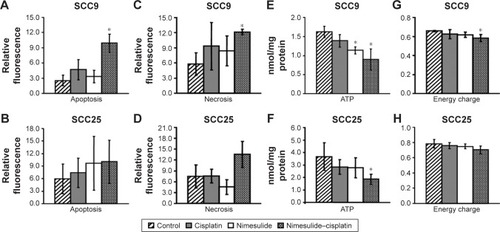
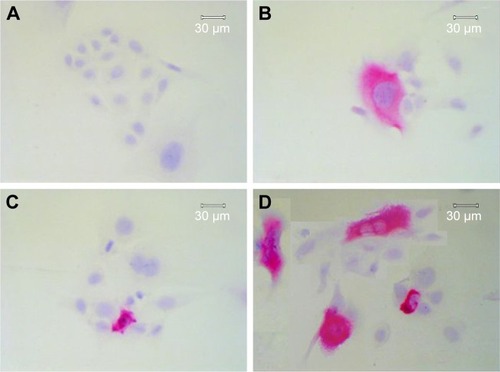
Figure 2 Immunohistochemical detection of apoptotic cells using M30 CytoDeath antibody in SCC9 and SCC25 cells. After 48 h, control SCC25 cells show only slight staining (A), whereas an enrichment of cytoskeletal staining is observed, together with a slight decrease in cell number, after treatment with 0.5 µmol/L cisplatin (B). Treatment with 100 µmol/L nimesulide alone (C) or in combination with 0.5 µmol/L cisplatin (D) reduced the SCC25 cell number and increased the number of apoptotic cells (clear enrichment of cytoskeletal staining). D contains a collage of apoptotic cells after incubation with nimesulide/cisplatin.
Adenine nucleotide
Nimesulide, cisplatin, and nimesulide–cisplatin induced a decrease in ATP concentrations in both cell lines (). The loss of ATP in both cell lines after 48-h treatment was significant for the combined treatment group compared to controls. In the SCC9 cell lines, nimesulide alone also induced a significant decrease of ATP after 48 h. Additionally, the energy charge (ATP +0.5 ADP/AMP + ADP + ATP) of SCC9 cells was significantly decreased after combined treatment (). No significant difference in energy charge was observed for the SCC25 cell line ().
Gene expression profiling
For the comparison of nimesulide versus control and nimesulide–cisplatin versus control, no gene with lfdr <0.2 was identified. For the comparison of cisplatin versus control, one of approximately 22,000 genes – keratin 6a – had a local false discovery of 0.14 in the SCC9 cell line. No gene regulations were detected in the SCC25 cell line. The accession number of our series is “GSE15308”. For information on GEO linking and citing, please refer to http://www.ncbi.nlm.nih.gov/geo/info/linking.html.
Proteome analysis
Because no regulated genes could be identified in the SCC25 cells, proteomic data analyses were only conducted in the SCC9 cell line. A total of 540 proteins were detected and protein ratios and P-values were calculated on the basis of the corresponding peptide ratios (ProteinPilot 2.0.1. info on http://www.cdl-proteome.at/ftp://[email protected]/-_blank). From 540 identified proteins, 60.4% were annotated as metabolic enzymes or associated with biosynthesis or traffic (15.4%), structure (9.4%), cell cycle (10%), signal transduction (8.3%), apoptosis (2.8%), or immunity (7.8%). Among the identified proteins, 10.9% had no functional annotation. The functional classification was similar when only the 321 proteins were considered that were subjected to statistical analysis: biosynthesis or metabolism (64.8%), transport or traffic (15.3%), structure (10.9%), immunity (9.7%), cell cycle (9%), signal transduction (9%), no annotation (7.2%), and apoptosis (2.8%). Only proteins that were twofold up- or downregulated were considered as differentially expressed. For 321 of these proteins, P-values were available for all three comparisons – nimesulide–cisplatin versus control, nimesulide versus control, and cisplatin versus control – and only these proteins were subjected to further statistical analysis to account for multiple hypothesis testing. After statistical analyses, only two hypotheses showed an lfdr <0.2. After SCC9 cells were exposed to nimesulide and cisplatin, the smallest lfdr of 0.003 was found for N=96 (histone H2A type 1–J) and N =30 [lfdr =0.0027, histone H2B type 1-N (H2B.d) (H2B/d)] (). Furthermore, nimesulide and cisplatin induced a significant overexpression of histone H2A type 1–J, histone H2B type 1-N, and histone H4, with a ratio of 3.03, 2.45, and 2.74, respectively. Interestingly, no regulation of these histones could be found after monotherapy with nimesulide and cisplatin treatment (). Moreover, expression of histones after nimesulide–cisplatin exposure was synergistic, more than in single-drug treatment.
Figure 3 Proteomics data supports histone regulation by combination therapy. MS/MS spectra are shown for two iTRAQ-labeled peptides each from histones H2A and H2B, respectively. All peptides were identified with high (99%) confidence with ProteinPilot software. Tables illustrate b- and y-ions matched with experimental data. iTRAQ reporter ions are highlighted in the raw spectra panes. Reporter peaks at m/z =114.1, reflecting combination therapy are considerably more prominent than reporter peaks reflecting single-drug therapy (m/z =115.1 nimesulide, m/z =116.1 cisplatin) or control samples (m/z =117.1). Regulatory ratios were calculated with ProteinPilot software from raw reporter areas, properly accounting for isotope correction and normalization. As nuclei were removed by a centrifugation step during the experimental workflow, ratios observed in the shotgun proteomics experiment should reflect the relative abundance of proteins in the cytosol. We interpret the increased relative ratio of H2A and H2B in the combination therapy sample as further support for increased apoptosis in combination-treated cells, possibly leading to increased release of these histones from nuclei into the cytosolic environment.
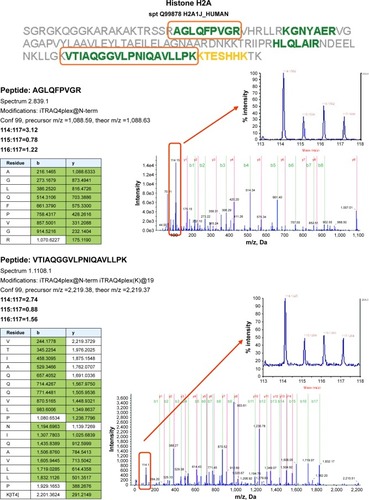
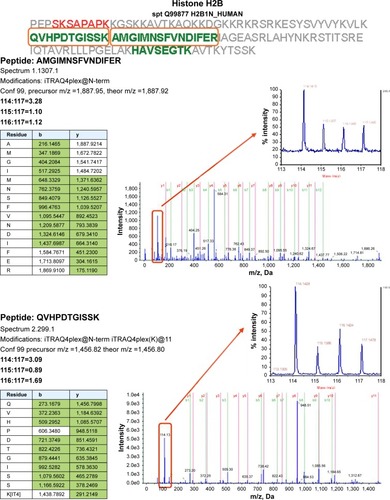
Table 1 List of regulated proteins after exposure to nimesulide and cisplatin
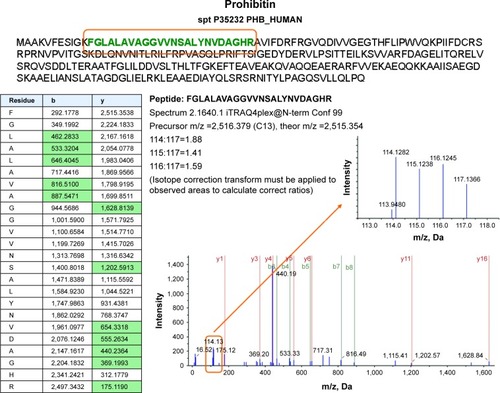
We observed a significant upregulation of alpha-actinin-3 after exposure to nimesulide, and drebrin and tubulin alpha-ubiquitous chain protein after exposure to cisplatin (). Downregulation after nimesulide and cisplatin treatment was also found for the heterogeneous nuclear ribonucleoproteins C1/C2, ACTA2, proteasome subunit beta type 1 and the uncharacterized protein C9orf105, heterogeneous nuclear ribonucleoprotein L protein, respectively (). Additionally, upregulation of prohibitin, an anti-apoptotic protein was observed. In particular, upregulation was slightly higher after nimesulide–cisplatin treatment compared to single-drug treatment ().
Figure 4 Proteome analysis shows a slight regulation of prohibitin, particularly after combined treatment with nimesulide and cisplatin. MS/MS spectra are shown for two iTRAQ-labeled peptides from prohibitin with high (99%) confidence, using ProteinPilot software. Reporter peaks at m/z =114.1 reflecting combination therapy are considerably more prominent than reporter peaks reflecting single-drug therapy (m/z =115.1 nimesulide, m/z =116.1 cisplatin) or control samples (m/z =117.1).
Discussion
Head and neck squamous cell carcinoma is an important cause of morbidity and mortality in addition to being one of the 10 most common cancers worldwide exhibiting marked geographic differences in occurrences.Citation4 Estimates based on the crude incidence rates under the National Cancer Registry Project revealed oral cancer to constitute 12% of all cancers in metropolitan cities, with a frequency of 15%–20% of all cancers reported from various cancer hospitals.Citation4,Citation5,Citation12 An increasing proportion of the burden of cancer falls on low-income and middle-income countries because of not only demographic change but also a transition in risk factors. Prognosis of this disease is still not encouraging, with an overall 5-year survival rate of 57%.Citation2 The ideal treatment has not been found yet, as chemotherapy is unselectively aggressive and leads to cytotoxity.Citation3,Citation5,Citation7 Even in operable stages, the results of standard therapy modalities (surgery or radiotherapy) have been poor, and could cause several short- and long-term side effects. More recent efforts have targeted specific biochemical mechanisms, such as apoptotic pathways.
In this study, we investigated changes in the transcriptome and the proteome of two SCC cell lines of the tongue to identify RNA and proteins involved in cell death that were induced by nimesulide and cisplatin. For the first time, we showed that a combination of nimesulide and low-dose cisplatin acted synergistically in modulating apoptosis of SCC9 and SCC25 cell lines, which could manifest a potent effect when applied together in the treatment of oral squamous carcinoma. As a step toward identifying the appropriate treatment for oral squamous carcinoma, we investigated changes in the transcriptome and the proteome of SCC9 and SCC25 cell lines to identify RNA and proteins that are involved in cell death induced by nimesulide and cisplatin. Furthermore, this is the first study that used complex molecular analyses to map the process of apoptosis and necrosis of oral SCC after combined treatment with nimesulide and cisplatin.
One of the most surprising findings of this study was the strong discrepancy between gene and protein expression. We demonstrated that, in oral cancer cells, DNA damage with subsequent induction of apoptosis and necrosis takes place after combined treatment. However, after gene array analysis, we found that only a single gene that was not linked to cell death was regulated in SCC9 cell lines after exposure to cisplatin. Although the entire experiment was repeated thrice and the analytical methods complied with established quality criteria, no RNA satisfied our criteria of lfdr <0.2 for statistically unequivocal regulation. Therefore, we conclude that alterations in the transcriptome seem too subtle to be detected in the experimental setting. In fact, it is well known that the correlation between RNA and protein levels is often fairly limited and that apoptosis is a process triggered by enzymatic cascades rather than alterations in the transcriptome.Citation12–Citation15 Another point may be that the sparse number of regulated genes is caused by wrong sequence information in the databases or wrong sequences generated during manufacturing of the microarrays.Citation16 On the other hand, we detected and quantified 540 proteins, related to metabolism, transport, cell cycle, and cellular signaling by proteome analysis.
After statistical analysis, three histones were identified – namely, H2A, H2B, and H4 – showing significant upregulation after combined treatment. In general, five major classes of histones – H1, H2A, H2B, H3, and H4 – are essential for the folding of DNA into chromatin. The amino terminal tail of histones is modified particularly by covalent acetylation and methylation.Citation17,Citation18 Hyperacetylation of histone tails is usually a sign of high transcriptional activity, leading to expression of genes that induce growth arrest, cell differentiation, and apoptotic cell death in tumor cells in vitro.Citation19 In contrast, hypoacetylation indicates transcriptional silencing.Citation19 Surprisingly, in our samples, we could not find any acetylation or methylation. We speculate that another mechanism exists whereby histones may modify transcriptional activity of tumor cells and that increase of histone is not a direct causative event that is involved in apoptosis. A loss-of-function or gain-of-function test could be helpful to determine the relationship.
In our samples, we could determine significant increased levels of histones in the cell cytoplasm. Recent studies could show that cytoplasmic translocation of histones is an early event in apoptosis.Citation20,Citation21 As nuclei were removed by centrifugation during sample processing, we interpret the observed increase in histone levels as an indication of histone release from nuclei due to apoptosis in the combination-treated sample, indicating a synergistic effect of nimesulide plus cisplatin treatment. Notably, histone H1.2 was also detected in our study, but was found to be unregulated. This histone is known to induce apoptosis when released from nuclei.Citation22 We should take into consideration the fact that the histone release from nuclei is probably a secondary, rather than a causative, event involved in apoptosis in our experimental setting. A cohort study with analyses of The Cancer Genome Atlas (TCGA) head and neck SCC dataset suggested that zeste homolog 2 (EZH2) activity might influence downstream apoptosis-related genes as well as histone regulation and release. EZH2 contains a SET domain with histone methyltransferase activity, which catalyzes trimethylation of lysine 27 in histone. EZH2 induces chromatin compaction and consequently prevents transcription of target genes.Citation23 However, whether and how EZH2 targets induction of SCC cell apoptosis is still unknown.
Our results obtained by FACS analysis showed that both apoptosis and necrosis occur after exposure to nimesulide and cisplatin. Significantly, more apoptotic and necrotic cells were detected in the SCC9 cell line after combined treatment as compared to the control. This observation can be explained by significant decrease of ATP content and energy charge in these SCC cells. It seems that both mechanisms of cell death exist, depending on the availability of energy and the metabolic status of the tumor cells.Citation24 We suppose that ideal drugs for treatment of oral SCCs would be those that will target cells with low mitotic index and ATP pumps. In addition, it is known that cisplatin damages ATP and proteins involved in the apoptotic process such as p53, Bax, Bcl-2, and caspases, leading to necrotic cell death.Citation25 Thus, we suppose that, depending on the level of cellular damage, necrosis takes place either directly or as a consequence of an unfinished apoptotic program. This could be an explanation for failing to detect any of the known apoptotic proteins in our samples.
The ever-increasing number of tumor-associated anti-gens has provided a major stimulus for the development of therapeutic peptide vaccines. Tumor-associated peptides can induce high immune response rates and have been developed as vaccines for several types of solid tumors, and many are at various stages of clinical testing. Lim et al showed that melanoma antigen MAGED4B is overexpressed in SCC and that this expression promotes proliferation and cell migration. MAGED4B peptides induce antitumor immune responses, advocating that they could be further developed as vaccine candidates for the treatment of SCC.Citation26
Conclusion
Combination therapy with nimesulide and cisplatin acts synergistically in oral SCC cell lines by increasing apoptosis, necrosis, and presence of histones in cytoplasm, more significantly than with single-drug treatment. It seems that both types of cell death exist, depending on the availability of energy and the metabolic status of the tumor cells. We suggest an explanation for this could be the significant decrease of ATP content and energy charge after combined treatment. In addition, we suppose that, depending on the level of cellular damage, necrosis takes place either directly or as a consequence of an unfinished apoptotic program. Future studies should prove whether chemotherapeutic agents are able to target oral carcinoma cells with their low mitotic index and their ATP pumps.
Author contributions
AB and BME wrote the main manuscript text, GM and SH prepared all figures, MChG prepared tables, and SZ conducted statistical analyses. All authors reviewed the manuscript. All authors contributed toward data analysis, drafting and revising the paper and agree to be accountable for all aspects of the work.
Acknowledgments
This study was supported by the “Award for the research development of the city of Vienna’s Fund for Innovative interdisciplinary cancer research” (K-14/03). The sponsor has no role in the study.
Disclosure
The authors report no conflicts of interest in this work.
References
- MayneSMorseDWinnDCancers of the oral cavity and pharynxSchottenfeldDFraumeniJJrCancer Epidemiology and Prevention3rd edNew YorkOxford University Press2006674696
- The American Cancer SocietyCancer Facts & Figures2017Atlanta, USA Available from: https://www.cancer.org/content/dam/cancer-org/research/cancer-facts-and-statistics/annual-cancer-facts-and-figures/2017/cancer-facts-and-figures-2017.pdfAccessed April 16, 2017
- Global Burden of Disease Cancer CollaborationFitzmauriceCAllenCBarberRMGlobal, Regional, and National Cancer Incidence, Mortality, Years of Life Lost, Years Lived With Disability, and Disability-Adjusted Life-years for 32 Cancer Groups, 1990 to 2015: a systematic analysis for the Global Burden of Disease StudyJAMA Oncol20173452454827918777
- SiegelRNaishadhamDJemalACancer statistics, 2012CA Cancer J Clin2012621102922237781
- LarondeDMHislopTGElwoodJMRosinMPOral cancer: just the factsJ Can Dent Assoc200874326927218387267
- KinoshitaYInoueSHonmaYShimuraKDiagnostic significance of nuclear DNA content and nuclear area in oral hyperplasia, dysplasia, and carcinomaJ Oral Maxillofac Surg19925077287331608003
- CzembirekCEder-CzembirekCErovicBMTurhaniDSelzerEThurnherDInhibition of cytotoxicity of cisplatin by cyclooxygenase-2 inhibitor nimesulide in head and neck cancer cell linesOncol Rep201514615231526
- HallströmSGasserHNeumayerCS-nitroso human serum albumin treatment reduces ischemia/reperfusion injury in skeletal muscle via nitric oxide releaseCirculation2002105253032303812081999
- WesselDFlüggeUIA method for the quantitative recovery of protein in dilute solution in the presence of detergents and lipidsAnal Biochem198413811411436731838
- iTRAQ Reagents Chemical Reference Guide. Applied Biosystems Available from: http://www3.appliedbiosystems.com/cms/groups/psm_marketing/documents/generaldocuments/cms_041463.pdfAccessed September 10, 2016
- EfronBLarge-scale simultaneous hypothesis testing: the choice of a null hypothesisJ Am Stat Assoc20049996104
- WoolgarJAHistopathological prognosticators in oral and oropharyngeal squamous cell carcinomaOral Oncol200642322923916150633
- GygiSPRochonYFranzaBRAebersoldRCorrelation between protein and mRNA abundance in yeastMol Cell Biol19991931720173010022859
- ChenYRJuanHFHuangHCQuantitative proteomic and genomic profiling reveals metastasis-related protein expression patterns in gastric cancer cellsJ Proteome Res20065102727274217022644
- KwongKYBloomGCYangISynchronous global assessment of gene and protein expression in colorectal cancer progressionGenomics20058614215815951154
- ShiLPerkinsRGFangHTongWReproducible and reliable microarray results through quality control: good laboratory proficiency and appropriate data analysis practices are essentialCurr Opin Biotechnol2008191101818155896
- BeckHCNielsenECMatthiesenRQuantitative proteomic analysis of post-translational modifications of human histonesMol Cell Proteomics2006571314132516627869
- BerardiPRussellMEl-OstaARiabowolKFunctional links between transcription, DNA repair and apoptosisCell Mol Life Sci200461172173218015338048
- NgHHCicconeDNMorsheadKBOettingerMAStruhlKLysine-79 of histone H3 is hypomethylated at silenced loci in yeast and mammalian cells: a potential mechanism for position-effect variegationProc Natl Acad Sci U S A200310041820182512574507
- WuDIngramALahtiJHApoptotic release of histones from nucleosomesJ Biol Chem200227714120011200811812781
- Nur-E-KamalAGrossSRPanZBalklavaZMaJLiuLFNuclear translocation of cytochrome c during apoptosisJ Biol Chem200427924249112491415073175
- KonishiAShimizuSHirotaJInvolvement of histone H1.2 in apoptosis induced by DNA double-strand breaksCell2003114667368814505568
- ZhouXRenYKongLTargeting EZH2 regulates tumor growth and apoptosis through modulating mitochondria dependent cell-death pathway in HNSCCOncotarget2015632337203373226378043
- LeistMSingleBCastoldiAFKühnleSNicoteraPIntracellular adenosine triphosphate (ATP) concentration: a switch in the decision between apoptosis and necrosisJ Exp Med19971858148114869126928
- GonzalezVMFuertesMAAlonsoCPerezJMIs cisplatin-induced cell death always produced by apoptosis?Mol Pharmacol200159465766311259608
- LimKPChunNAGanCPIdentification of immunogenic MAGED4B peptides for vaccine development in oral cancer immunotherapyHum Vaccin Immunother201410113214322325483651