
Abstract
Prostate cancer, the second most common cancer in men, has been rarely explored by integrating mRNA and miRNA expression profiles. In this study, we combined two mRNA expression datasets and six documented miRNAs to uncover the comprehensive molecular mechanism of prostate cancer. Results showed that a total of 30 genes were significantly differentially expressed in 49 tumor samples by comparing with 22 normal samples. Importantly, all samples from the two datasets can be clearly classified into two groups, tumor group and normal group, based on the selected differentially expressed genes (DEGs). The miRNA–mRNA regulation network indicated that 4 out of 30 DEGs can be regulated by three miRNAs. In addition, prognostic performance validation using in silico databases showed that the DEGs can significantly differentiate between low-risk and high-risk prostate cancer. In summary, multiple biological processes are probably involved in the development and progression of prostate cancer. First, dysregulation of SV2 can regulate transporter and transmembrane transporter activity and then provide the necessary nutrients for tumor cell proliferation. Second, HOXD10 can induce cell proliferation via TCF-4. Finally, dysregulation of CACNA1D can further suppress tumor apoptosis in prostate cancer. The identification of critical genes and valuable biological processes can be useful for the understanding of the molecular mechanism of prostate cancer.
Keywords:
Introduction
Prostate cancer, as the second most common cancer in men and fourth most common tumor type worldwide, is estimated to be diagnosed in 220,800 men in the USA, and almost 12% (27,540) died of their disease.Citation1,Citation2 The World Health Organization (WHO)’s report in 2012 shows that the incidence rates were estimated to be 10.5% and 4.5% in east and south-central Asia, respectively.Citation3 In recent years, however, the incidence and mortality rate of prostate cancer have experienced a steady increase in some Asian countries.Citation3 The primary prostate cancer has a 5-year survival rate of nearly 100%, and the distant metastasis has a 5-year survival rate of 28%.Citation4 Various factors contribute to the incidence of prostate cancer including genetic, age, lifestyle and race.Citation5
In the current era, several prostate cancer biomarkers have been approved by the US Food and Drug Administration (FDA). One of these is PCa antigen 3 (PCA3) which is specifically upregulated in tumor tissues.Citation6 Another one is PSA isoform (ProPSA) which can distinguish tumor tissues from normal tissues.Citation7 In recent years, molecular and genetic profiles have been widely used for the screening of therapeutic targets. The fusion of androgen-regulated promoters with ERG and E26 transformation-specific (ETS) family members has been identified as the most common alteration in prostate cancer genome.Citation8 Tomlins et al’sCitation8 study shows that approximately 40%–50% of prostate cancers have TMPRSS2-ERG fusion. MALAT-1 fragment named as MD-miniRNA has been reported to differentiate prostate tumor and normal samples with the sensitivity of 56.6% and specificity of 84.8%.Citation9 Somatic point mutations such as SPOP, TP53, FOXA1 and PTEN also have been frequently identified in prostate cancer.Citation10 In addition, gene expression signatures of prostate cancer have been widely revealed based on oligonucleotide or cDNA microarray technology. One gene that encodes the serine protease hepsin was identified to be upregulated in malignant prostate tumor samples.Citation11 The protein level of two genes, hepsin and pim-1, was significantly correlated with clinical outcome based on tissue microarray.Citation12 In addition, the overexpression of genes that participated in multiple signal pathways especially cell cycle regulation, DNA replication and DNA repair was significantly related to proliferation rate of metastatic prostate cancer.Citation13 Although various studies have been carried out based on microarray or next-generation sequencing (NGS) technologies, studies by integrating mRNA and miRNA expression profiles are rare in prostate cancer. More and more publicly available datasets were submitted to Gene Expression Omnibus (GEO) database with the development of technologies. In this study, to gain further insight into the molecular mechanism of prostate cancer, we comprehensively characterized the expression profiles of 49 prostate tumor samples. First, the significant common differentially expressed genes (DEGs) from two datasets were identified using advanced bioinformatic algorithms. Then, the common DEGs were subject to gene ontology (GO) and Kyoto Encyclopedia of Genes and Genomes (KEGG) pathway enrichment analysis. Further, the regulation network between mRNA and six reported miRNAs was constructed. Finally, prognostic performance of the common DEGs was validated in silico using SurvExpress online database.
Materials and methods
mRNA and miRNA expression profiles download
A lot of publicly available gene expression profiles have been submitted to GEO or ArrayExpress database in recent years. In this study, we carefully searched the GEO database and downloaded two representative mRNA expression profiles of prostate cancer. One dataset, with GEO accession number GSE46602, was deposited by Mortensen et al,Citation14 and this dataset consisted of 36 tumor tissues and 14 normal tissues. Another dataset named GSE55945 was submitted by Arredouani et alCitation15 which contains 13 tumor tissues and eight normal tissues. The two datasets were obtained from Affymetrix Human Genome U133 Plus 2.0 Array. Detailed sample information and experiment design can be obtained from previous published papers.
Identification of DEGs
To explore the significant DEGs in prostate cancer, two datasets were carefully analyzed with in-house pipeline based on R language and public annotation databases. Briefly, mRNA expression values from the two datasets were subject to background correction to reduce noise. Then, normalization and log2 transformation of the expression values were carried out using GeneChip Robust Multi-array Analysis (GC-RMA) algorithm.Citation16 In addition, control probe sets or uninformative probe sets were removed, and the mean expression value was calculated for the genes with multiple probes. Finally, DEGs between tumor and normal tissues were screened out using algorithm within Limma (linear models for microarray analysis) package.Citation17 Criteria for DEG selection were set to adjust P-value ≤0.05 and absolute log2 fold change ≥2 which can significantly reduce false positive. In addition, common DEGs between the two datasets were figured out based on Venn diagram, and the expression pattern of the common DEGs in all samples was constructed by using heatmap. 2 method within ggplot package.Citation18
GO and KEGG pathway annotation
To explore biological functions of the DEGs, the identified common DEGs were further subject to GO and KEGG pathway enrichment using online tool of DAVID (Database for Annotation, Visualization and Integrated Discovery).Citation19 All parameters were set as default, and the GO terms consisted of biological process (BP), cellular component (CC) and molecular function (MF).
mRNA–miRNA regulation network construction
More and more investigations have shown that miRNA can regulate tumor-related mRNA expression and play an important role in the whole process of tumor.Citation20 In the study by Alhasan et al,Citation21 six miRNAs, including miR-605-5p, miR-135a-3p, miR-495-5p, miR-433-5p, miR-371a-3p and miR-106a-5p, were demonstrated to be significantly up/down-expressed in prostate cancer. Blind studies also validated that the six miRNAs can differentiate prostate cancer patients from healthy people with 89% accuracy.Citation21 Based on the six miRNAs, we constructed the regulation network using CyTargetLinker plugin in Cytoscape.Citation22 In brief, target genes for the six miRNAs were predicted using microCosm, mirTarbase and TargetScan databases. Then, intersection between the common DEGs and target genes were selected and subject to Cytoscape.
Prognostic performance of the common DEGs
It is critical to validate the clinical outcomes of identified common DEGs for the diagnosis or treatment of prostate cancer. In this study, in silico validation was conducted using SurvExpress online tool that is based on publicly available mRNA expression profiles with clinical outcomes.Citation23 Two datasets, GSE16560 and GSE40272, were used, and parameters were carefully selected with the instruction from the developer. In brief, we need to input our list of genes, select tissues, datasets, and set survival analysis options. The censored parameter was set to survival_month. All the samples were used as train set and test set for the estimation of beta coefficient using Cox model and the estimation of prognostic index. The optional weight parameter was estimated as the beta coefficient from the Cox model. Other parameters were left as default. Detailed sample information for the two datasets can be obtained from previous reports.Citation24,Citation25
Results
Identification of DEGs in prostate cancer
To identify significant DEGs, the gene expression values were subject to preprocessing first. shows that the values are almost at the same level for the two datasets after normalization. Then, significant DEGs were figured out by applying robust empirical Bayesian method. Results showed that a total of 286 and 51 genes in GSE46602 and GSE55945, respectively, were significantly dysregulated in tumor samples. In GSE46602, 90 genes (31.5%) were upregulated and 196 genes were downregulated (68.5%), and in GSE55945, 32 genes (62.7%) were upregulated and 19 genes were down-regulated (37.3%). In addition, 30 genes were found to be simultaneously differentially expressed in both GSE46602 and GSE55945 (), and the fold change and adjusted P-value are listed in . In addition, fold change correlation of the common DEGs was 0.78 (), which indicates that the expression level of the common DEGs was consistent between the two datasets. Further, the expression pattern of the common DEGs in all samples was constructed and subject to hierarchical clustering. shows that tumor (red) and normal (blue) samples can be clearly classified into two different subgroups except for Normal_18 and Normal_1. Error assignment for these two samples was probably due to tumor heterogeneity or variation in expression values.
Figure 1 Boxplots for gene expression of each sample in GSE46602 (A) and GSE55945 (B).
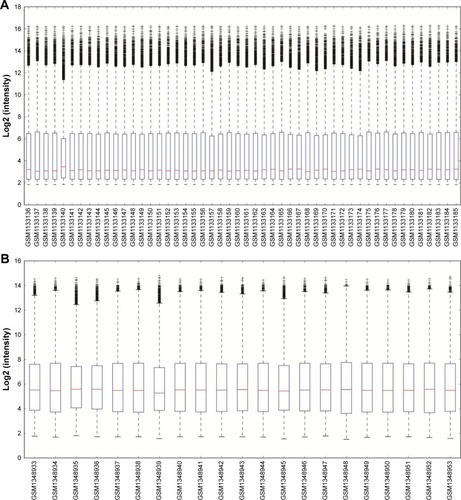
Figure 2 Venn diagram of the DEGs in GSE46602 and GSE55945 (A) and fold change correlation between the two datasets (B).
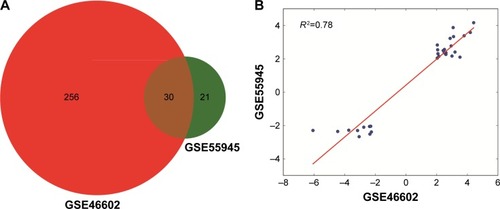
Figure 3 Heat map showing the expression pattern of 30 common DEGs in all tumor and normal samples.
Abbreviation: DEGs, differentially expressed genes.
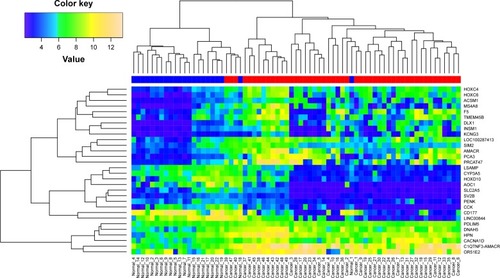
Table 1 The identified 30 common DEGs in GSE46602 and GSE55945
GO and KEGG pathway annotation
To obtain the corresponding biological functions of the common DEGs, functional annotations were carried out using DAVID online tool that is based on GO and KEGG pathway database. As listed in , SLC2A5 and CACNA1D can be enriched into carbohydrate digestion and absorption KEGG pathway. GO annotation results indicated that the common DEGs were mainly related to the BP of xenobiotic metabolic process, anterior/posterior pattern specification, locomotory exploration behavior, proximal/distal pattern formation and behavioral fear response with P-value of <0.05 (). In addition, four MF terms including sequence-specific DNA binding, transcription factor activity, sequence-specific DNA binding and neuropeptide hormone activity were enriched with P-value of <0.05 (). CC annotation showed that HPN, SLC2A5, F5, etc mainly located on plasma membrane ().
Table 2 KEGG pathway and GO enrichment results for the common DEGs
miRNA–mRNA regulation network
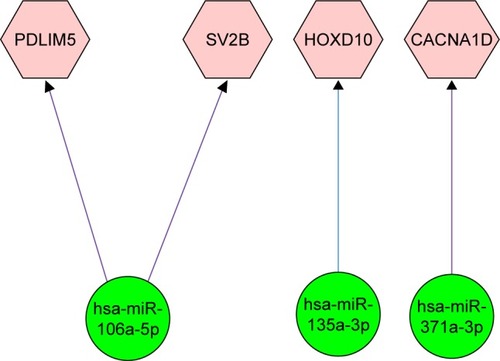
Further dysregulation mechanism of the common DEGs was explored by constructing miRNA–mRNA regulation network. Prediction results showed that the six miRNAs can target 15, 1,252 and 2,046 genes in miRTarBase, TargetScan and MicroCosm databases, respectively. In addition, four out of the predicted target genes can be identified in the common DEGs. Based on the miRNA–mRNA pairings constructed using Cytoscape, we can find that miR-106a-5p can regulate the expression of PDLIM5 and SV2B (). Also, miR-135a-3p and miR-371a-3p can regulate the expression of HOXD10 and CACNA1D, respectively ().
Figure 4 Regulation network between the identified common DEGs and reported miRNAs.
Abbreviation: DEGs, differentially expressed genes.
Prognostic performance of the common DEGs
Clinical outcome validation is critical for the identification of biomarker in cancer research. In this study, two independent publicly available datasets, GSE16560 and GSE40272, were used to validate the prognostic performance of the identified common DEGs. Survival analysis based on clinical information from the two datasets showed that high-/low-risk prostate cancer group can be significantly differentiated in the two datasets with P-value 1.9E–7 and 1.0E–5, respectively (). In addition, higher concordance index (CI) indicated that the common DEGs can be used for the prediction of prognostic performance ().
Figure 5 Kaplan–Meier curves of GSE16560 dataset (A) and GSE40272 (B).
Abbreviation: CI, concordance index.
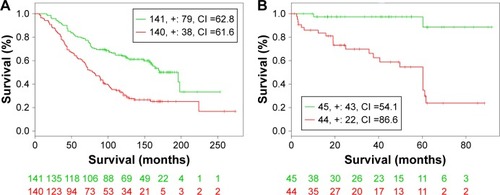
Table 3 Virtual validation results of prognostic performance
Discussion
The comprehensive analysis based on mRNA and miRNA expression profiles advanced the understanding of the molecular mechanism of prostate cancer. A total of 30 DEGs were identified in 49 tumor samples by comparing with normal samples. Importantly, all tumor and normal samples can be clearly classified into two groups based on the identified DEGs.
KEGG pathway annotation showed that SLC2A5 and CACNA1D participated in the carbohydrate digestion and absorption pathway. The protein encoded by SLC2A5 is a fructose transporter responsible for fructose uptake,Citation26 and the protein encoded by CACNA1D is the alpha-1D subunit of calcium channel.Citation27 Enhanced growth and proliferation of tumor cells place increased demand for nutrients for the synthesis of DNA and protein.Citation28 The dysregulation of transporter and calcium channel probably increase the availability of nutrients.Citation29
The complex molecular mechanism of prostate cancer was further unveiled by miRNA–mRNA regulation network. The regulation network showed that miR-106a-5p can regulate the expression of SV2B (). This gene encodes a member of the synaptic vesicle protein 2 family which participates in the regulation of vesicle trafficking and exocytosis.Citation30 Expressed sequence tag (EST) analysis results showed that SV2B was differentially expressed in prostate cancer.Citation31 GO annotations related to this gene included transporter activity and transmembrane transporter activity. Report also showed that SV2 can recruit glucose-evoked granules to the plasma membrane.Citation32 Due to high demand of nutrient for tumor generation and metastasis, the dysregulation of SV2 in prostate cancer can provide necessary nutrient.
Another critical gene is HOXD10 which is the target of miR-135a-3p (). This gene belongs to homeobox (Hox) superfamily and encodes transcription factors that control cell differentiation and morphogenesis during development.Citation33,Citation34 Documents showed that tumor growth can be suppressed with ectopic expression of HOXB13 via downregulation of β-catenin–TCF pathway.Citation35 Jung et al’sCitation34 study also demonstrated that HOXB13 can negatively regulate the expression of TCF-4 and then suppress cell proliferation in prostate cancer. Expression study also shows that HOXD10 is commonly downregulated in gastric tumor tissue compared with normal stomach tissue. Functional analysis revealed that HOXD10 can upregulate IGFBP3, which can activate caspase-3 and caspase-8 and subsequently induce cell apoptosis. All the results suggest that HOXD10 probably functions as a tumor suppressor in prostate cancer.
In addition, CACNA1D was significantly dysregulated and can be regulated by miR-371a-3p (). This gene encodes the alpha-1D subunit of calcium channel. Calcium channel has been demonstrated to contribute to cell proliferation, differentiation and apoptosis. Calcium channel blocker has an important regulatory role and can affect malignant transformation in prostate cancer.Citation36 It has also been documented that Ca2+ signaling participated in androgen-induced PSA secretion. Prostate cancer cell proliferation and androgen receptor-mediated gene expression are significantly suppressed with the addition of nifedipine and tetrandrine.Citation37 In addition, knocking down of CACNA1D by siRNA can abrogate androgen receptor transactivation.Citation37
Apart from the abovementioned genes, several novel or rarely reported genes such as PDLIM5, HOXC4 and PENK were also identified in prostate cancer.
Conclusion
Multiple biological processes probably involved in the development and progression of prostate cancer. First, the dysregulation of SV2 can regulate transporter and transmembrane transporter activity and then provide necessary nutrient for tumor cell proliferation. Then, HOXD10 can induce cell proliferation via TCF-4. Finally, the dysregulation of CACNA1D can further suppress tumor apoptosis.
Author contributions
All authors contributed toward data analysis, drafting and critically revising the paper, gave final approval of the version to be published, and agree to be accountable for all aspects of the work.
Acknowledgments
This work was supported by grants from the Natural Science Foundation of Jiangsu Province (BK20160481), the Project for Medical Young Talents of Jiangsu Province (QNRC2016360) and the Natural Science Foundation of Yangzhou (YZ2015111).
Disclosure
The authors report no conflicts of interest in this work.
References
- SiegelRLMillerKDJemalACancer statistics, 2015CA Cancer J Clin201565152925559415
- Cancer Genome Atlas Research NetworkThe molecular taxonomy of primary prostate cancerCell201516341011102526544944
- ChenRRenSYiuMKProstate cancer in Asia: a collaborative reportAsian J Urol2014111529
- EdwardsBKNooneAMMariottoABAnnual Report to the Nation on the status of cancer, 1975–2010, featuring prevalence of comorbidity and impact on survival among persons with lung, colorectal, breast, or prostate cancerCancer201412091290131424343171
- Al OlamaAAKote-JaraiZBerndtSIA meta-analysis of 87,040 individuals identifies 23 new susceptibility loci for prostate cancerNat Genet201446101103110925217961
- HaeseAde la TailleAvan PoppelHClinical utility of the PCA3 urine assay in European men scheduled for repeat biopsyEur Urol20085451081108818602209
- GuazzoniGNavaLLazzeriMProstate-specific antigen (PSA) isoform p2PSA significantly improves the prediction of prostate cancer at initial extended prostate biopsies in patients with total PSA between 2.0 and 10 ng/ml: results of a prospective study in a clinical settingEur Urol201160221422221482022
- TomlinsSARhodesDRPernerSRecurrent fusion of TMPRSS2 and ETS transcription factor genes in prostate cancerScience2005310574864464816254181
- RenSWangFShenJLong non-coding RNA metastasis associated in lung adenocarcinoma transcript 1 derived miniRNA as a novel plasma-based biomarker for diagnosing prostate cancerEur J Cancer201349132949295923726266
- BarbieriCEBacaSCLawrenceMSExome sequencing identifies recurrent SPOP, FOXA1 and MED12 mutations in prostate cancerNat Genet201244668568922610119
- MageeJAArakiTPatilSExpression profiling reveals hepsin overexpression in prostate cancerCancer Res200161155692569611479199
- DhanasekaranSMBarretteTRGhoshDDelineation of prognostic biomarkers in prostate cancerNature2001412684982282611518967
- LaTulippeESatagopanJSmithAComprehensive gene expression analysis of prostate cancer reveals distinct transcriptional programs associated with metastatic diseaseCancer Res200262154499450612154061
- MortensenMMHoyerSLynnerupASExpression profiling of prostate cancer tissue delineates genes associated with recurrence after prostatectomySci Rep201551601826522007
- ArredouaniMSLuBBhasinMIdentification of the transcription factor single-minded homologue 2 as a potential biomarker and immunotherapy target in prostate cancerClin Cancer Res200915185794580219737960
- GentlemanRCCareyVJBatesDMBioconductor: open software development for computational biology and bioinformaticsGenome Biol2004510R8015461798
- KerrMKLinear models for microarray data analysis: hidden similarities and differencesJ Comput Biol200310689190114980016
- HadleyWGgplot2: Elegant Graphics for Data AnalysisSwitzerlandSpringer2016
- DennisGJrShermanBTHosackDADAVID: database for annotation, visualization, and integrated discoveryGenome Biol2003453
- AcunzoMCroceCMMicroRNA in cancer and cachexia – a mini-reviewJ Infect Dis2015212suppl 1S74S7726116737
- AlhasanAHScottAWWuJJCirculating microRNA signature for the diagnosis of very high-risk prostate cancerProc Natl Acad Sci U S A201611338106551066027601638
- ShannonPMarkielAOzierOCytoscape: a software environment for integrated models of biomolecular interaction networksGenome Res200313112498250414597658
- Aguirre-GamboaRGomez-RuedaHMartinez-LedesmaESurvExpress: an online biomarker validation tool and database for cancer gene expression data using survival analysisPLoS One201389e7425024066126
- SbonerADemichelisFCalzaSMolecular sampling of prostate cancer: a dilemma for predicting disease progressionBMC Med Genomics20103820233430
- GulzarZGMcKenneyJKBrooksJDIncreased expression of NuSAP in recurrent prostate cancer is mediated by E2F1Oncogene2013321707722349817
- YouJWangLHuangJLow glucose transporter SLC2A5-inhibited human normal adjacent lung adenocarcinoma cytoplasmic pro-B cell development mechanism networkMol Cell Biochem20153991–2717625326153
- PinggeraALiebABenedettiBCACNA1D de novo mutations in autism spectrum disorders activate Cav1.3 L-type calcium channelsBiol Psychiatry201577981682225620733
- GanapathyVThangarajuMPrasadPDNutrient transporters in cancer: relevance to Warburg hypothesis and beyondPharmacol Ther20091211294018992769
- MoscatJRichardsonADiaz-MecoMTNutrient stress revamps cancer cell metabolismCell Res201525553753825828529
- FukusumiYWakamatsuATakashimaNSV2B is essential for the integrity of the glomerular filtration barrierLab Invest201595553454525730372
- CleggNFergusonCTrueLDMolecular characterization of prostatic small-cell neuroendocrine carcinomaProstate2003551556412640661
- IezziMTheanderSJanzRLozeCWollheimCBSV2A and SV2C are not vesicular Ca2+ transporters but control glucose-evoked granule recruitmentJ Cell Sci2005118pt 235647566016306227
- SamuelSNaoraHHomeobox gene expression in cancer: insights from developmental regulation and deregulationEur J Cancer200541162428243716199152
- JungCKimRSLeeSJWangCJengMHHOXB13 homeodomain protein suppresses the growth of prostate cancer cells by the negative regulation of T-cell factor 4Cancer Res20046493046305115126340
- JungCKimRSZhangHHOXB13 is downregulated in colorectal cancer to confer TCF4-mediated transactivationBr J Cancer200592122233223915928669
- ShapovalovGSkrymaRPrevarskayaNCalcium channels and prostate cancerRecent Pat Anticancer Drug Discov201381182622694290
- GrahamSMHolzbeierleinJMThrasherJBLiBCalcium channel blocker modulates androgen receptor-mediated gene expression and induces cytotoxicity in prostate cancer cellsJ Urol20121874e94